| Param | Original file | Final file |
|---|---|---|
| Filename | modeM0/AS1A09_038T29_9000003954_27544cztM0_level2.evt | modeM0/AS1A09_038T29_9000003954_27544cztM0_level2_quad_clean.evt |
| Size (bytes) | 387,714,240 | 80,611,200 |
| Size | 369.8 MB | 76.9 MB |
| Events in quadrant A | 2,439,225 | 537,433 |
| Events in quadrant B | 2,874,909 | 547,050 |
| Events in quadrant C | 2,430,078 | 537,349 |
| Events in quadrant D | 3,681,709 | 492,814 |
| Mode M0 | |||
|---|---|---|---|
| Quadrant | BADHDUFLAG | Total packets | Discarded packets |
| A | 0 | 10082 | 0 |
| B | 0 | 11495 | 0 |
| C | 0 | 9954 | 0 |
| D | 0 | 14119 | 0 |
| Mode M9 | |||
|---|---|---|---|
| Quadrant | BADHDUFLAG | Total packets | Discarded packets |
| A | 0 | 12 | 0 |
| B | 0 | 12 | 0 |
| C | 0 | 12 | 0 |
| D | 0 | 12 | 0 |
| Quadrant | Total seconds | Saturated seconds | Saturation percentage |
|---|---|---|---|
| A | 4641 | 61 | 1.314372% |
| B | 4641 | 170 | 3.663004% |
| C | 4641 | 45 | 0.969619% |
| D | 4641 | 325 | 7.002801% |
Noise dominated data is calculated using 1-second bins in cleaned event files. If a bin has >2000 counts, and if more than 50% of those come from <1% of pixels, then it is considered to be noise-dominated and hence unusable.
| Quadrant | # 1 sec bins | Bins with >0 counts | Bins with >2000 counts | High rate bins dominated by noise | Noise dominated (total time) | Noise dominated (detector-on time) | Marked lightcurve |
|---|---|---|---|---|---|---|---|
| A | 5921 | 4642 | 41 | 41 | 0.69% | 0.88% | 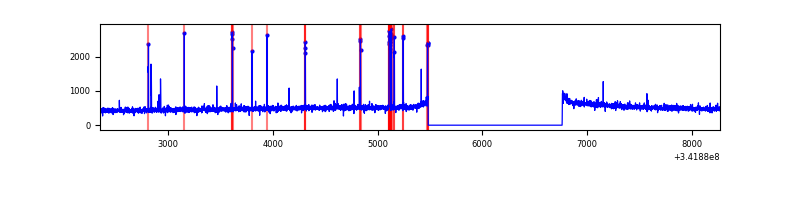 |
| B | 5921 | 4642 | 106 | 106 | 1.79% | 2.28% | 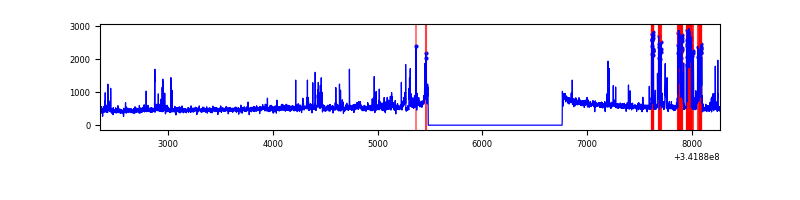 |
| C | 5921 | 4642 | 0 | 0 | 0.00% | 0.00% | 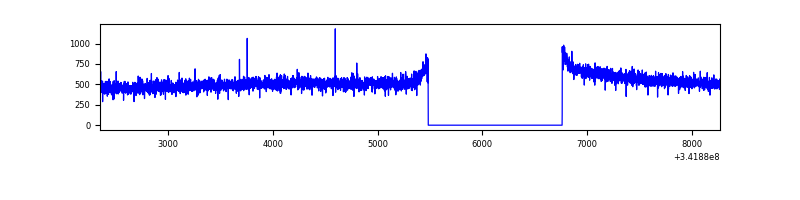 |
| D | 5921 | 4641 | 201 | 201 | 3.39% | 4.33% | 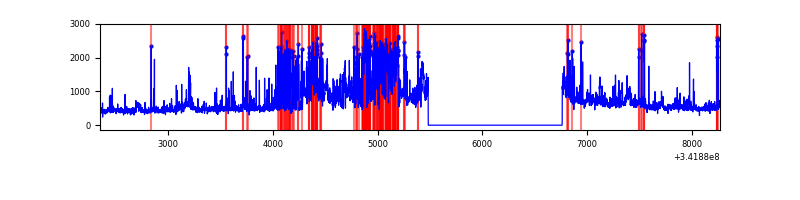 |
Top three noisy pixels from each quadrant. If the there are fewer than three noisy pixels in the level2.evt file, extra rows are filled as -1
| Pixel properties | Quadrant properties | ||||||
|---|---|---|---|---|---|---|---|
| Quadrant | DetID | PixID | Counts | Sigma | Mean | Median | Sigma |
| A | 6 | 16 | 119864 | 999.61 | 601 | 591 | 119.3 |
| A | 13 | 254 | 7680 | 59.41 | 601 | 591 | 119.3 |
| A | 3 | 137 | 5390 | 40.22 | 601 | 591 | 119.3 |
| B | 10 | 245 | 468672 | 4202.64 | 601 | 587 | 111.4 |
| B | 15 | 32 | 21794 | 190.4 | 601 | 587 | 111.4 |
| B | 0 | 230 | 17417 | 151.11 | 601 | 587 | 111.4 |
| C | 14 | 238 | 97856 | 702.49 | 597 | 601 | 138.4 |
| C | 13 | 61 | 4121 | 25.43 | 597 | 601 | 138.4 |
| C | 7 | 221 | 2528 | 13.92 | 597 | 601 | 138.4 |
| D | 1 | 52 | 1437745 | 10463.19 | 579 | 564 | 137.4 |
| D | 2 | 250 | 32306 | 231.09 | 579 | 564 | 137.4 |
| D | 12 | 227 | 15539 | 109.02 | 579 | 564 | 137.4 |
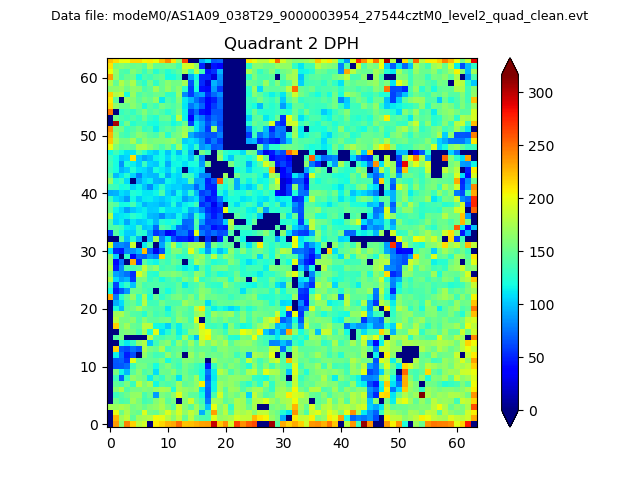
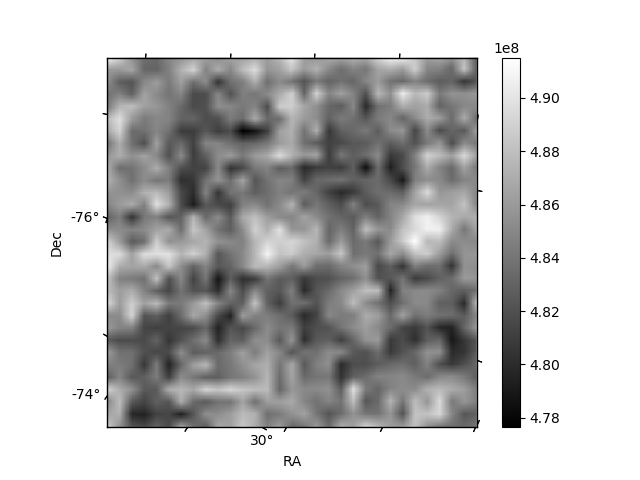
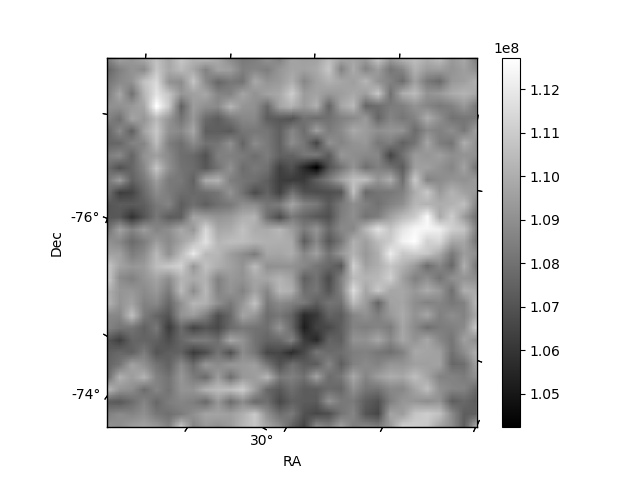
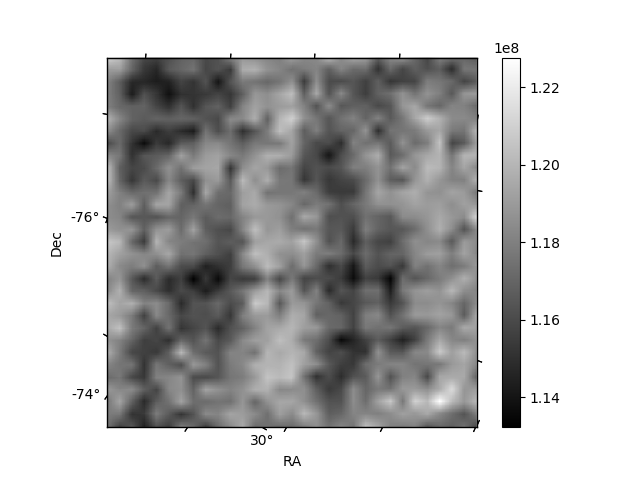
Histogram calculated using DETX and DETY for each event in the final _common_clean file
| Quadrant A | 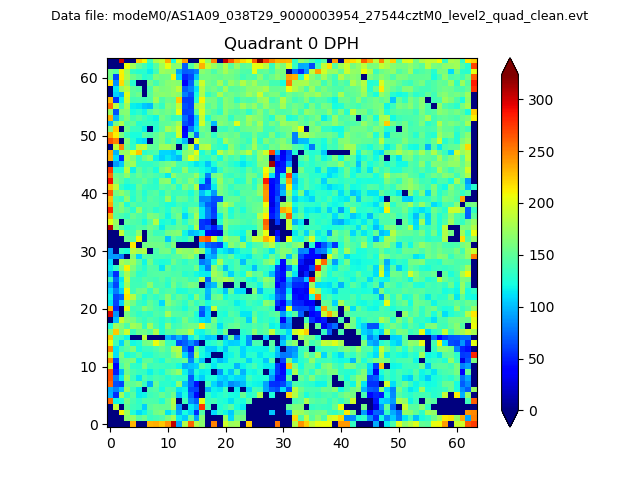 |
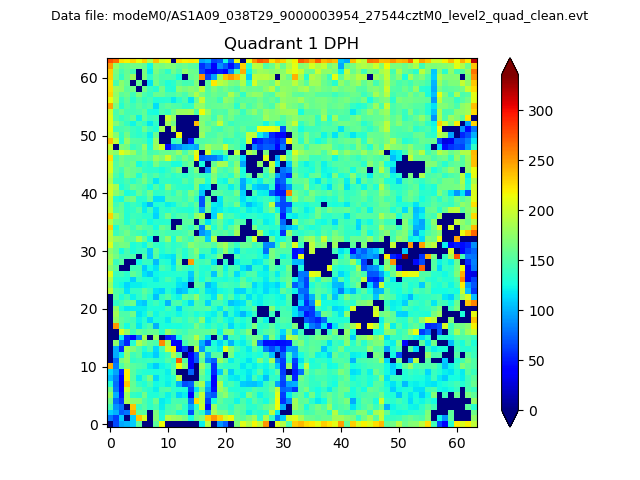 |
Quadrant B |
|---|---|---|---|
| Quadrant D | 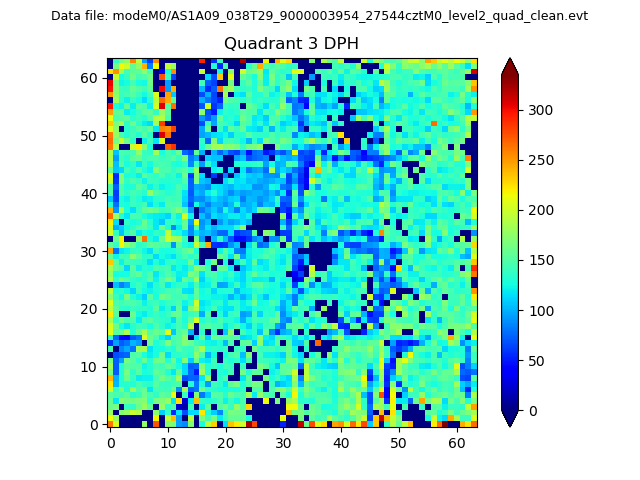 |
 |
Quadrant C |
| Plot type | Count rate plots | Images |
|---|---|---|
| Comparison with Poisson distribution Blue bars denote a histogram of data divided into 1 sec bins. Red curve is a Poisson curve with rate = median count rate of data. |
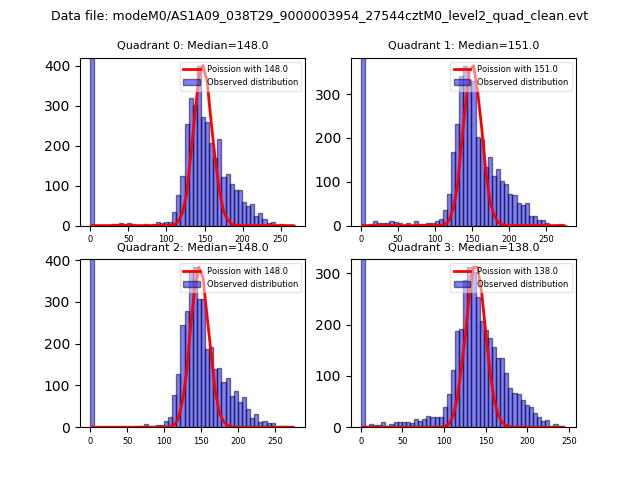 |
 |
| Quadrant-wise count rates Data is divided into 100 sec bins |
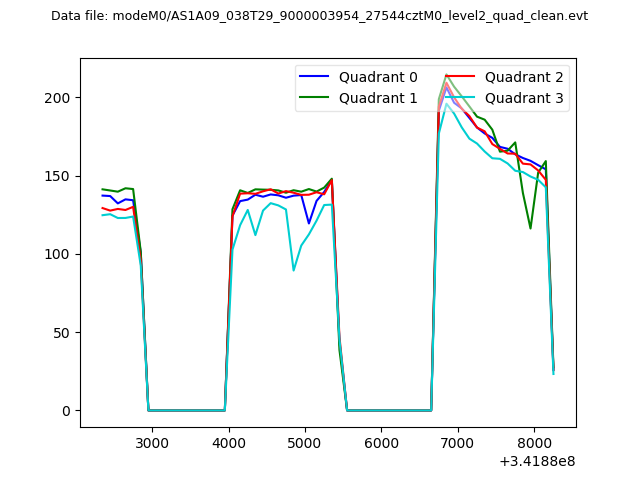 |
|
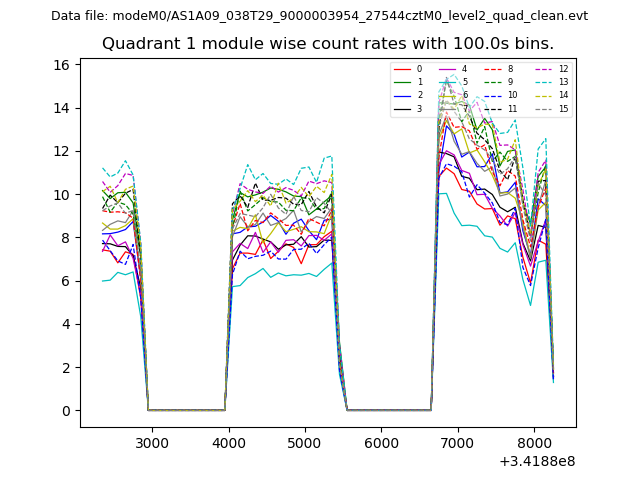
| Module-wise count rates for Quadrant A Data is divided into 100 sec bins |
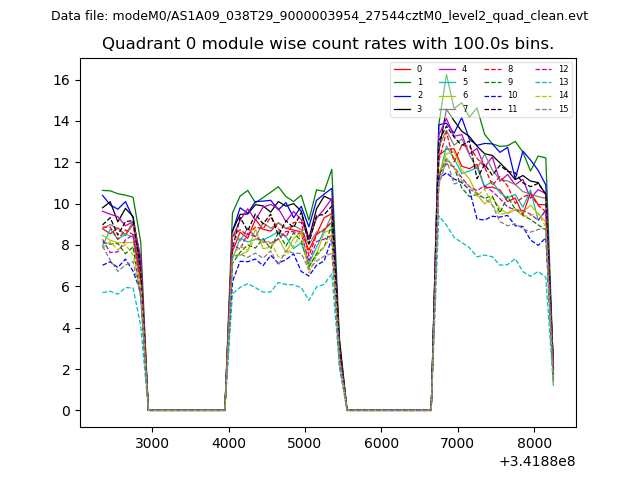 |
 |
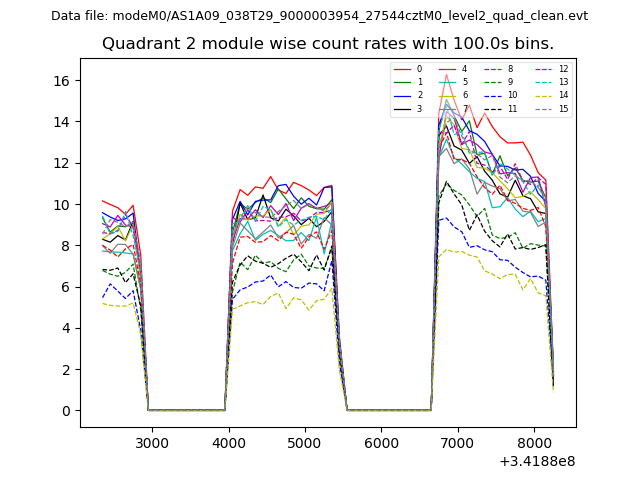
| Module-wise count rates for Quadrant B Data is divided into 100 sec bins |
 |
 |
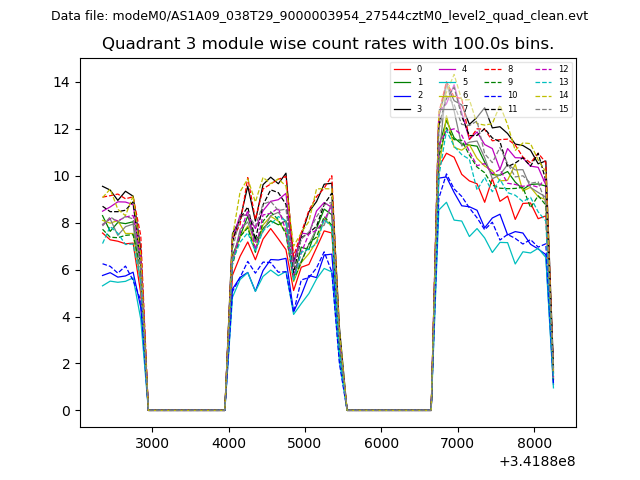
| Module-wise count rates for Quadrant C Data is divided into 100 sec bins |
 |
 |
| Module-wise count rates for Quadrant D Data is divided into 100 sec bins |
 |
 |
| Parameter | Plot |
|---|---|
| CZT HV Monitor | 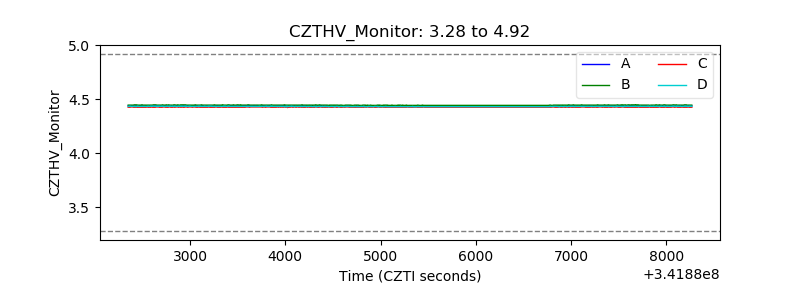 |
| D_VDD | 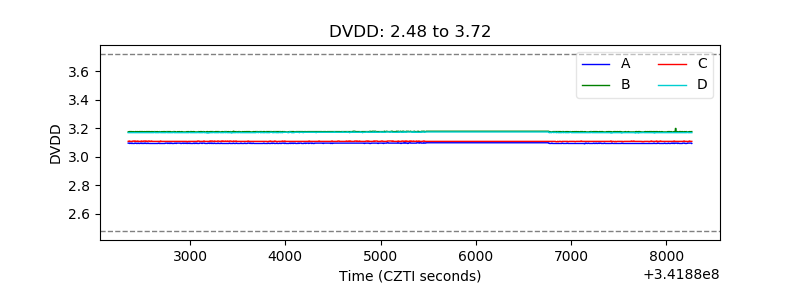 |
| Temperature 1 | 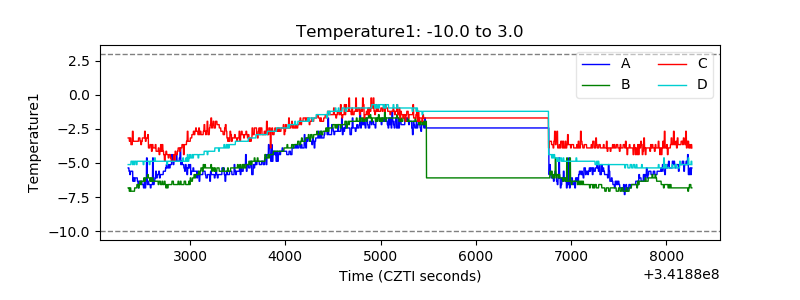 |
| Veto HV Monitor | 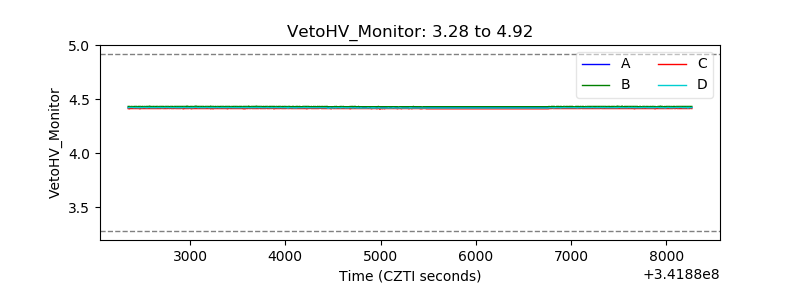 |
| Veto LLD | 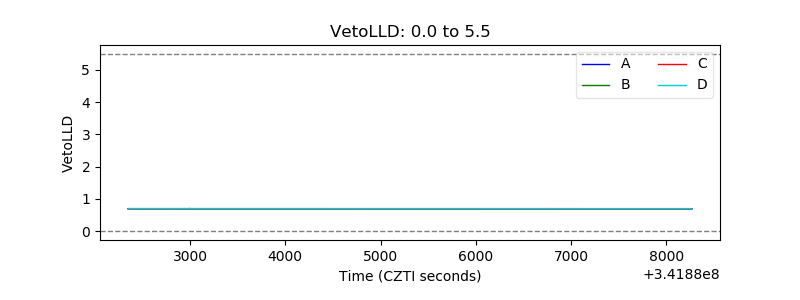 |
| Alpha Counter | 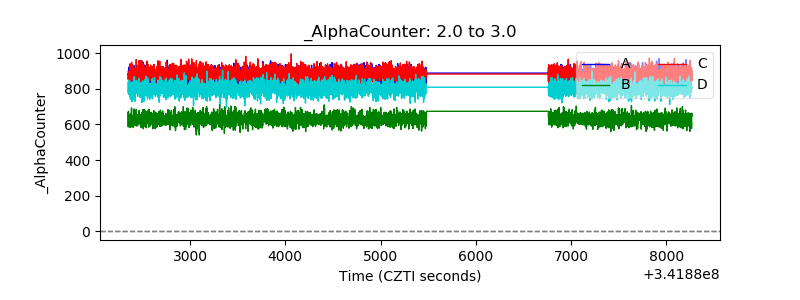 |
| _CPM_Rate | 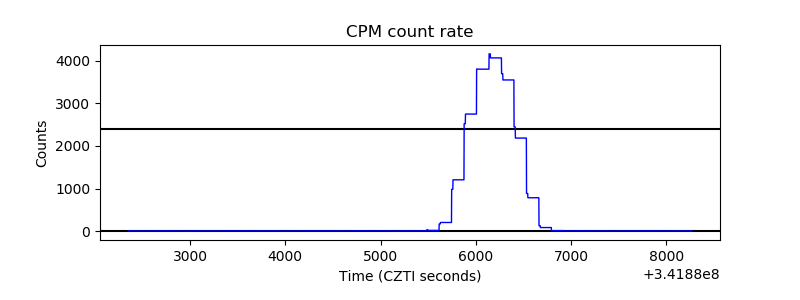 |
| CZT Counter | 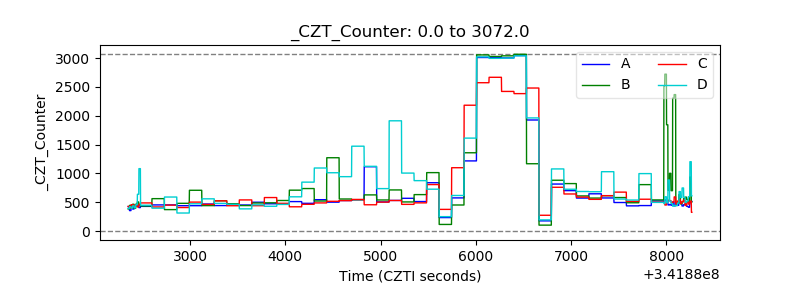 |
| +2.5 Volts monitor |  |
| +5 Volts monitor | 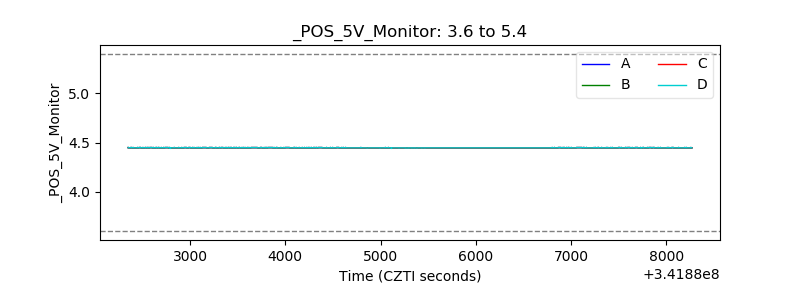 |
| _ROLL_ROT | 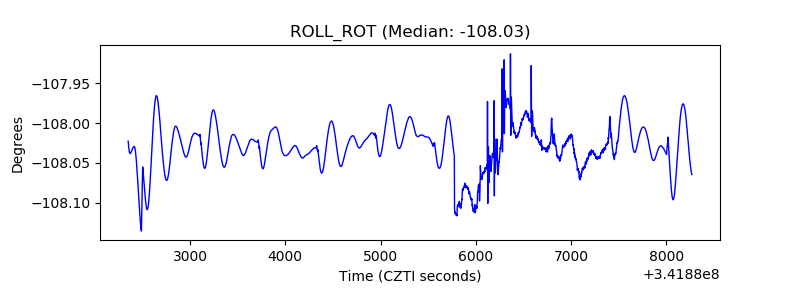 |
| _Roll_DEC | 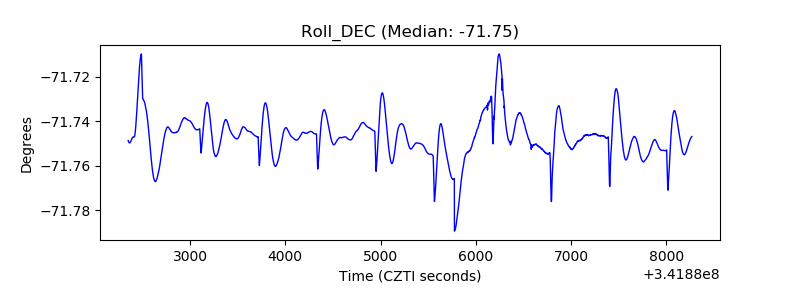 |
| _Roll_RA | 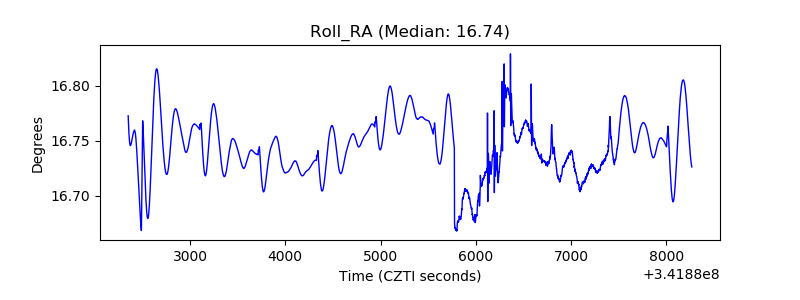 |
| Veto Counter | 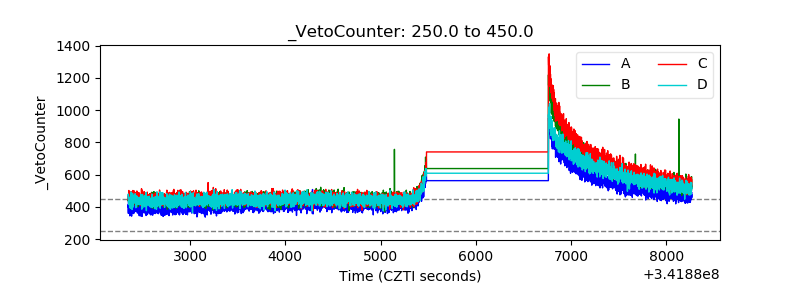 |