| Param | Original file | Final file |
|---|---|---|
| Filename | modeM0/AS1A09_038T29_9000003954_27545cztM0_level2.evt | modeM0/AS1A09_038T29_9000003954_27545cztM0_level2_quad_clean.evt |
| Size (bytes) | 525,666,240 | 126,616,320 |
| Size | 501.3 MB | 120.8 MB |
| Events in quadrant A | 3,334,545 | 861,267 |
| Events in quadrant B | 4,511,342 | 850,610 |
| Events in quadrant C | 3,500,893 | 860,636 |
| Events in quadrant D | 4,139,328 | 816,075 |
| Mode M0 | |||
|---|---|---|---|
| Quadrant | BADHDUFLAG | Total packets | Discarded packets |
| A | 0 | 13675 | 0 |
| B | 0 | 17428 | 0 |
| C | 0 | 14170 | 0 |
| D | 0 | 16436 | 0 |
| Mode M9 | |||
|---|---|---|---|
| Quadrant | BADHDUFLAG | Total packets | Discarded packets |
| A | 0 | 18 | 0 |
| B | 0 | 19 | 0 |
| C | 0 | 19 | 0 |
| D | 0 | 19 | 0 |
| Quadrant | Total seconds | Saturated seconds | Saturation percentage |
|---|---|---|---|
| A | 6399 | 19 | 0.296921% |
| B | 6398 | 462 | 7.221007% |
| C | 6398 | 66 | 1.031572% |
| D | 6398 | 106 | 1.656768% |
Noise dominated data is calculated using 1-second bins in cleaned event files. If a bin has >2000 counts, and if more than 50% of those come from <1% of pixels, then it is considered to be noise-dominated and hence unusable.
| Quadrant | # 1 sec bins | Bins with >0 counts | Bins with >2000 counts | High rate bins dominated by noise | Noise dominated (total time) | Noise dominated (detector-on time) | Marked lightcurve |
|---|---|---|---|---|---|---|---|
| A | 7754 | 6400 | 0 | 0 | 0.00% | 0.00% | 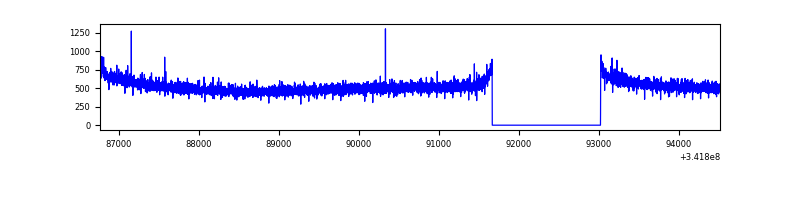 |
| B | 7752 | 6397 | 375 | 375 | 4.84% | 5.86% | 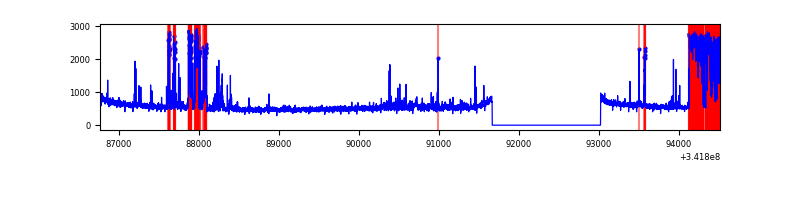 |
| C | 7753 | 6398 | 0 | 0 | 0.00% | 0.00% | 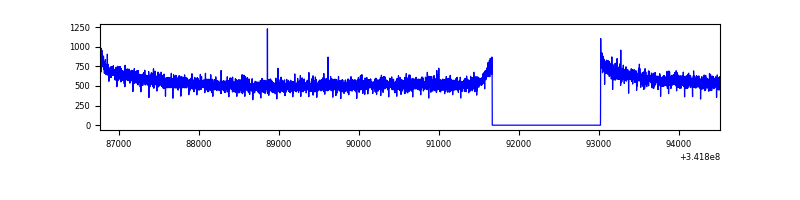 |
| D | 7753 | 6399 | 88 | 88 | 1.14% | 1.38% | 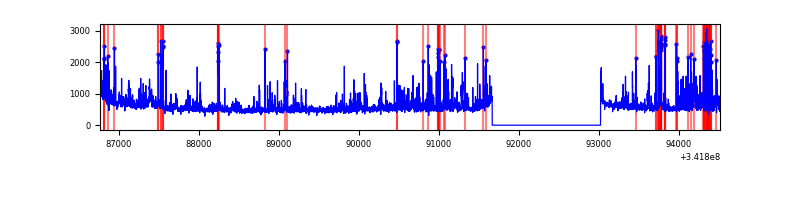 |
Top three noisy pixels from each quadrant. If the there are fewer than three noisy pixels in the level2.evt file, extra rows are filled as -1
| Pixel properties | Quadrant properties | ||||||
|---|---|---|---|---|---|---|---|
| Quadrant | DetID | PixID | Counts | Sigma | Mean | Median | Sigma |
| A | 13 | 254 | 10073 | 54.31 | 865 | 849 | 169.8 |
| A | 0 | 226 | 7266 | 37.79 | 865 | 849 | 169.8 |
| A | 3 | 137 | 7226 | 37.55 | 865 | 849 | 169.8 |
| B | 10 | 245 | 1131120 | 7336.73 | 845 | 827 | 154.1 |
| B | 4 | 52 | 27700 | 174.43 | 845 | 827 | 154.1 |
| B | 0 | 230 | 23062 | 144.33 | 845 | 827 | 154.1 |
| C | 14 | 238 | 143048 | 717.14 | 861 | 867 | 198.3 |
| C | 13 | 61 | 6059 | 26.19 | 861 | 867 | 198.3 |
| C | 2 | 16 | 3478 | 13.17 | 861 | 867 | 198.3 |
| D | 1 | 52 | 880330 | 4472.59 | 846 | 827 | 196.6 |
| D | 2 | 250 | 31029 | 153.59 | 846 | 827 | 196.6 |
| D | 2 | 234 | 22108 | 108.22 | 846 | 827 | 196.6 |
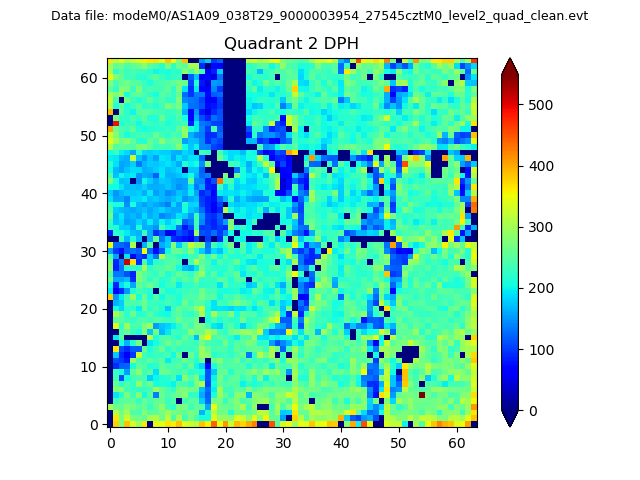
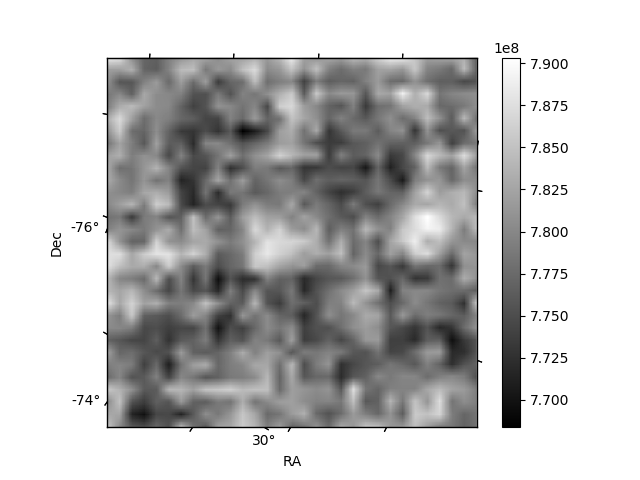
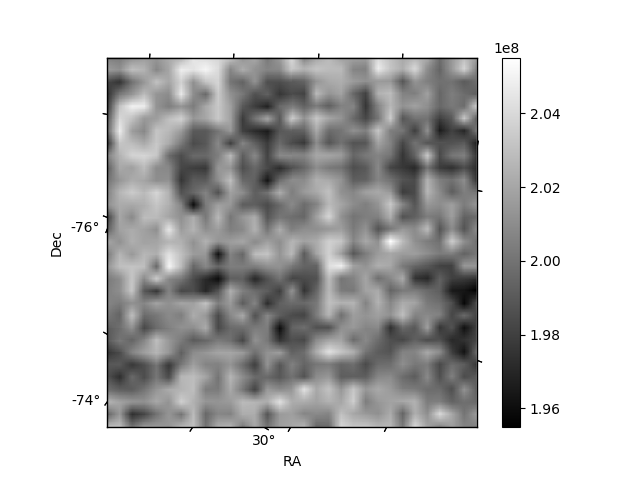
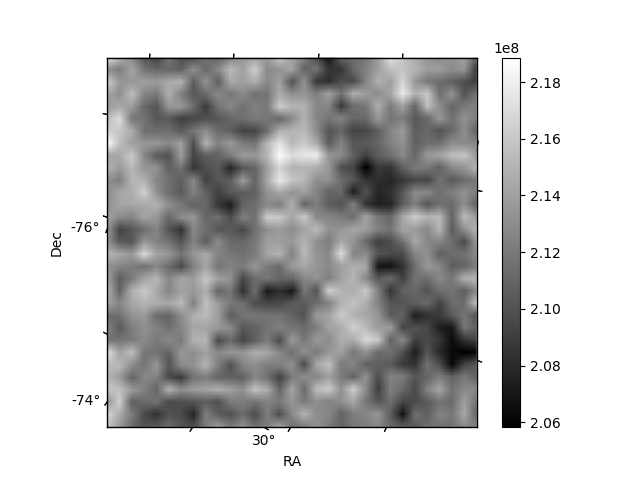
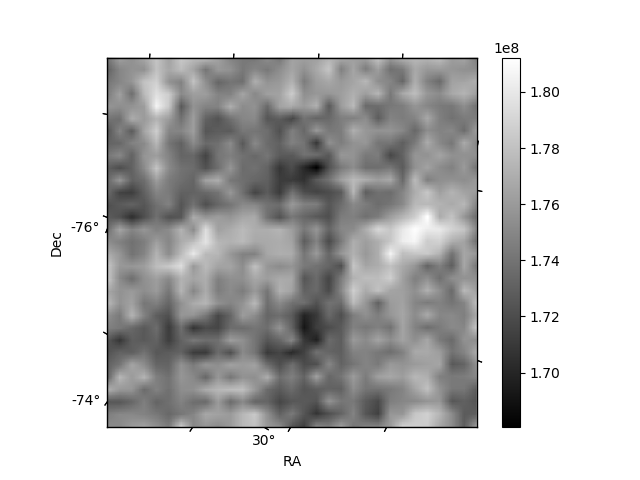
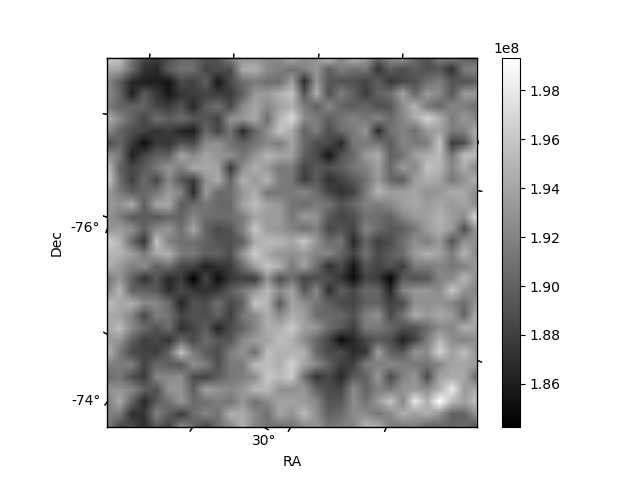
Histogram calculated using DETX and DETY for each event in the final _common_clean file
| Quadrant A | 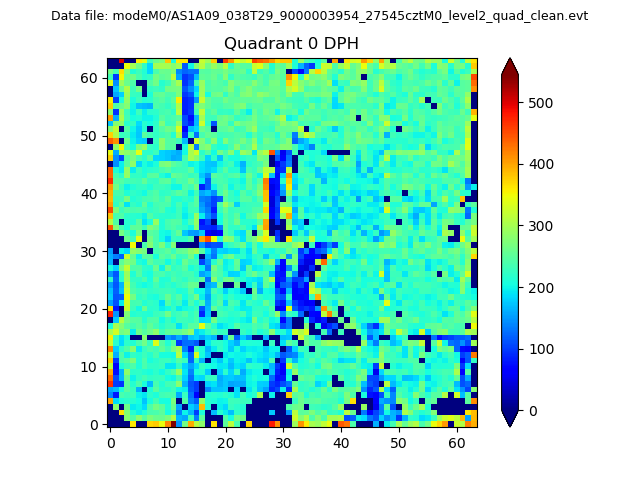 |
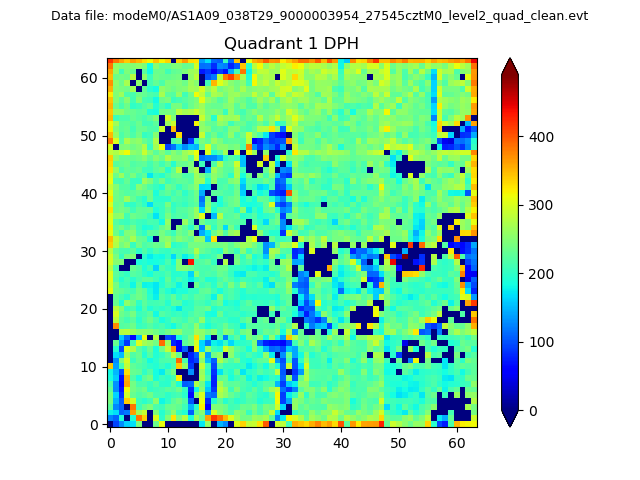 |
Quadrant B |
|---|---|---|---|
| Quadrant D | 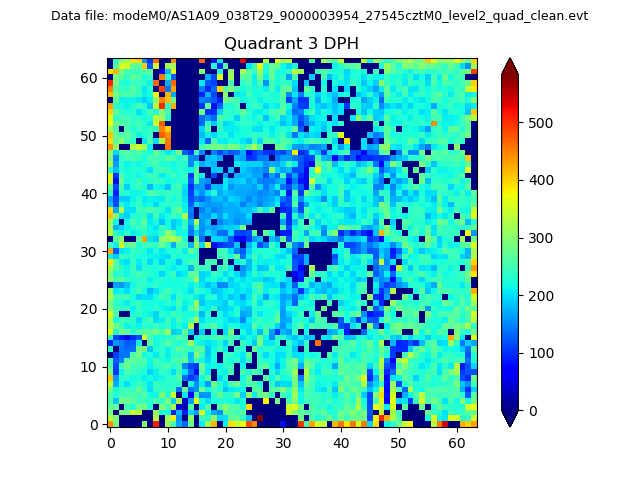 |
 |
Quadrant C |
| Plot type | Count rate plots | Images |
|---|---|---|
| Comparison with Poisson distribution Blue bars denote a histogram of data divided into 1 sec bins. Red curve is a Poisson curve with rate = median count rate of data. |
 |
 |
| Quadrant-wise count rates Data is divided into 100 sec bins |
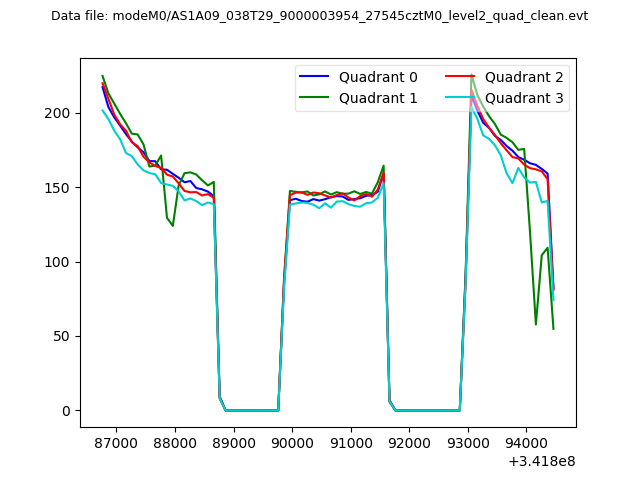 |
|
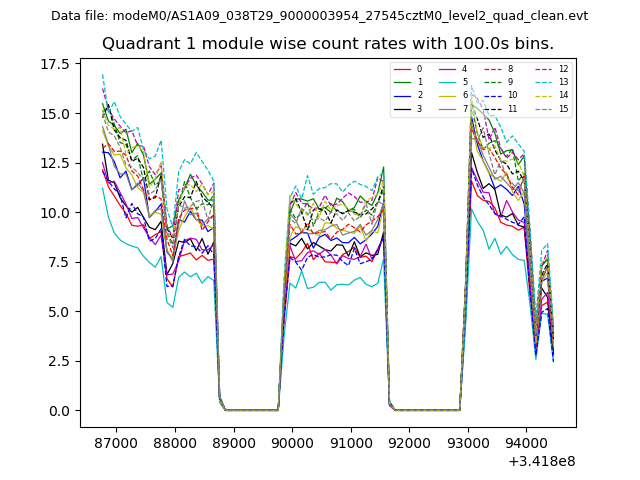
| Module-wise count rates for Quadrant A Data is divided into 100 sec bins |
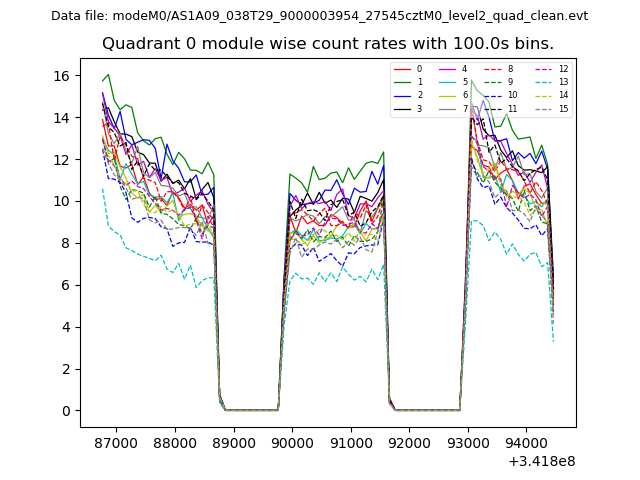 |
 |
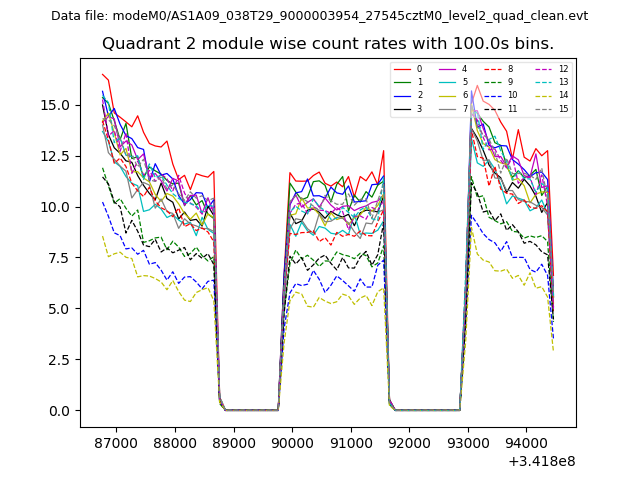
| Module-wise count rates for Quadrant B Data is divided into 100 sec bins |
 |
 |
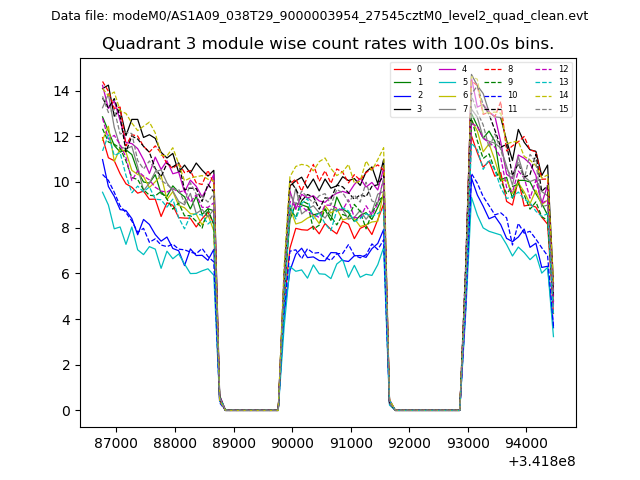
| Module-wise count rates for Quadrant C Data is divided into 100 sec bins |
 |
 |
| Module-wise count rates for Quadrant D Data is divided into 100 sec bins |
 |
 |
| Parameter | Plot |
|---|---|
| CZT HV Monitor | 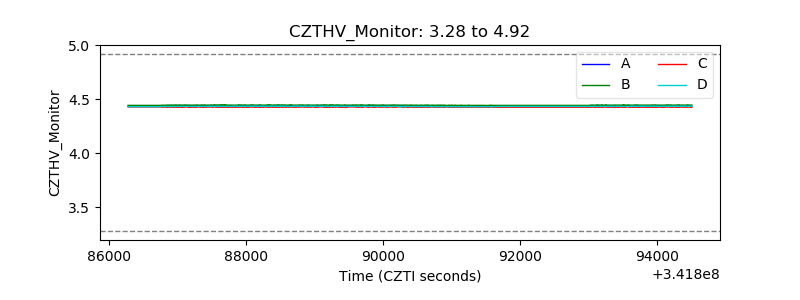 |
| D_VDD | 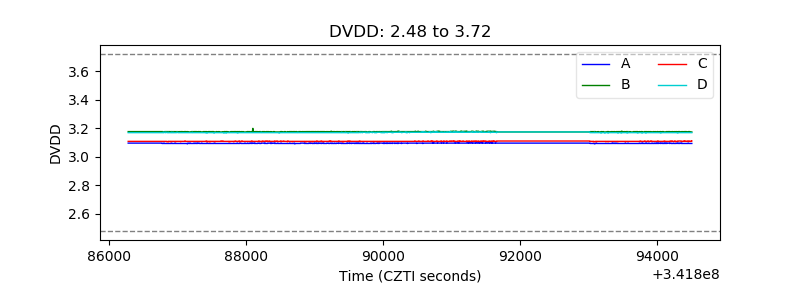 |
| Temperature 1 | 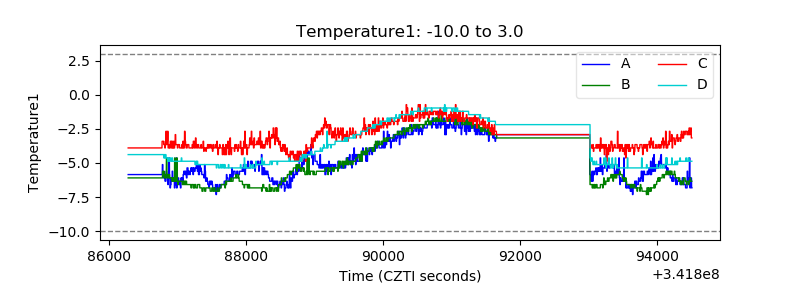 |
| Veto HV Monitor |  |
| Veto LLD | 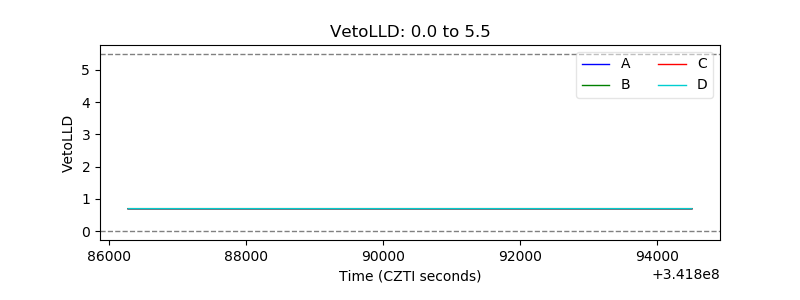 |
| Alpha Counter | 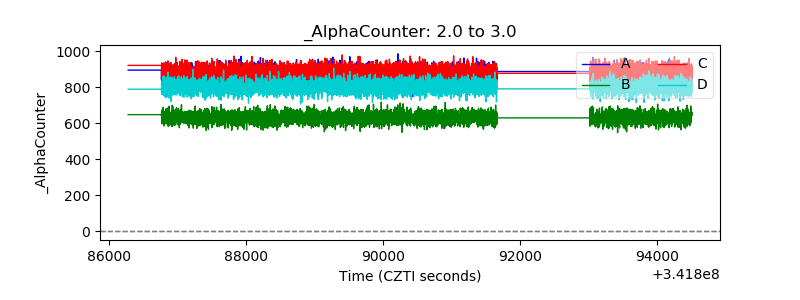 |
| _CPM_Rate |  |
| CZT Counter | 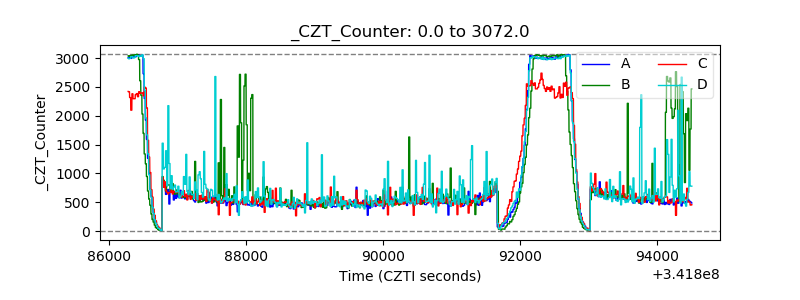 |
| +2.5 Volts monitor | 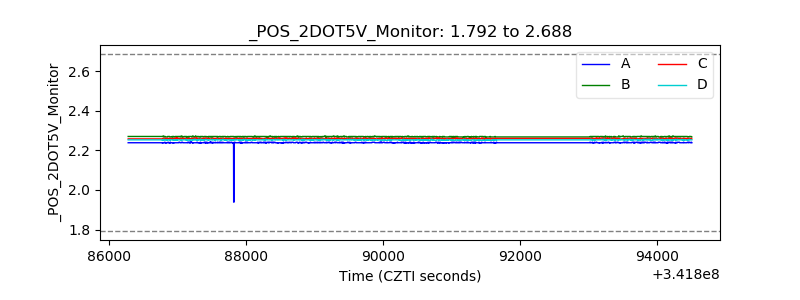 |
| +5 Volts monitor |  |
| _ROLL_ROT | 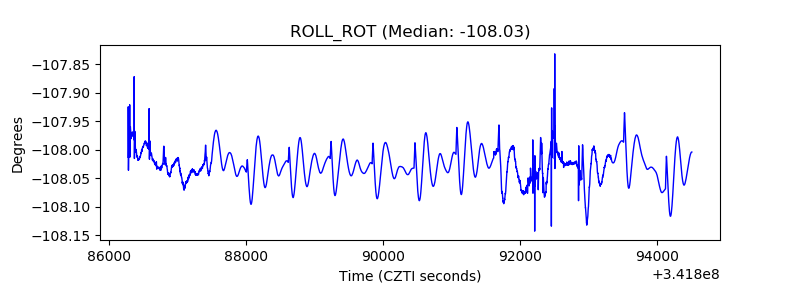 |
| _Roll_DEC | 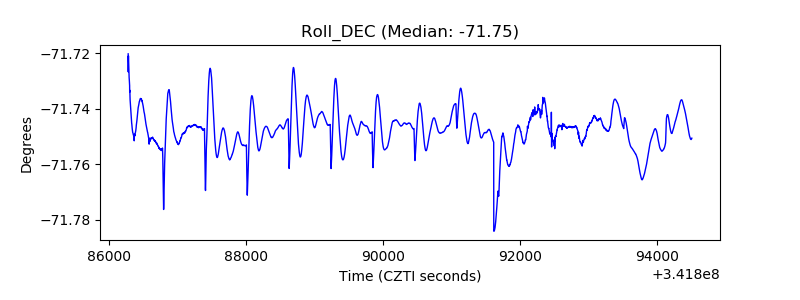 |
| _Roll_RA | 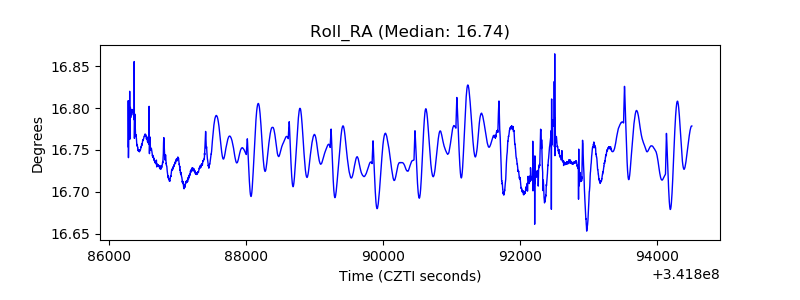 |
| Veto Counter | 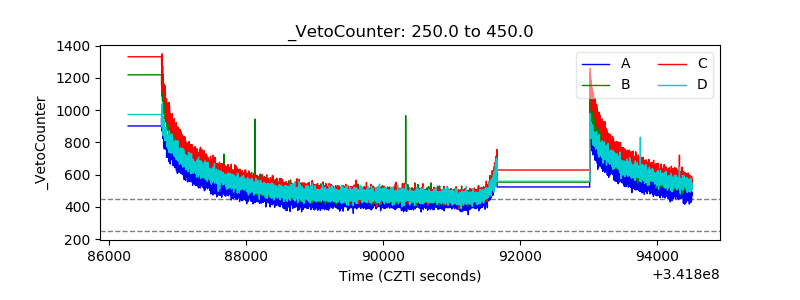 |