| Param | Original file | Final file |
|---|---|---|
| Filename | modeM0/AS1A09_038T29_9000003954_27546cztM0_level2.evt | modeM0/AS1A09_038T29_9000003954_27546cztM0_level2_quad_clean.evt |
| Size (bytes) | 574,041,600 | 115,842,240 |
| Size | 547.4 MB | 110.5 MB |
| Events in quadrant A | 3,245,123 | 789,402 |
| Events in quadrant B | 4,526,635 | 777,888 |
| Events in quadrant C | 3,601,853 | 787,789 |
| Events in quadrant D | 5,587,655 | 716,797 |
| Mode M0 | |||
|---|---|---|---|
| Quadrant | BADHDUFLAG | Total packets | Discarded packets |
| A | 0 | 13175 | 0 |
| B | 0 | 17233 | 0 |
| C | 0 | 14365 | 0 |
| D | 0 | 20692 | 0 |
| Mode M9 | |||
|---|---|---|---|
| Quadrant | BADHDUFLAG | Total packets | Discarded packets |
| A | 0 | 14 | 0 |
| B | 0 | 14 | 0 |
| C | 0 | 14 | 0 |
| D | 0 | 14 | 0 |
| Quadrant | Total seconds | Saturated seconds | Saturation percentage |
|---|---|---|---|
| A | 6246 | 7 | 0.112072% |
| B | 6247 | 508 | 8.131903% |
| C | 6247 | 123 | 1.968945% |
| D | 6246 | 670 | 10.726865% |
Noise dominated data is calculated using 1-second bins in cleaned event files. If a bin has >2000 counts, and if more than 50% of those come from <1% of pixels, then it is considered to be noise-dominated and hence unusable.
| Quadrant | # 1 sec bins | Bins with >0 counts | Bins with >2000 counts | High rate bins dominated by noise | Noise dominated (total time) | Noise dominated (detector-on time) | Marked lightcurve |
|---|---|---|---|---|---|---|---|
| A | 7637 | 6248 | 0 | 0 | 0.00% | 0.00% | 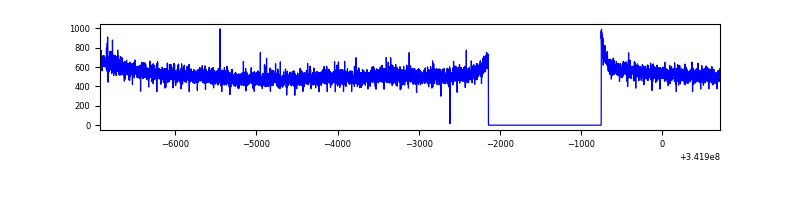 |
| B | 7638 | 6249 | 435 | 435 | 5.70% | 6.96% | 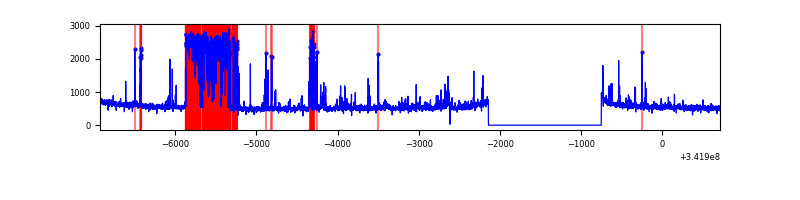 |
| C | 7638 | 6249 | 56 | 56 | 0.73% | 0.90% | 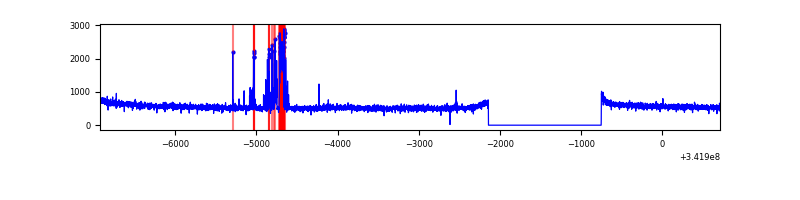 |
| D | 7637 | 6247 | 576 | 576 | 7.54% | 9.22% | 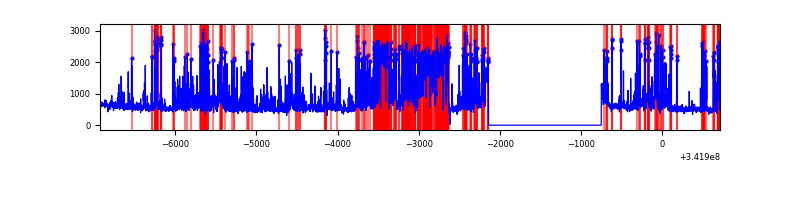 |
Top three noisy pixels from each quadrant. If the there are fewer than three noisy pixels in the level2.evt file, extra rows are filled as -1
| Pixel properties | Quadrant properties | ||||||
|---|---|---|---|---|---|---|---|
| Quadrant | DetID | PixID | Counts | Sigma | Mean | Median | Sigma |
| A | 13 | 254 | 10086 | 55.84 | 841 | 828 | 165.8 |
| A | 0 | 226 | 7200 | 38.44 | 841 | 828 | 165.8 |
| A | 3 | 137 | 7082 | 37.72 | 841 | 828 | 165.8 |
| B | 10 | 245 | 1243214 | 8320.83 | 814 | 795 | 149.3 |
| B | 4 | 52 | 46502 | 306.11 | 814 | 795 | 149.3 |
| B | 3 | 64 | 21850 | 141.01 | 814 | 795 | 149.3 |
| C | 2 | 16 | 217441 | 1133.67 | 831 | 839 | 191.1 |
| C | 14 | 238 | 137855 | 717.13 | 831 | 839 | 191.1 |
| C | 8 | 208 | 9277 | 44.16 | 831 | 839 | 191.1 |
| D | 1 | 52 | 2479672 | 13296.5 | 797 | 779 | 186.4 |
| D | 6 | 112 | 68946 | 365.64 | 797 | 779 | 186.4 |
| D | 2 | 234 | 21115 | 109.08 | 797 | 779 | 186.4 |
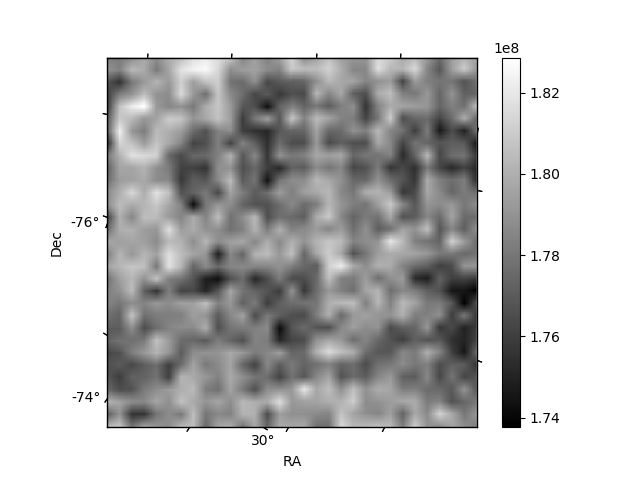
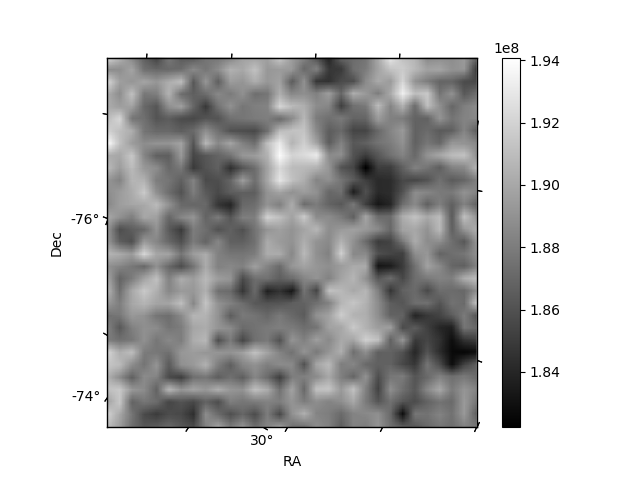
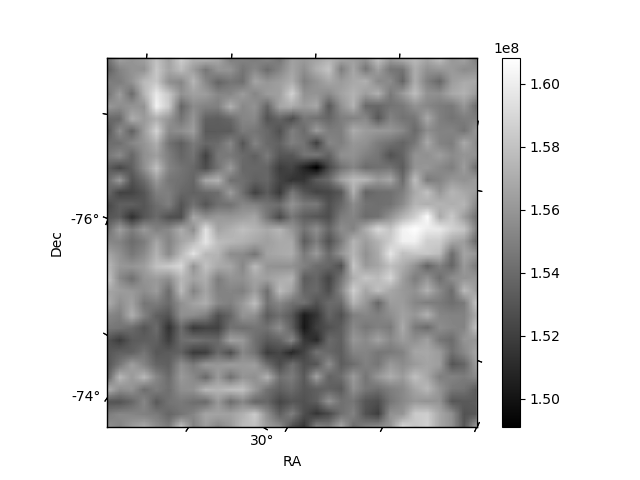
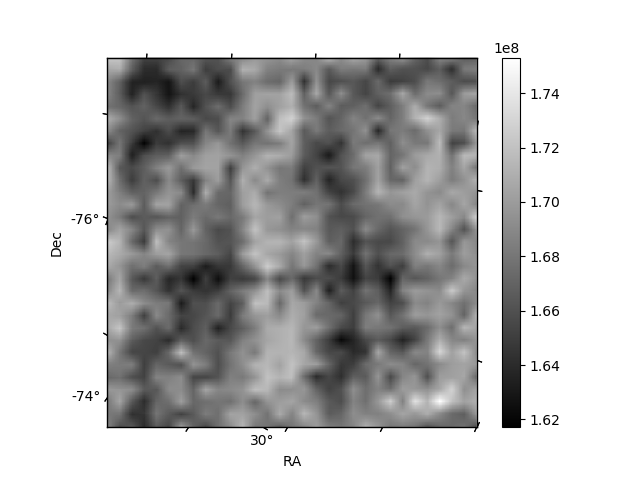
Histogram calculated using DETX and DETY for each event in the final _common_clean file
| Quadrant A |  |
 |
Quadrant B |
|---|---|---|---|
| Quadrant D |  |
 |
Quadrant C |
| Plot type | Count rate plots | Images |
|---|---|---|
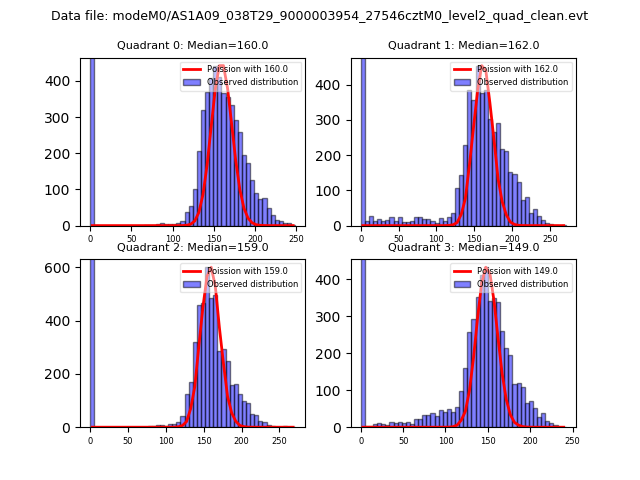
| Comparison with Poisson distribution Blue bars denote a histogram of data divided into 1 sec bins. Red curve is a Poisson curve with rate = median count rate of data. |
 |
 |
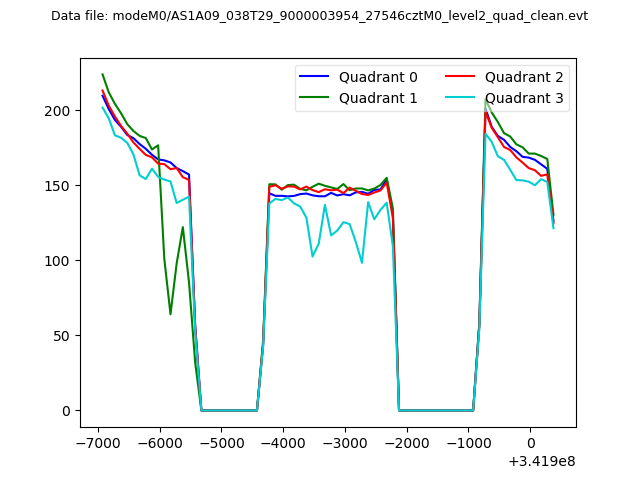
| Quadrant-wise count rates Data is divided into 100 sec bins |
 |
|
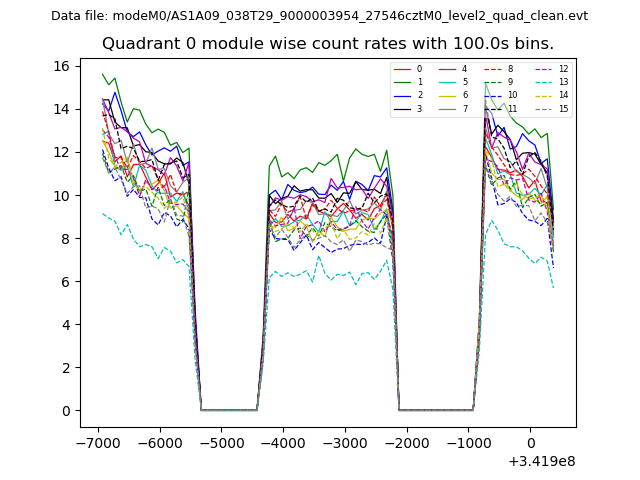
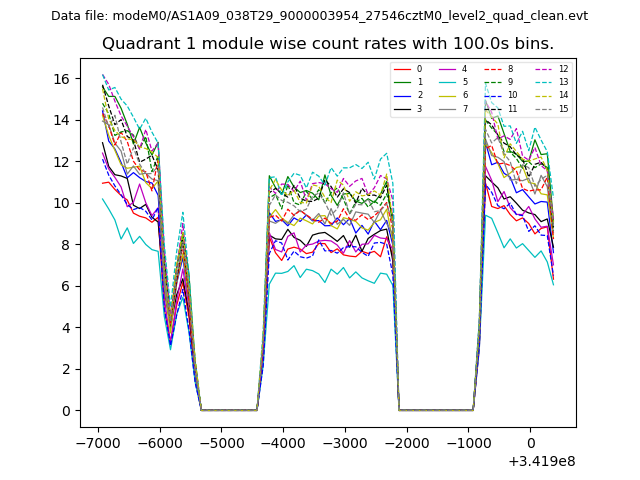
| Module-wise count rates for Quadrant A Data is divided into 100 sec bins |
 |
 |
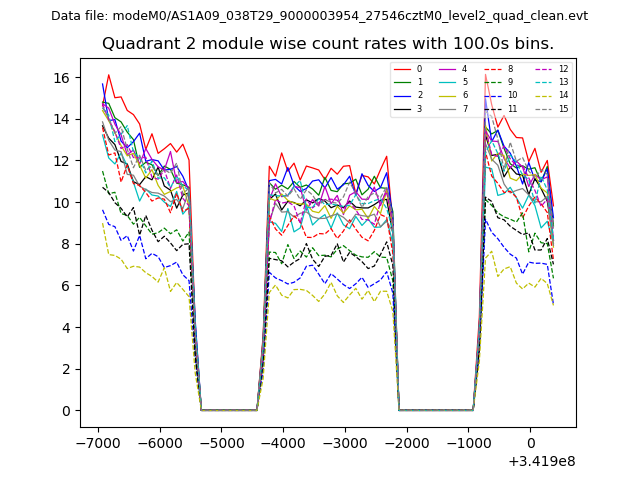
| Module-wise count rates for Quadrant B Data is divided into 100 sec bins |
 |
 |
| Module-wise count rates for Quadrant C Data is divided into 100 sec bins |
 |
 |
| Module-wise count rates for Quadrant D Data is divided into 100 sec bins |
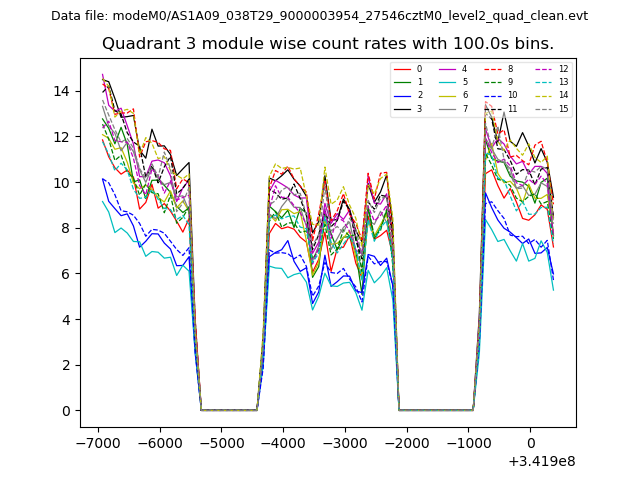 |
 |
| Parameter | Plot |
|---|---|
| CZT HV Monitor | 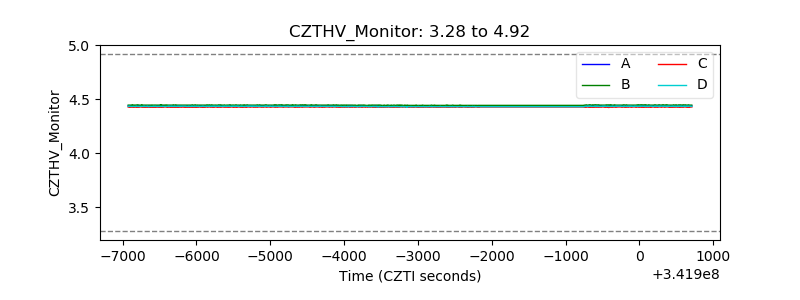 |
| D_VDD | 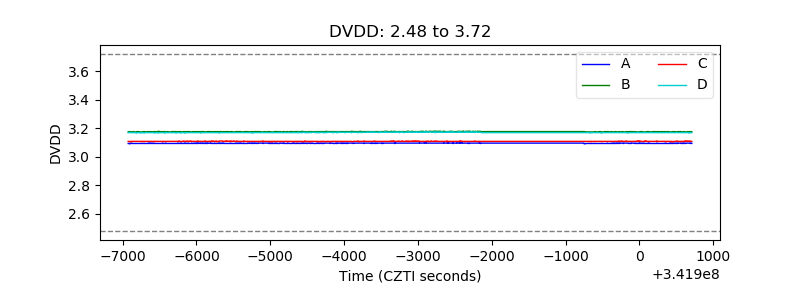 |
| Temperature 1 | 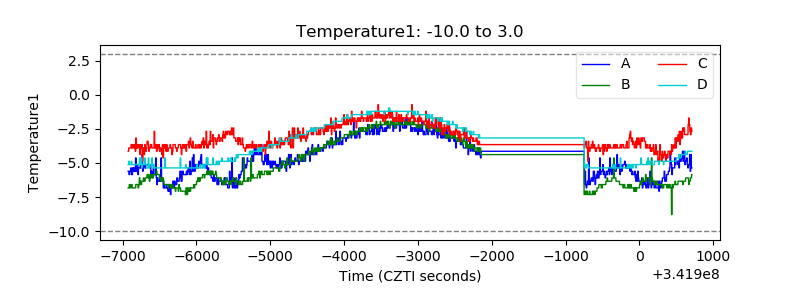 |
| Veto HV Monitor |  |
| Veto LLD | 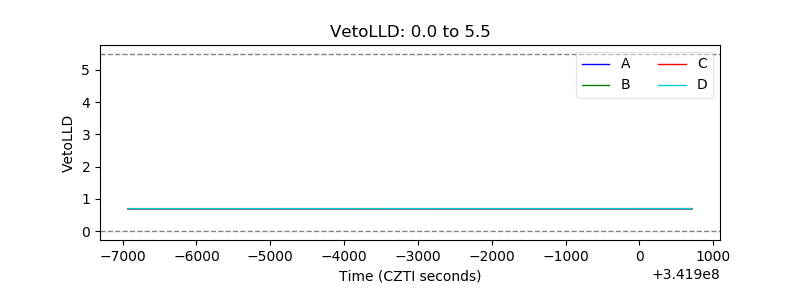 |
| Alpha Counter | 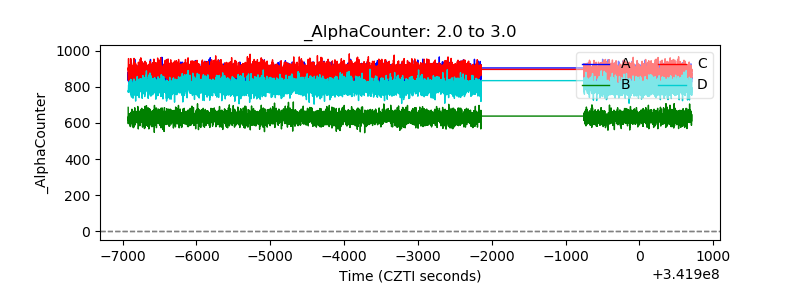 |
| _CPM_Rate | 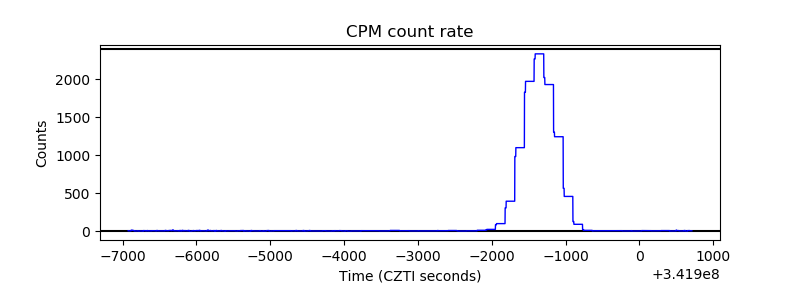 |
| CZT Counter |  |
| +2.5 Volts monitor |  |
| +5 Volts monitor | 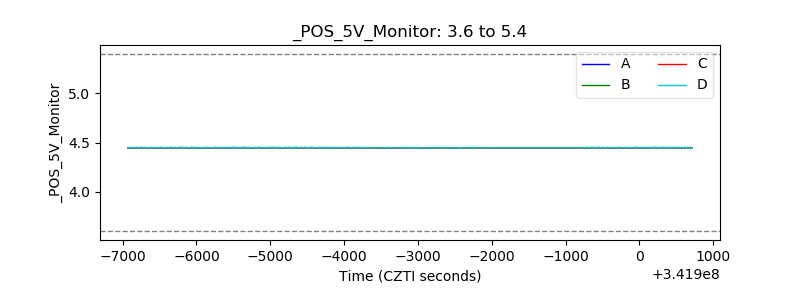 |
| _ROLL_ROT | 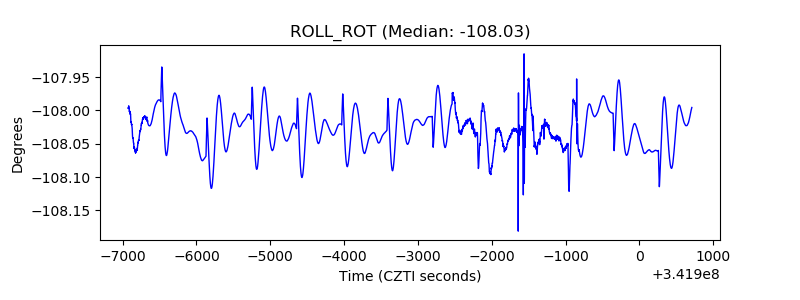 |
| _Roll_DEC |  |
| _Roll_RA | 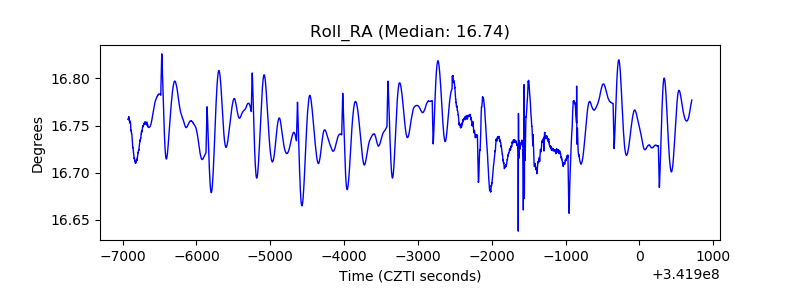 |
| Veto Counter | 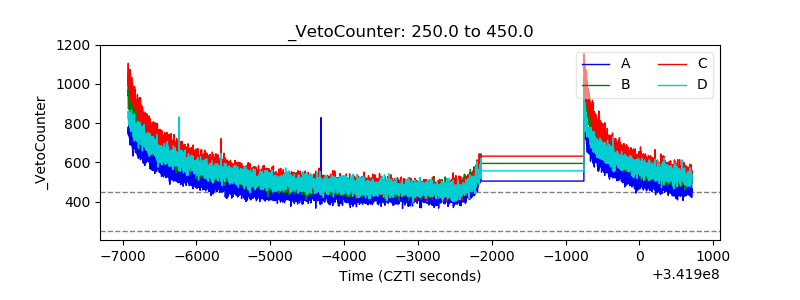 |