| Param | Original file | Final file |
|---|---|---|
| Filename | modeM0/AS1A09_038T29_9000003954_27547cztM0_level2.evt | modeM0/AS1A09_038T29_9000003954_27547cztM0_level2_quad_clean.evt |
| Size (bytes) | 318,559,680 | 65,669,760 |
| Size | 303.8 MB | 62.6 MB |
| Events in quadrant A | 1,978,020 | 429,361 |
| Events in quadrant B | 2,139,043 | 440,940 |
| Events in quadrant C | 2,042,412 | 429,850 |
| Events in quadrant D | 3,212,173 | 402,847 |
| Mode M0 | |||
|---|---|---|---|
| Quadrant | BADHDUFLAG | Total packets | Discarded packets |
| A | 0 | 8148 | 0 |
| B | 0 | 8604 | 0 |
| C | 0 | 8273 | 0 |
| D | 0 | 12161 | 0 |
| Quadrant | Total seconds | Saturated seconds | Saturation percentage |
|---|---|---|---|
| A | 4044 | 3 | 0.074184% |
| B | 4045 | 21 | 0.519159% |
| C | 4045 | 18 | 0.444994% |
| D | 4044 | 279 | 6.899110% |
Noise dominated data is calculated using 1-second bins in cleaned event files. If a bin has >2000 counts, and if more than 50% of those come from <1% of pixels, then it is considered to be noise-dominated and hence unusable.
| Quadrant | # 1 sec bins | Bins with >0 counts | Bins with >2000 counts | High rate bins dominated by noise | Noise dominated (total time) | Noise dominated (detector-on time) | Marked lightcurve |
|---|---|---|---|---|---|---|---|
| A | 4044 | 4044 | 0 | 0 | 0.00% | 0.00% | 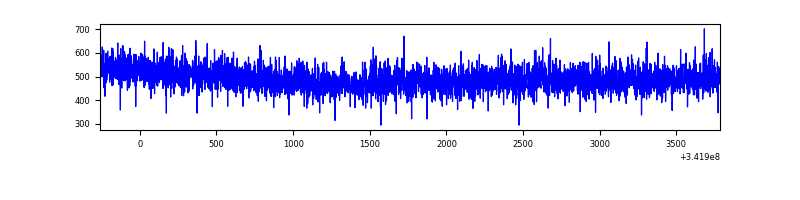 |
| B | 4045 | 4045 | 13 | 13 | 0.32% | 0.32% | 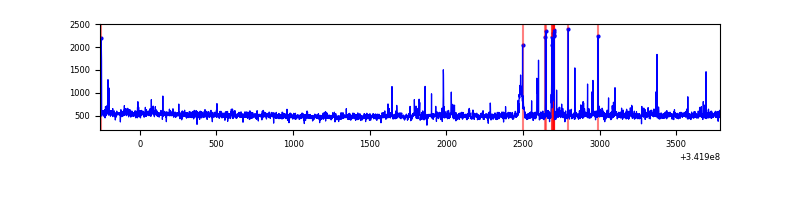 |
| C | 4045 | 4045 | 0 | 0 | 0.00% | 0.00% | 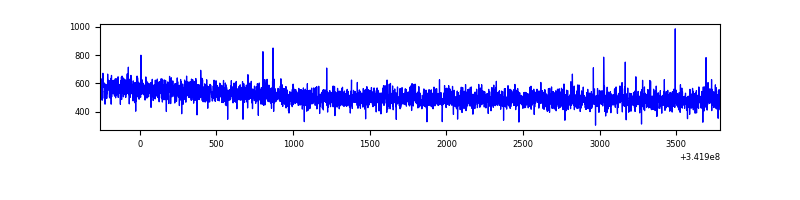 |
| D | 4045 | 4045 | 230 | 230 | 5.69% | 5.69% | 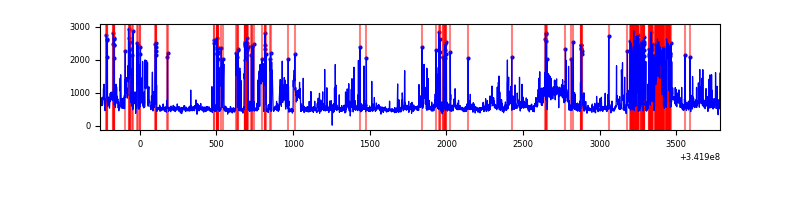 |
Top three noisy pixels from each quadrant. If the there are fewer than three noisy pixels in the level2.evt file, extra rows are filled as -1
| Pixel properties | Quadrant properties | ||||||
|---|---|---|---|---|---|---|---|
| Quadrant | DetID | PixID | Counts | Sigma | Mean | Median | Sigma |
| A | 13 | 254 | 6284 | 56.73 | 512 | 503 | 101.9 |
| A | 3 | 137 | 4412 | 38.36 | 512 | 503 | 101.9 |
| A | 0 | 226 | 4313 | 37.39 | 512 | 503 | 101.9 |
| B | 10 | 245 | 48600 | 506.9 | 511 | 500 | 94.9 |
| B | 4 | 52 | 43894 | 457.31 | 511 | 500 | 94.9 |
| B | 15 | 32 | 28905 | 299.35 | 511 | 500 | 94.9 |
| C | 14 | 238 | 82908 | 711.74 | 501 | 505 | 115.8 |
| C | 2 | 16 | 3769 | 28.19 | 501 | 505 | 115.8 |
| C | 13 | 61 | 3428 | 25.25 | 501 | 505 | 115.8 |
| D | 1 | 52 | 1280849 | 11165.97 | 486 | 476 | 114.7 |
| D | 2 | 250 | 35296 | 303.66 | 486 | 476 | 114.7 |
| D | 12 | 227 | 23955 | 204.76 | 486 | 476 | 114.7 |
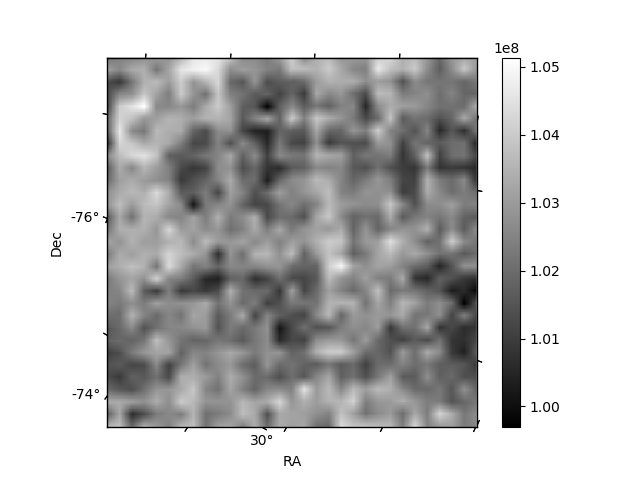
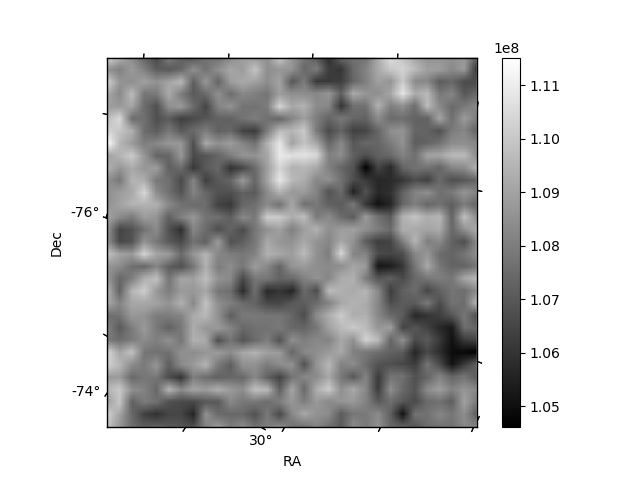
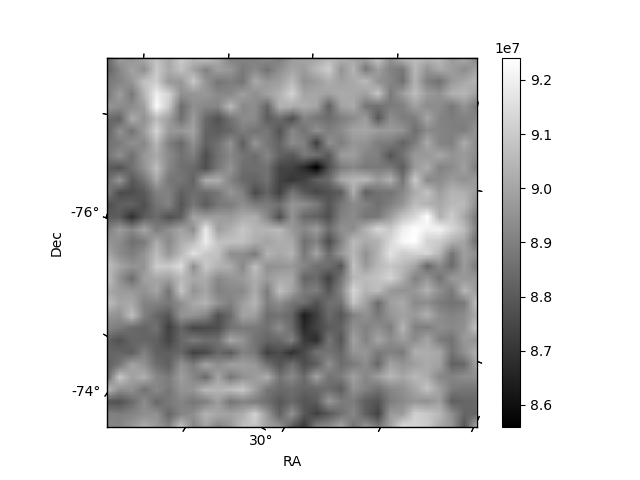
Histogram calculated using DETX and DETY for each event in the final _common_clean file
| Quadrant A | 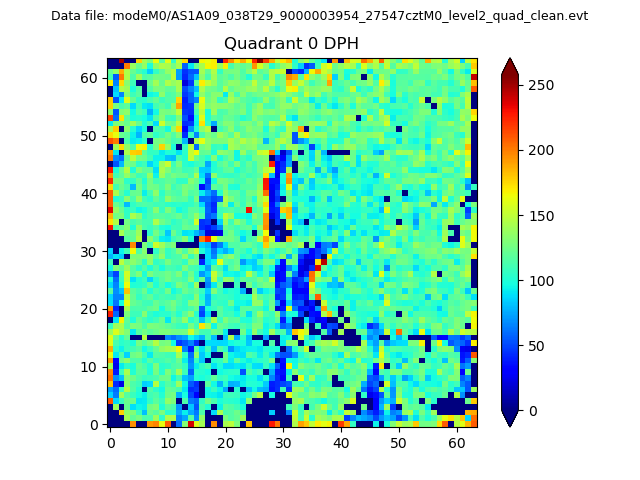 |
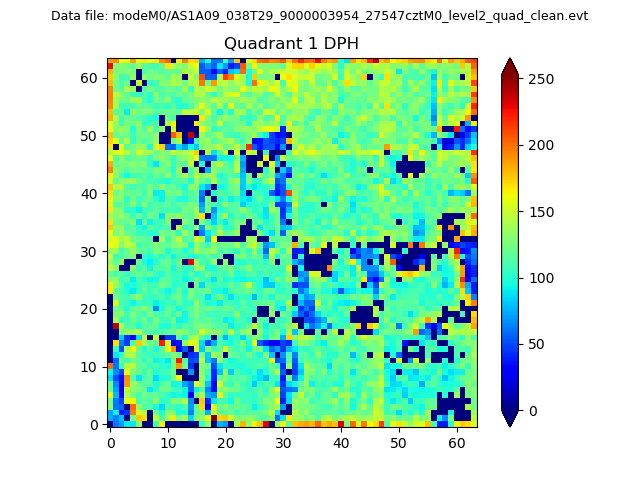 |
Quadrant B |
|---|---|---|---|
| Quadrant D | 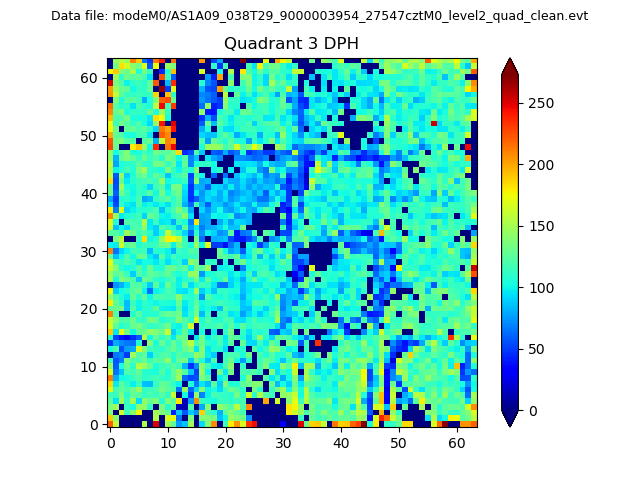 |
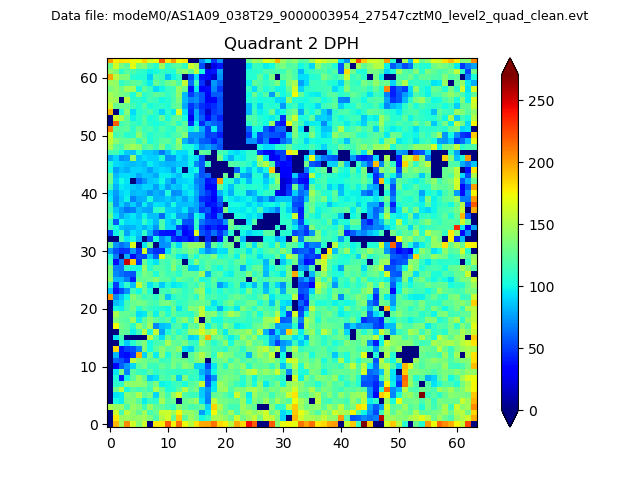 |
Quadrant C |
| Plot type | Count rate plots | Images |
|---|---|---|
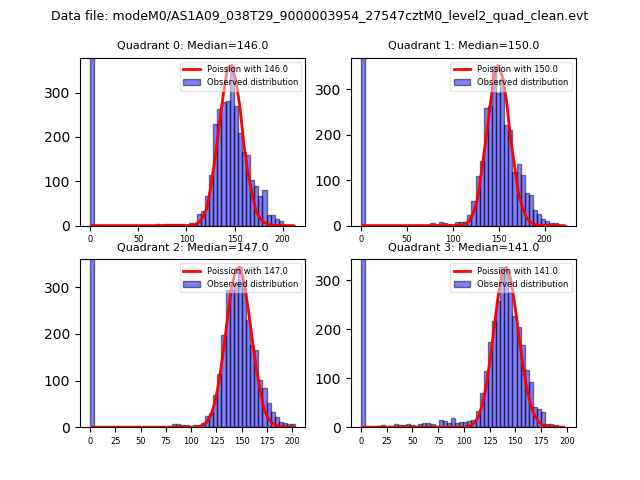
| Comparison with Poisson distribution Blue bars denote a histogram of data divided into 1 sec bins. Red curve is a Poisson curve with rate = median count rate of data. |
 |
 |
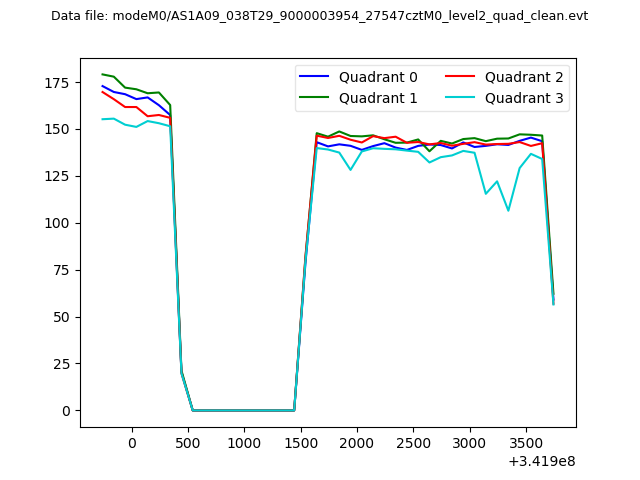
| Quadrant-wise count rates Data is divided into 100 sec bins |
 |
|
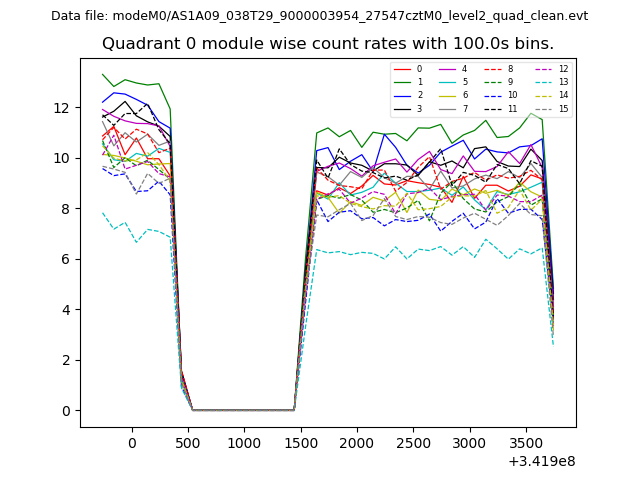
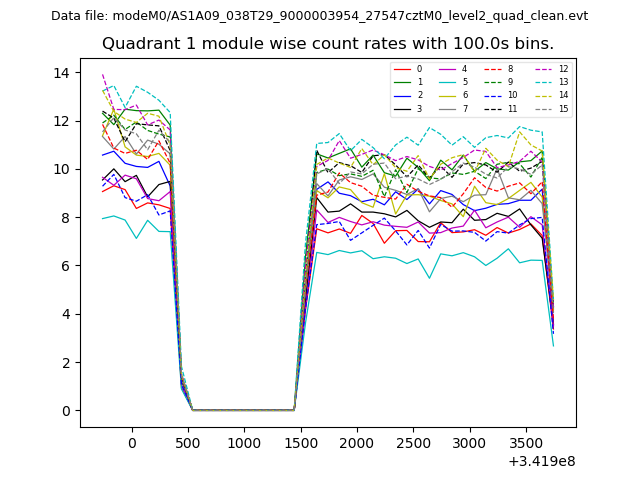
| Module-wise count rates for Quadrant A Data is divided into 100 sec bins |
 |
 |
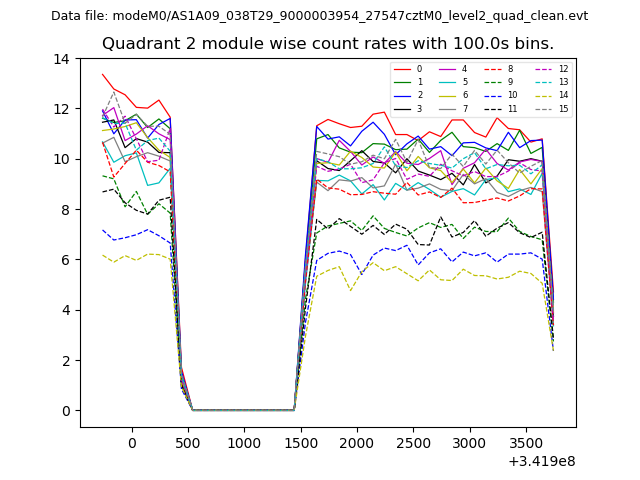
| Module-wise count rates for Quadrant B Data is divided into 100 sec bins |
 |
 |
| Module-wise count rates for Quadrant C Data is divided into 100 sec bins |
 |
 |
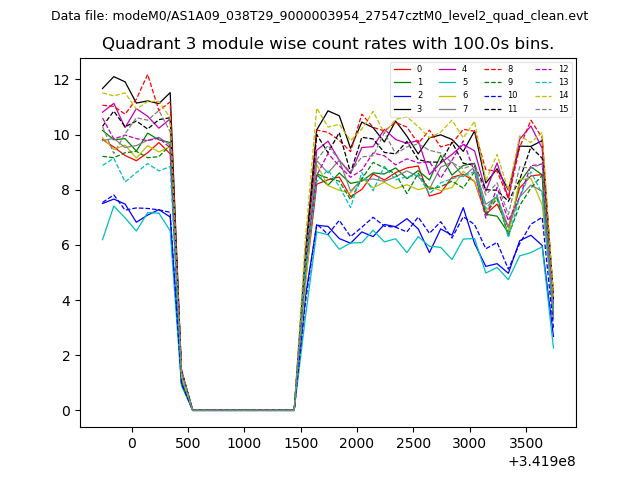
| Module-wise count rates for Quadrant D Data is divided into 100 sec bins |
 |
 |
| Parameter | Plot |
|---|---|
| CZT HV Monitor | 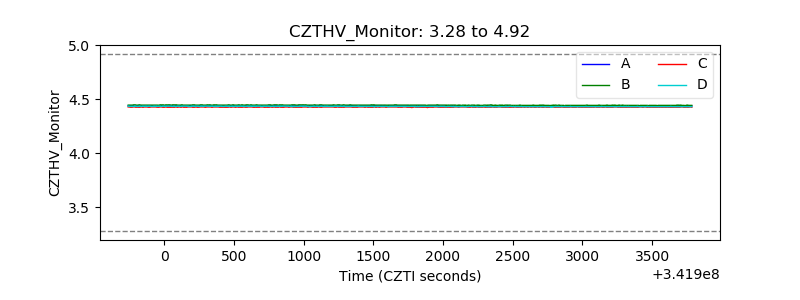 |
| D_VDD | 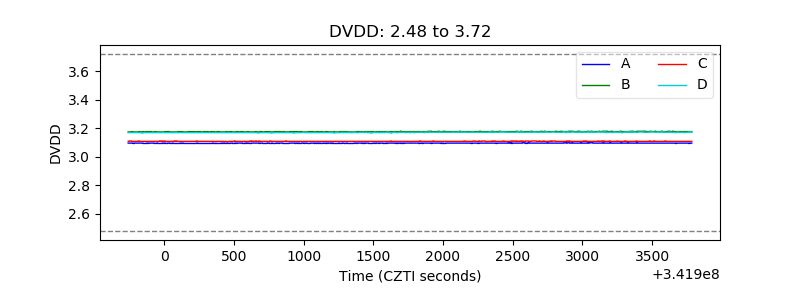 |
| Temperature 1 | 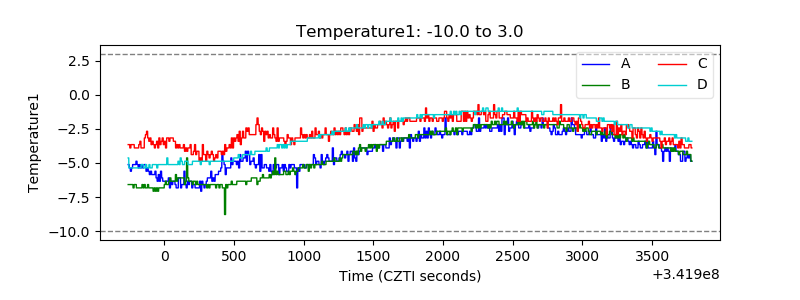 |
| Veto HV Monitor | 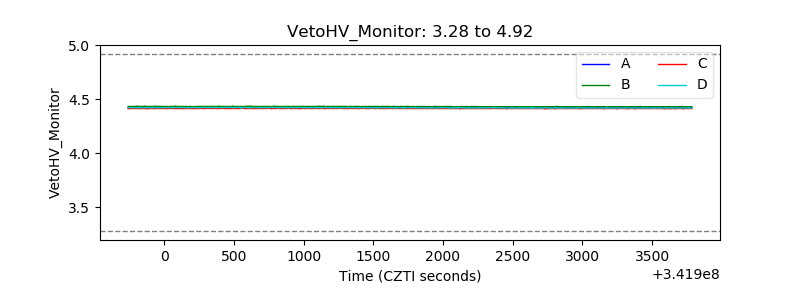 |
| Veto LLD | 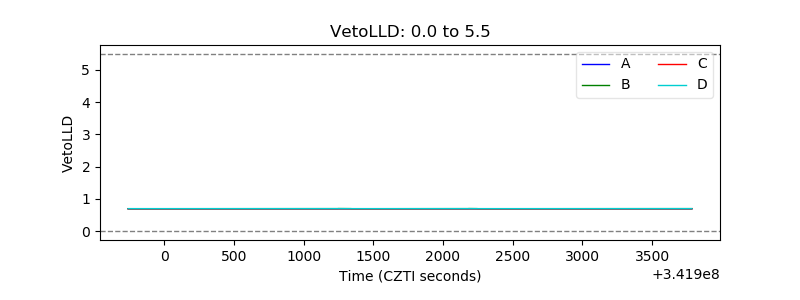 |
| Alpha Counter | 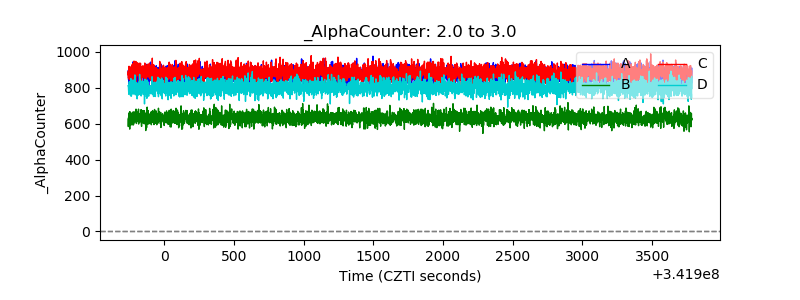 |
| _CPM_Rate | 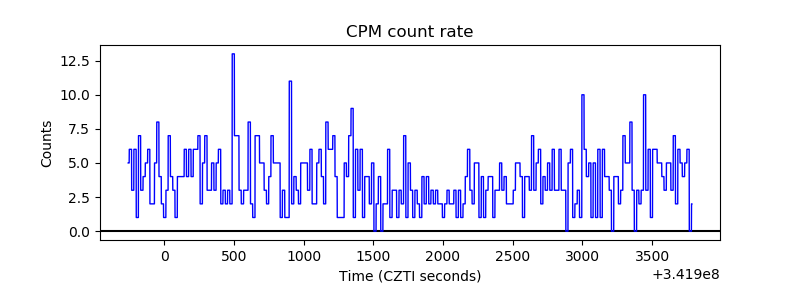 |
| CZT Counter | 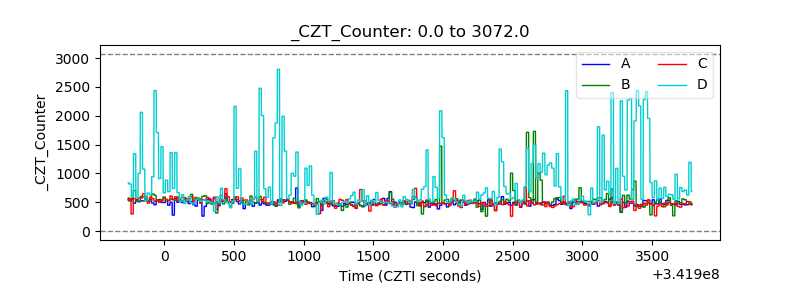 |
| +2.5 Volts monitor |  |
| +5 Volts monitor |  |
| _ROLL_ROT | 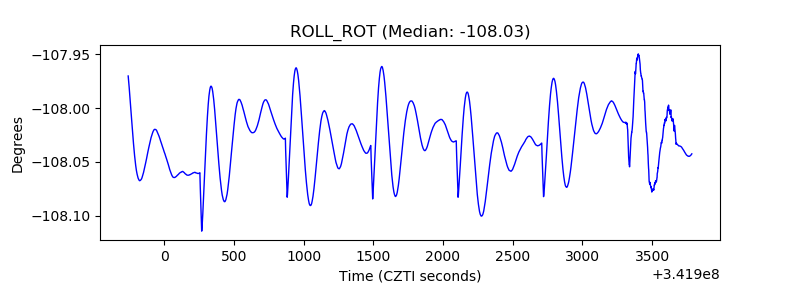 |
| _Roll_DEC | 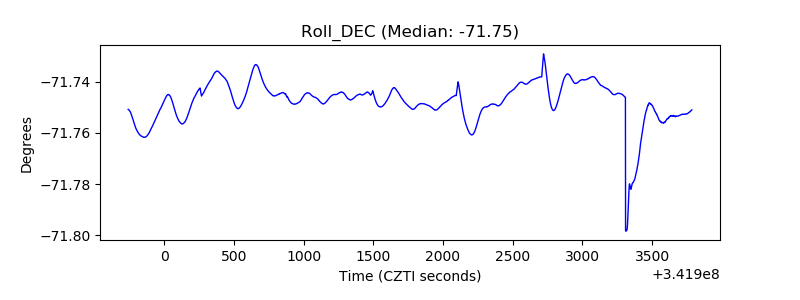 |
| _Roll_RA | 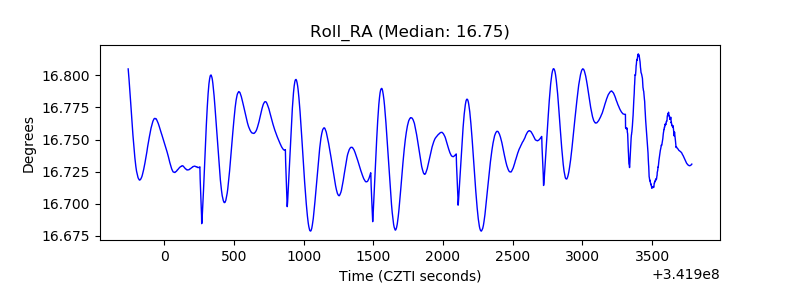 |
| Veto Counter | 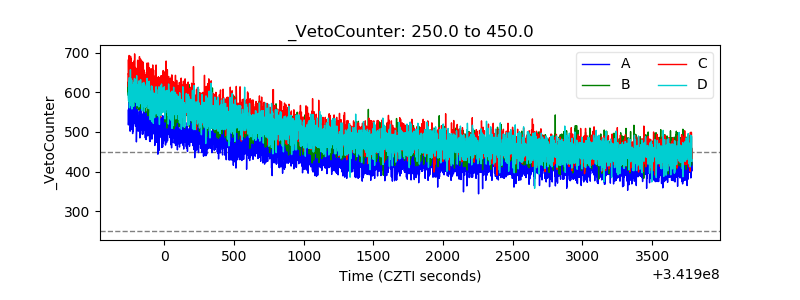 |