| Param | Original file | Final file |
|---|---|---|
| Filename | modeM0/AS1C05_019T04_9000003956cztM0_level2.fits | modeM0/AS1C05_019T04_9000003956cztM0_level2_quad_clean.evt |
| Size (bytes) | 962,740,800 | 1,103,440,320 |
| Size | 918.1 MB | 1.0 GB |
| Events in quadrant A | 5,966,616 | 7,020,012 |
| Events in quadrant B | 5,689,820 | 7,030,809 |
| Events in quadrant C | 5,746,100 | 6,648,885 |
| Events in quadrant D | 4,949,710 | 5,919,360 |
| Mode M9 | |||
|---|---|---|---|
| Quadrant | BADHDUFLAG | Total packets | Discarded packets |
| A | 0 | 126 | 0 |
| B | 0 | 126 | 0 |
| C | 0 | 126 | 0 |
| D | 0 | 126 | 0 |
| Mode SS | |||
|---|---|---|---|
| Quadrant | BADHDUFLAG | Total packets | Discarded packets |
| A | 0 | 2020 | 0 |
| B | 0 | 2020 | 0 |
| C | 0 | 2020 | 0 |
| D | 0 | 2020 | 0 |
| Mode M0 | |||
|---|---|---|---|
| Quadrant | BADHDUFLAG | Total packets | Discarded packets |
| A | 0 | 208315 | 0 |
| B | 0 | 221080 | 0 |
| C | 0 | 214132 | 0 |
| D | 0 | 281745 | 0 |
| Quadrant | Total seconds | Saturated seconds | Saturation percentage |
|---|---|---|---|
| A | 99212 | 1377 | 1.387937% |
| B | 99212 | 2578 | 2.598476% |
| C | 99212 | 2320 | 2.338427% |
| D | 99212 | 6139 | 6.187760% |
Noise dominated data is calculated using 1-second bins in cleaned event files. If a bin has >2000 counts, and if more than 50% of those come from <1% of pixels, then it is considered to be noise-dominated and hence unusable.
| Quadrant | # 1 sec bins | Bins with >0 counts | Bins with >2000 counts | High rate bins dominated by noise | Noise dominated (total time) | Noise dominated (detector-on time) | Marked lightcurve |
|---|---|---|---|---|---|---|---|
| A | 111895 | 99195 | 0 | 0 | 0.00% | 0.00% |  |
| B | 111895 | 99146 | 0 | 0 | 0.00% | 0.00% |  |
| C | 111895 | 99192 | 0 | 0 | 0.00% | 0.00% | 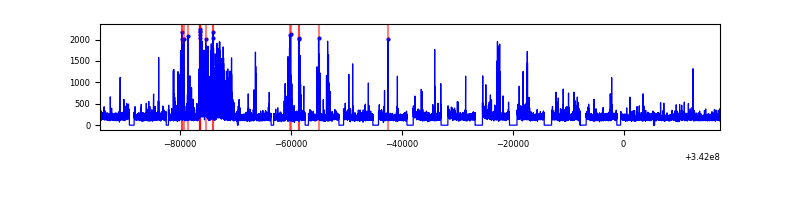 |
| D | 111895 | 99100 | 0 | 0 | 0.00% | 0.00% |  |
Top three noisy pixels from each quadrant. If the there are fewer than three noisy pixels in the level2.evt file, extra rows are filled as -1
| Pixel properties | Quadrant properties | ||||||
|---|---|---|---|---|---|---|---|
| Quadrant | DetID | PixID | Counts | Sigma | Mean | Median | Sigma |
| A | 0 | 29 | 5826 | 11.67 | 1551 | 1464 | 373.8 |
| A | 7 | 110 | 4765 | 8.83 | 1551 | 1464 | 373.8 |
| A | 0 | 30 | 4614 | 8.43 | 1551 | 1464 | 373.8 |
| B | 2 | 9 | 4632 | 11.04 | 1504 | 1442 | 289.1 |
| B | 2 | 8 | 3893 | 8.48 | 1504 | 1442 | 289.1 |
| B | 5 | 255 | 3699 | 7.81 | 1504 | 1442 | 289.1 |
| C | 12 | 241 | 4101 | 7.06 | 1521 | 1427 | 378.8 |
| C | 3 | 126 | 3931 | 6.61 | 1521 | 1427 | 378.8 |
| C | 9 | 209 | 3901 | 6.53 | 1521 | 1427 | 378.8 |
| D | 10 | 189 | 3569 | 6.11 | 1411 | 1285 | 373.7 |
| D | 6 | 231 | 3532 | 6.01 | 1411 | 1285 | 373.7 |
| D | 15 | 46 | 3487 | 5.89 | 1411 | 1285 | 373.7 |
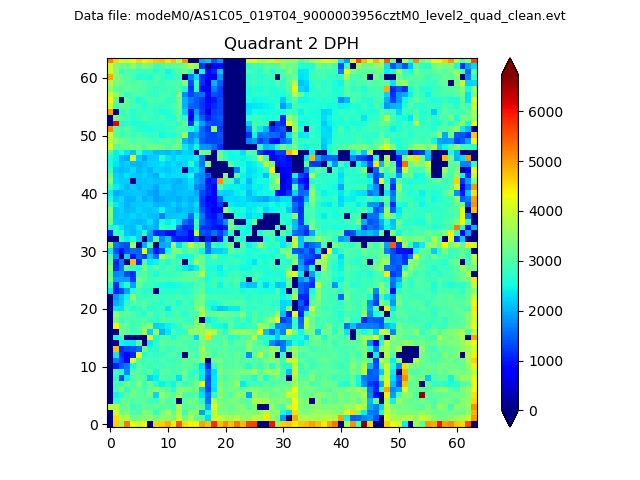
Histogram calculated using DETX and DETY for each event in the final _common_clean file
| Quadrant A |  |
 |
Quadrant B |
|---|---|---|---|
| Quadrant D | 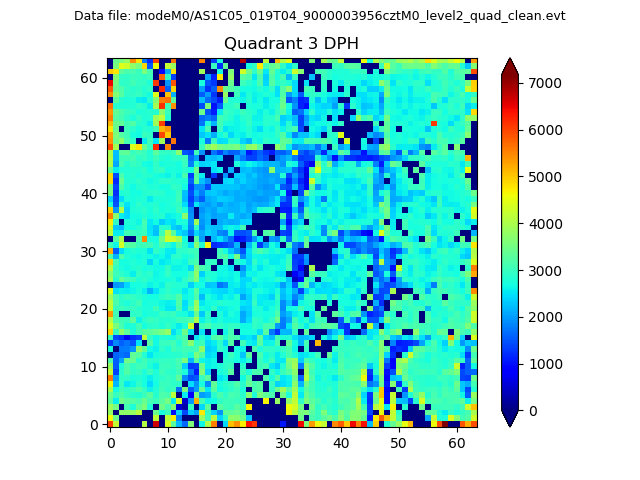 |
 |
Quadrant C |
| Plot type | Count rate plots | Images |
|---|---|---|
| Comparison with Poisson distribution Blue bars denote a histogram of data divided into 1 sec bins. Red curve is a Poisson curve with rate = median count rate of data. |
 |
 |
| Quadrant-wise count rates Data is divided into 100 sec bins |
 |
|
| Module-wise count rates for Quadrant A Data is divided into 100 sec bins |
 |
 |
| Module-wise count rates for Quadrant B Data is divided into 100 sec bins |
 |
 |
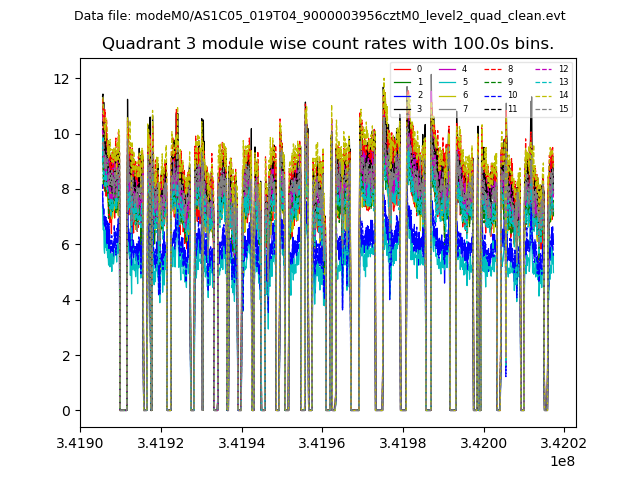
| Module-wise count rates for Quadrant C Data is divided into 100 sec bins |
 |
 |
| Module-wise count rates for Quadrant D Data is divided into 100 sec bins |
 |
 |
| Parameter | Plot |
|---|---|
| CZT HV Monitor |  |
| D_VDD | 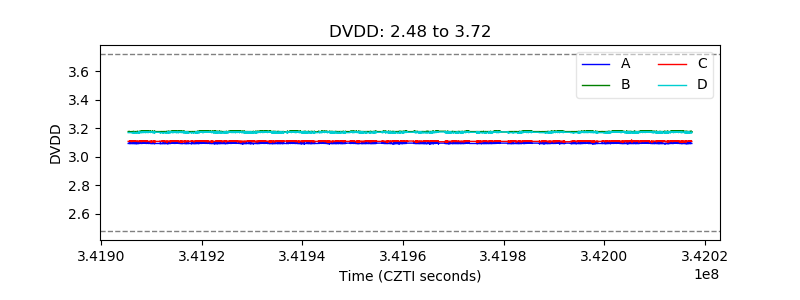 |
| Temperature 1 |  |
| Veto HV Monitor |  |
| Veto LLD |  |
| Alpha Counter |  |
| _CPM_Rate |  |
| CZT Counter |  |
| +2.5 Volts monitor | 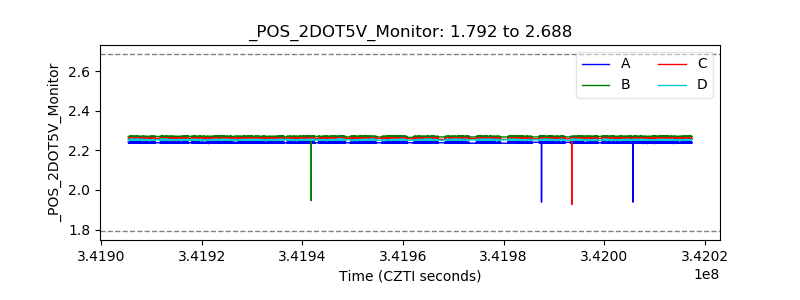 |
| +5 Volts monitor |  |
| _ROLL_ROT | 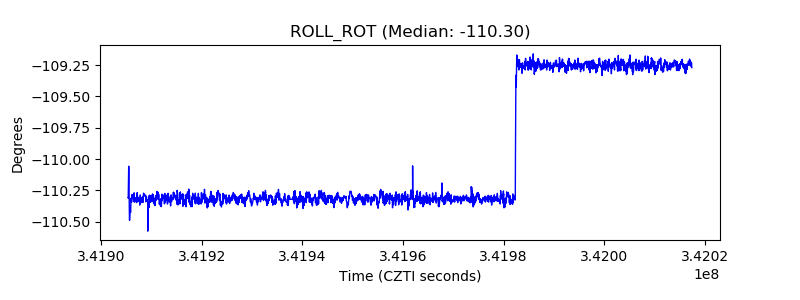 |
| _Roll_DEC |  |
| _Roll_RA |  |
| Veto Counter |  |