| Param | Original file | Final file |
|---|---|---|
| Filename | modeM0/AS1C05_019T04_9000003956_27548cztM0_level2.evt | modeM0/AS1C05_019T04_9000003956_27548cztM0_level2_quad_clean.evt |
| Size (bytes) | 453,193,920 | 107,688,960 |
| Size | 432.2 MB | 102.7 MB |
| Events in quadrant A | 2,970,621 | 721,545 |
| Events in quadrant B | 3,198,707 | 733,127 |
| Events in quadrant C | 3,010,952 | 698,432 |
| Events in quadrant D | 4,118,137 | 670,212 |
| Mode M9 | |||
|---|---|---|---|
| Quadrant | BADHDUFLAG | Total packets | Discarded packets |
| A | 0 | 8 | 0 |
| B | 0 | 8 | 0 |
| C | 0 | 8 | 0 |
| D | 0 | 8 | 0 |
| Mode M0 | |||
|---|---|---|---|
| Quadrant | BADHDUFLAG | Total packets | Discarded packets |
| A | 0 | 12798 | 0 |
| B | 0 | 13344 | 0 |
| C | 0 | 12895 | 0 |
| D | 0 | 16329 | 0 |
| Quadrant | Total seconds | Saturated seconds | Saturation percentage |
|---|---|---|---|
| A | 6269 | 75 | 1.196363% |
| B | 6270 | 107 | 1.706539% |
| C | 6270 | 88 | 1.403509% |
| D | 6270 | 251 | 4.003190% |
Noise dominated data is calculated using 1-second bins in cleaned event files. If a bin has >2000 counts, and if more than 50% of those come from <1% of pixels, then it is considered to be noise-dominated and hence unusable.
| Quadrant | # 1 sec bins | Bins with >0 counts | Bins with >2000 counts | High rate bins dominated by noise | Noise dominated (total time) | Noise dominated (detector-on time) | Marked lightcurve |
|---|---|---|---|---|---|---|---|
| A | 7134 | 6269 | 0 | 0 | 0.00% | 0.00% | 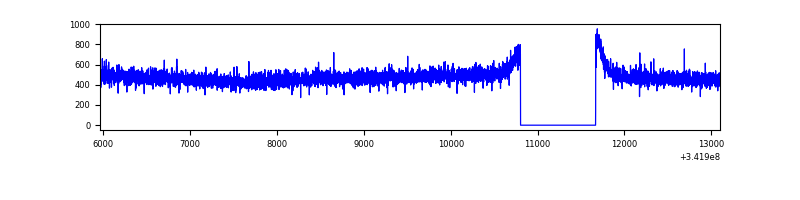 |
| B | 7135 | 6270 | 2 | 2 | 0.03% | 0.03% | 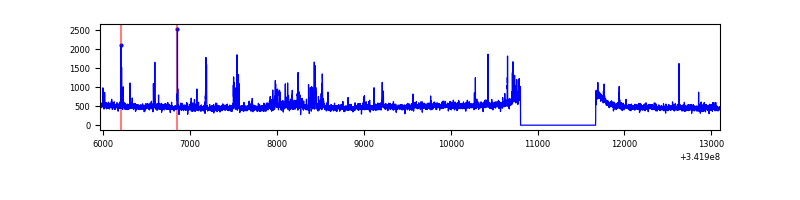 |
| C | 7135 | 6271 | 0 | 0 | 0.00% | 0.00% | 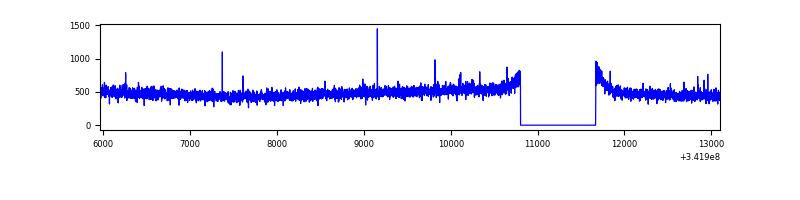 |
| D | 7135 | 6270 | 179 | 179 | 2.51% | 2.85% | 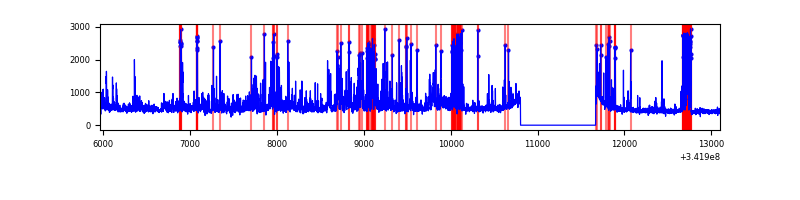 |
Top three noisy pixels from each quadrant. If the there are fewer than three noisy pixels in the level2.evt file, extra rows are filled as -1
| Pixel properties | Quadrant properties | ||||||
|---|---|---|---|---|---|---|---|
| Quadrant | DetID | PixID | Counts | Sigma | Mean | Median | Sigma |
| A | 13 | 254 | 9671 | 58.42 | 770 | 755 | 152.6 |
| A | 3 | 137 | 7189 | 42.16 | 770 | 755 | 152.6 |
| A | 0 | 226 | 6557 | 38.02 | 770 | 755 | 152.6 |
| B | 10 | 245 | 97167 | 671.17 | 764 | 745 | 143.7 |
| B | 3 | 64 | 86417 | 596.34 | 764 | 745 | 143.7 |
| B | 15 | 32 | 19608 | 131.3 | 764 | 745 | 143.7 |
| C | 14 | 238 | 120977 | 702.79 | 737 | 742 | 171.1 |
| C | 2 | 16 | 9788 | 52.88 | 737 | 742 | 171.1 |
| C | 7 | 221 | 5650 | 28.69 | 737 | 742 | 171.1 |
| D | 1 | 52 | 866020 | 5043.96 | 735 | 715 | 171.6 |
| D | 7 | 80 | 259136 | 1506.37 | 735 | 715 | 171.6 |
| D | 2 | 250 | 110944 | 642.54 | 735 | 715 | 171.6 |
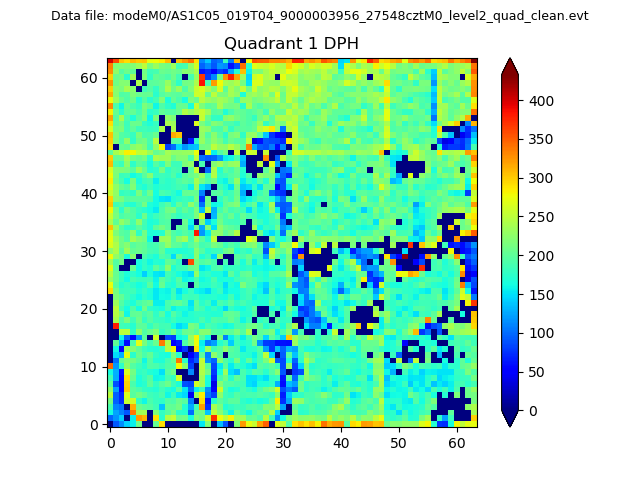
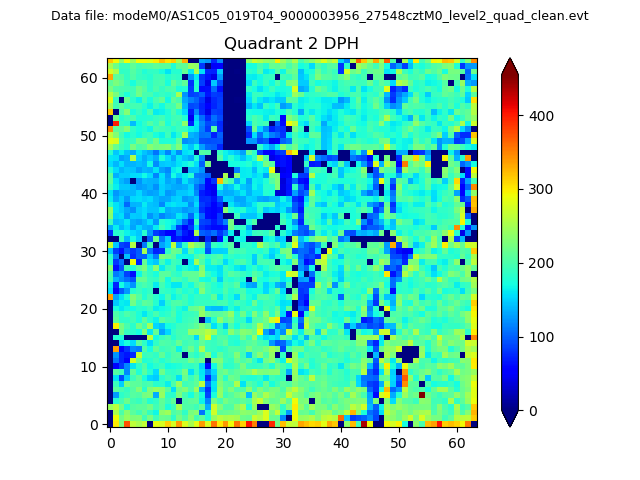
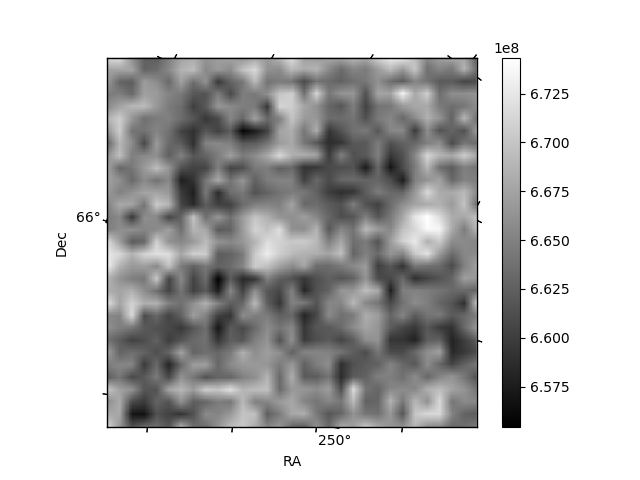
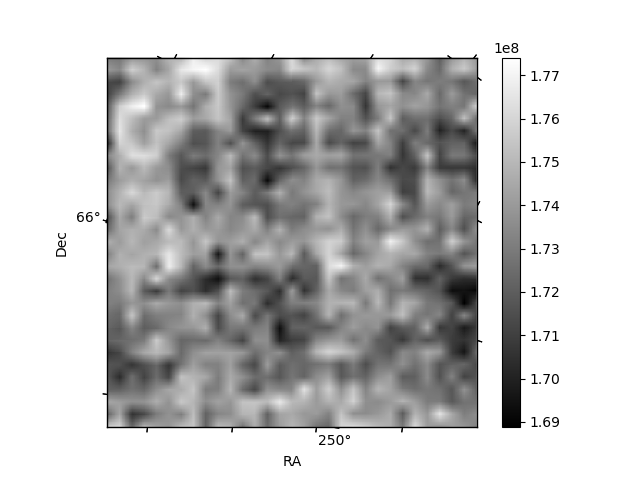
Histogram calculated using DETX and DETY for each event in the final _common_clean file
| Quadrant A |  |
 |
Quadrant B |
|---|---|---|---|
| Quadrant D | 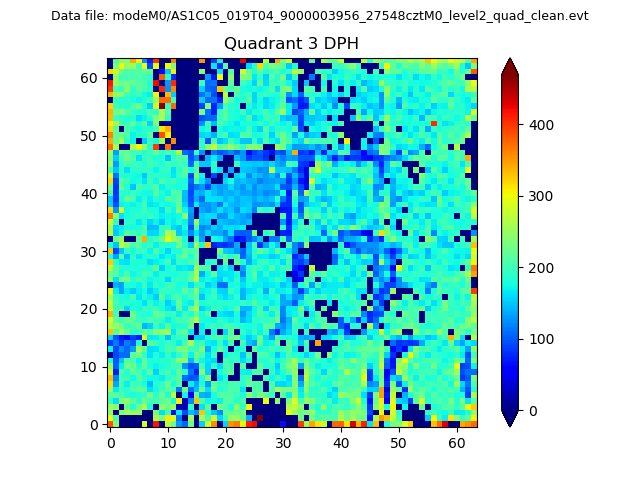 |
 |
Quadrant C |
| Plot type | Count rate plots | Images |
|---|---|---|
| Comparison with Poisson distribution Blue bars denote a histogram of data divided into 1 sec bins. Red curve is a Poisson curve with rate = median count rate of data. |
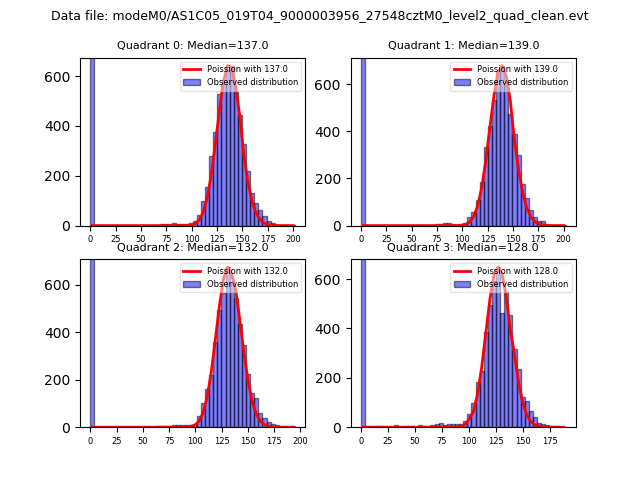 |
 |
| Quadrant-wise count rates Data is divided into 100 sec bins |
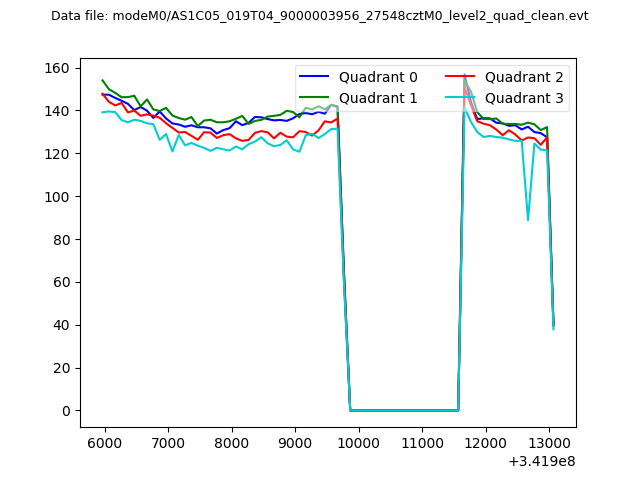 |
|
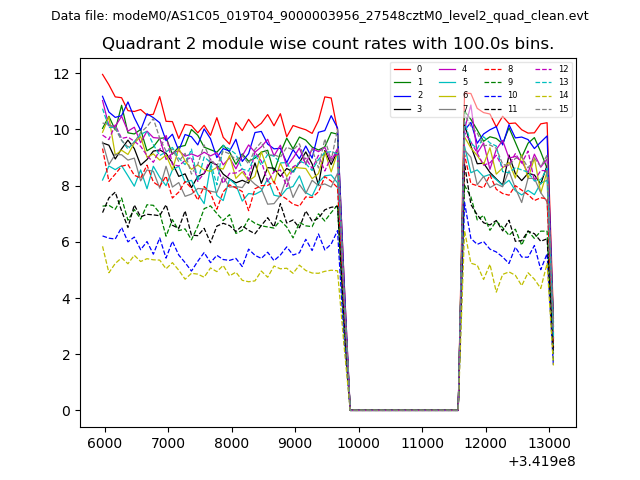
| Module-wise count rates for Quadrant A Data is divided into 100 sec bins |
 |
 |
| Module-wise count rates for Quadrant B Data is divided into 100 sec bins |
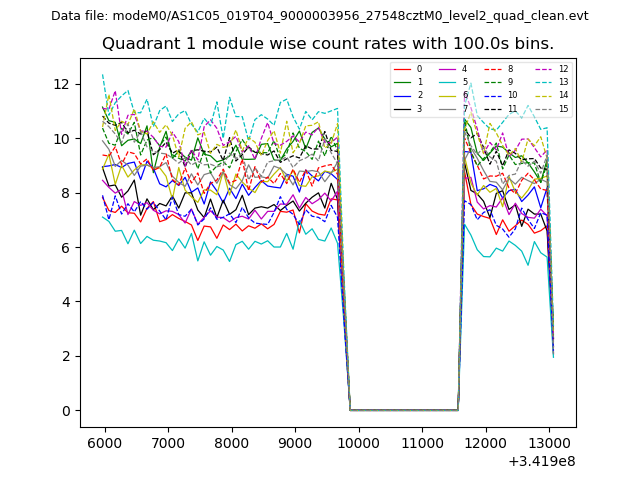 |
 |
| Module-wise count rates for Quadrant C Data is divided into 100 sec bins |
 |
 |
| Module-wise count rates for Quadrant D Data is divided into 100 sec bins |
 |
 |
| Parameter | Plot |
|---|---|
| CZT HV Monitor | 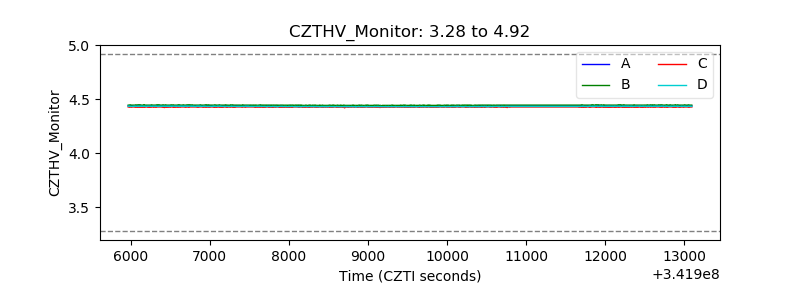 |
| D_VDD | 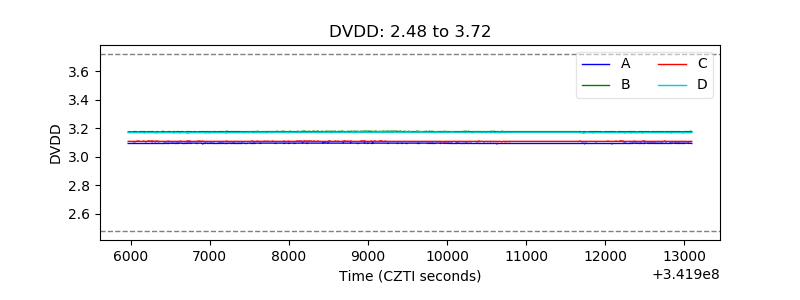 |
| Temperature 1 | 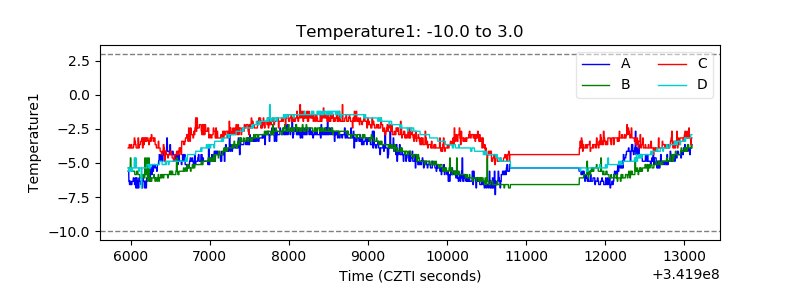 |
| Veto HV Monitor | 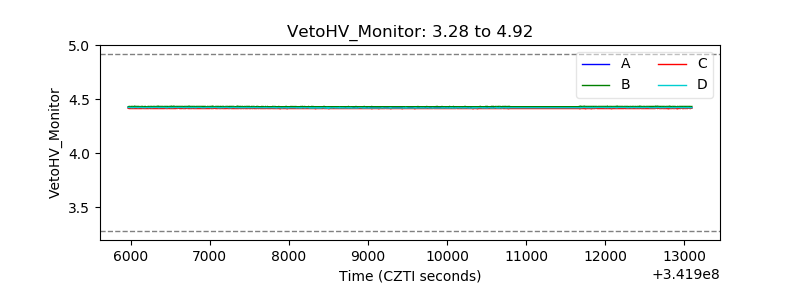 |
| Veto LLD | 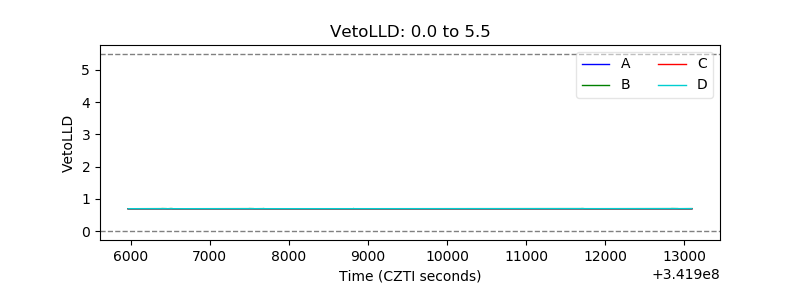 |
| Alpha Counter | 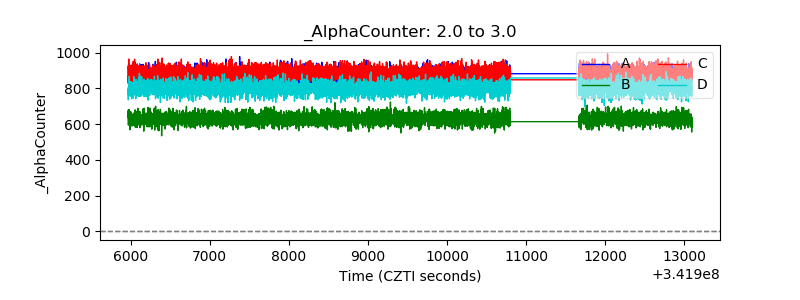 |
| _CPM_Rate | 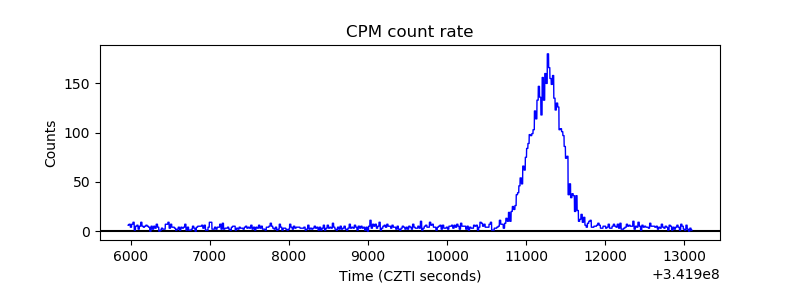 |
| CZT Counter | 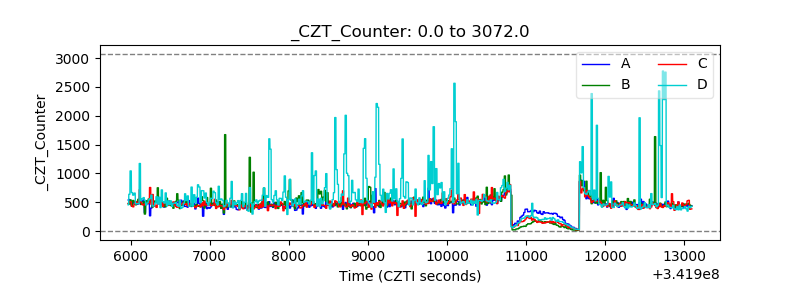 |
| +2.5 Volts monitor |  |
| +5 Volts monitor |  |
| _ROLL_ROT | 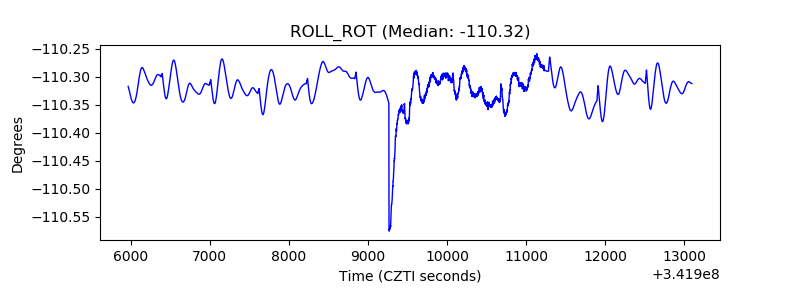 |
| _Roll_DEC | 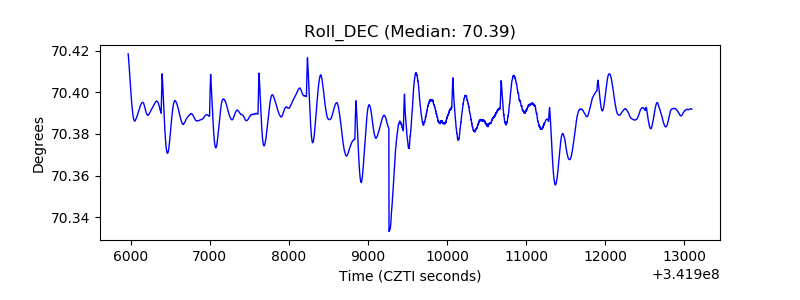 |
| _Roll_RA | 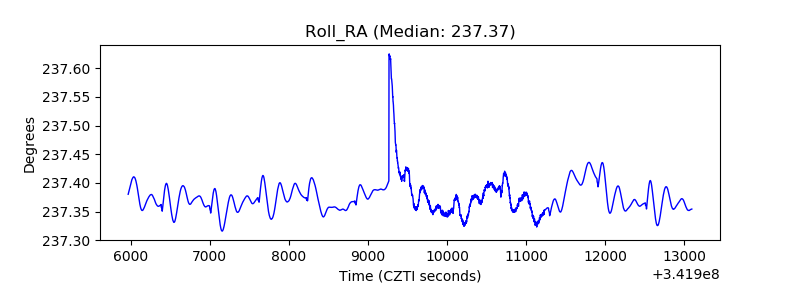 |
| Veto Counter |  |