| Param | Original file | Final file |
|---|---|---|
| Filename | modeM0/AS1C05_019T04_9000003956_27549cztM0_level2.evt | modeM0/AS1C05_019T04_9000003956_27549cztM0_level2_quad_clean.evt |
| Size (bytes) | 519,367,680 | 116,161,920 |
| Size | 495.3 MB | 110.8 MB |
| Events in quadrant A | 3,250,642 | 773,742 |
| Events in quadrant B | 3,616,969 | 786,479 |
| Events in quadrant C | 3,303,953 | 751,695 |
| Events in quadrant D | 5,084,127 | 720,302 |
| Mode M9 | |||
|---|---|---|---|
| Quadrant | BADHDUFLAG | Total packets | Discarded packets |
| A | 0 | 4 | 0 |
| B | 0 | 4 | 0 |
| C | 0 | 4 | 0 |
| D | 0 | 4 | 0 |
| Mode M0 | |||
|---|---|---|---|
| Quadrant | BADHDUFLAG | Total packets | Discarded packets |
| A | 0 | 14284 | 0 |
| B | 0 | 15220 | 0 |
| C | 0 | 14351 | 0 |
| D | 0 | 19854 | 0 |
| Quadrant | Total seconds | Saturated seconds | Saturation percentage |
|---|---|---|---|
| A | 6973 | 85 | 1.218988% |
| B | 6974 | 169 | 2.423286% |
| C | 6974 | 88 | 1.261830% |
| D | 6974 | 364 | 5.219386% |
Noise dominated data is calculated using 1-second bins in cleaned event files. If a bin has >2000 counts, and if more than 50% of those come from <1% of pixels, then it is considered to be noise-dominated and hence unusable.
| Quadrant | # 1 sec bins | Bins with >0 counts | Bins with >2000 counts | High rate bins dominated by noise | Noise dominated (total time) | Noise dominated (detector-on time) | Marked lightcurve |
|---|---|---|---|---|---|---|---|
| A | 7393 | 6973 | 0 | 0 | 0.00% | 0.00% |  |
| B | 7394 | 6974 | 84 | 84 | 1.14% | 1.20% |  |
| C | 7394 | 6974 | 1 | 1 | 0.01% | 0.01% |  |
| D | 7394 | 6974 | 310 | 310 | 4.19% | 4.45% |  |
Top three noisy pixels from each quadrant. If the there are fewer than three noisy pixels in the level2.evt file, extra rows are filled as -1
| Pixel properties | Quadrant properties | ||||||
|---|---|---|---|---|---|---|---|
| Quadrant | DetID | PixID | Counts | Sigma | Mean | Median | Sigma |
| A | 13 | 254 | 10130 | 54.86 | 843 | 825 | 169.6 |
| A | 3 | 137 | 8110 | 42.95 | 843 | 825 | 169.6 |
| A | 0 | 226 | 7196 | 37.56 | 843 | 825 | 169.6 |
| B | 10 | 245 | 315147 | 2007.58 | 828 | 806 | 156.6 |
| B | 0 | 230 | 23717 | 146.32 | 828 | 806 | 156.6 |
| B | 15 | 32 | 19976 | 122.43 | 828 | 806 | 156.6 |
| C | 14 | 238 | 132565 | 702.79 | 802 | 804 | 187.5 |
| C | 7 | 221 | 15553 | 78.67 | 802 | 804 | 187.5 |
| C | 2 | 16 | 13754 | 69.07 | 802 | 804 | 187.5 |
| D | 1 | 52 | 1584977 | 8371.67 | 802 | 779 | 189.2 |
| D | 7 | 80 | 386413 | 2037.88 | 802 | 779 | 189.2 |
| D | 2 | 250 | 67934 | 354.88 | 802 | 779 | 189.2 |
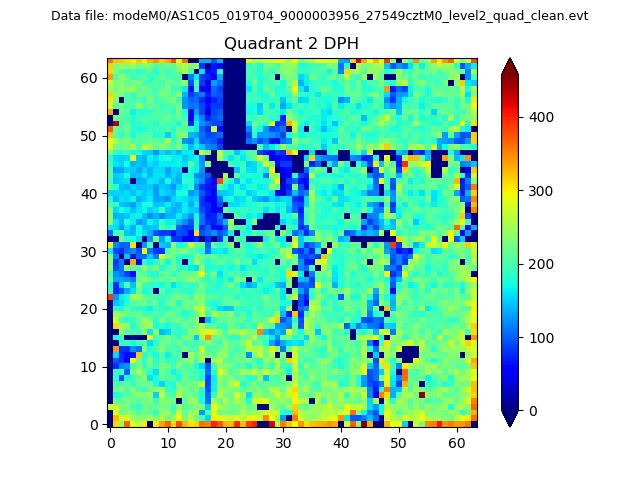
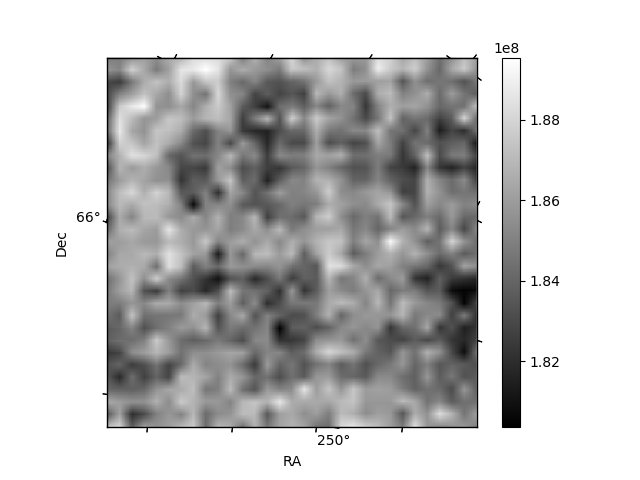
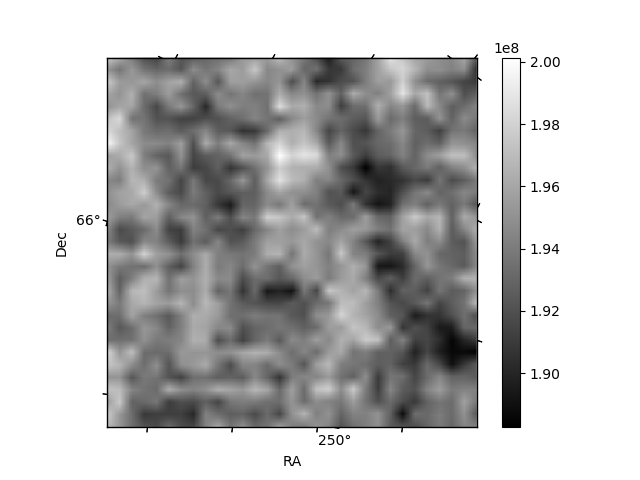
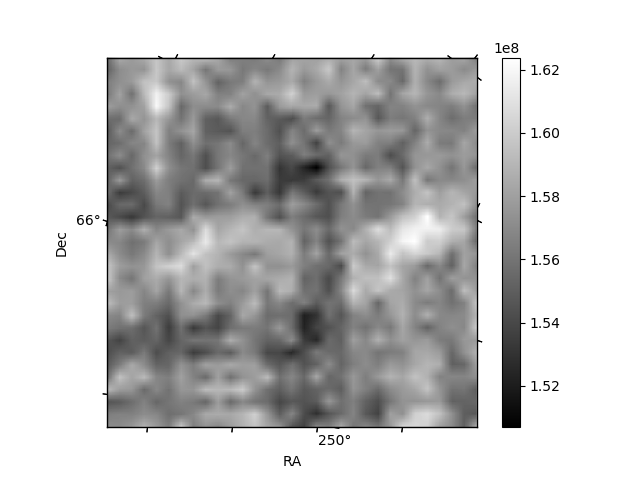
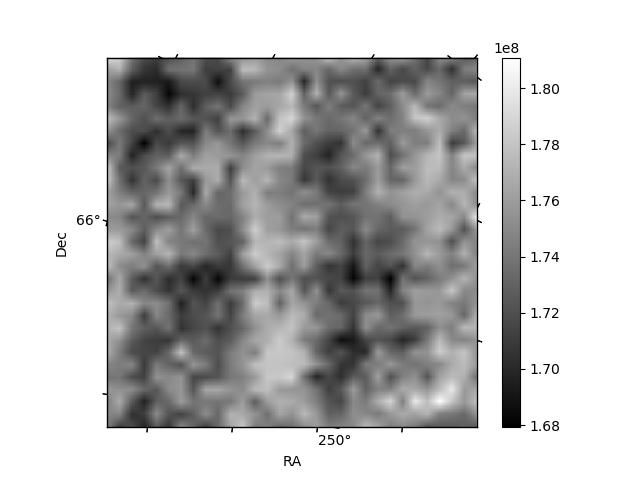
Histogram calculated using DETX and DETY for each event in the final _common_clean file
| Quadrant A | 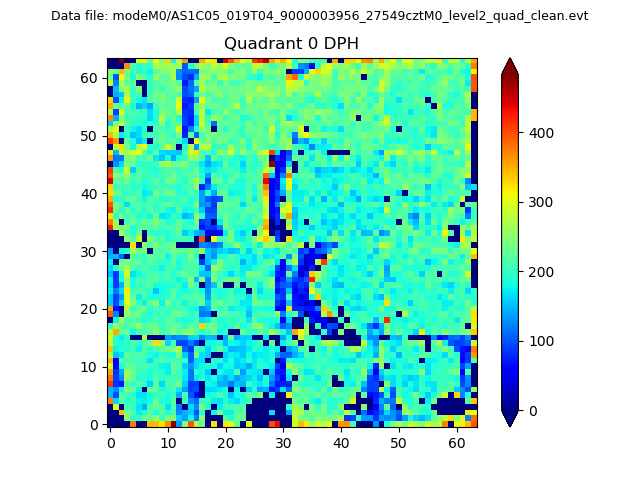 |
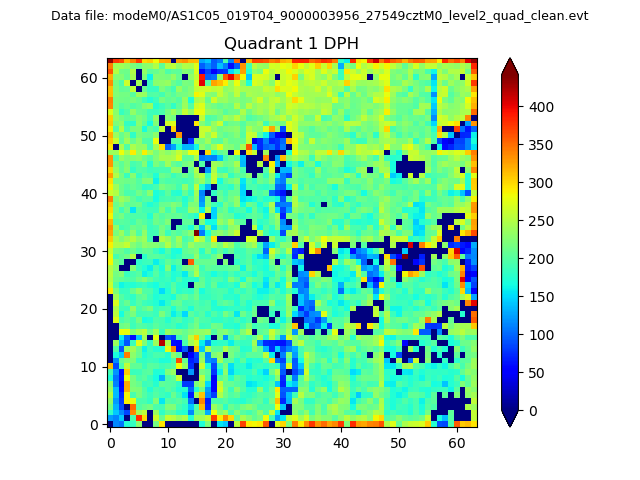 |
Quadrant B |
|---|---|---|---|
| Quadrant D | 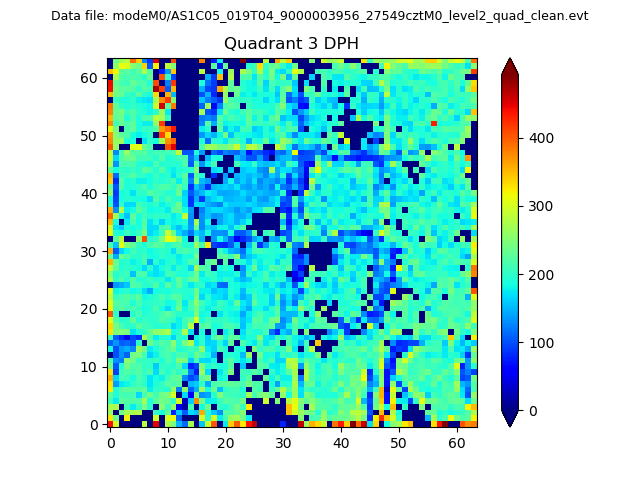 |
 |
Quadrant C |
| Plot type | Count rate plots | Images |
|---|---|---|
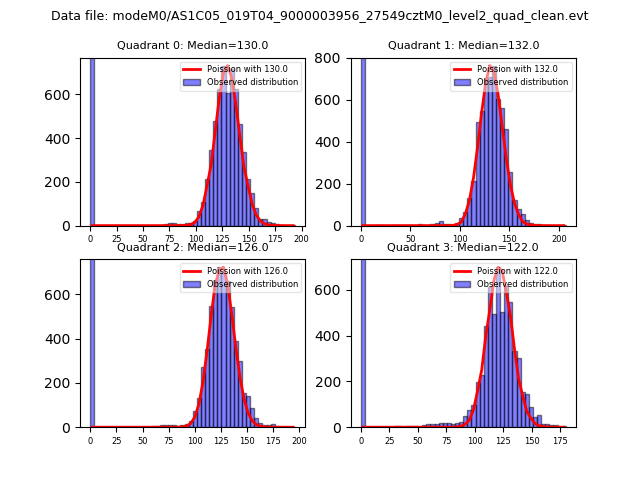
| Comparison with Poisson distribution Blue bars denote a histogram of data divided into 1 sec bins. Red curve is a Poisson curve with rate = median count rate of data. |
 |
 |
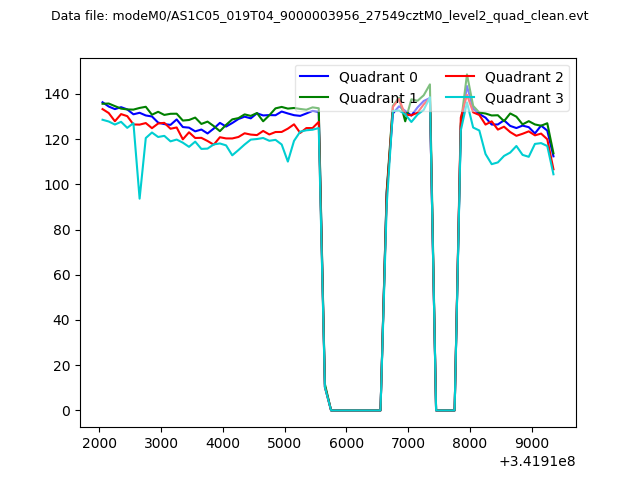
| Quadrant-wise count rates Data is divided into 100 sec bins |
 |
|
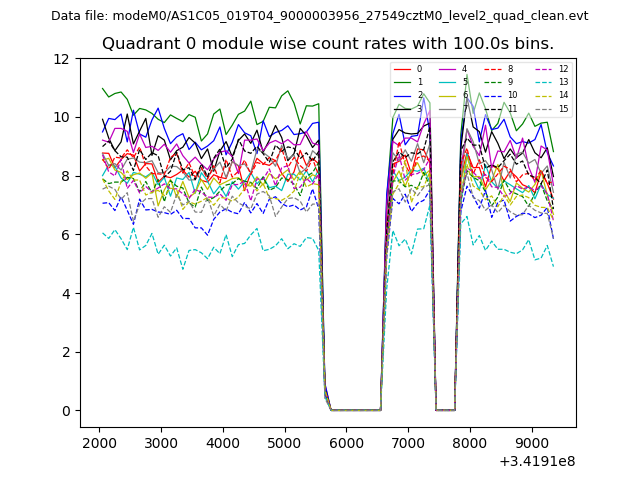
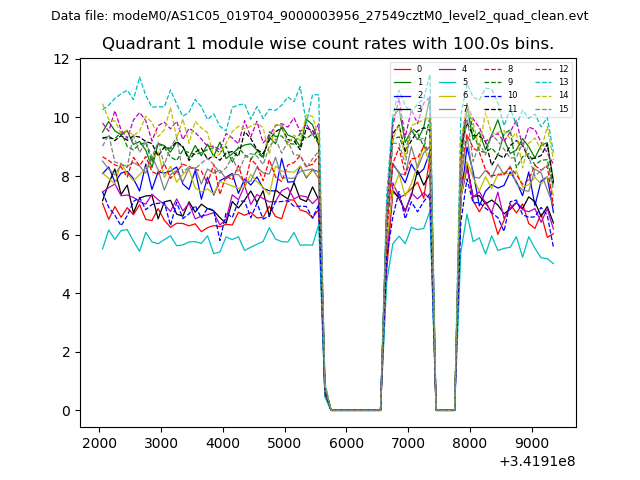
| Module-wise count rates for Quadrant A Data is divided into 100 sec bins |
 |
 |
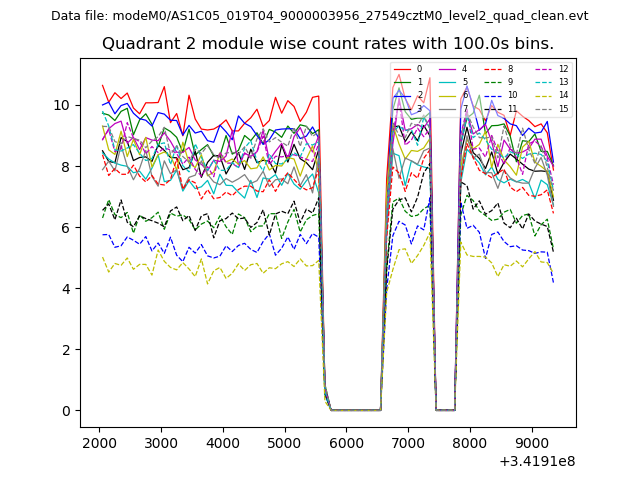
| Module-wise count rates for Quadrant B Data is divided into 100 sec bins |
 |
 |
| Module-wise count rates for Quadrant C Data is divided into 100 sec bins |
 |
 |
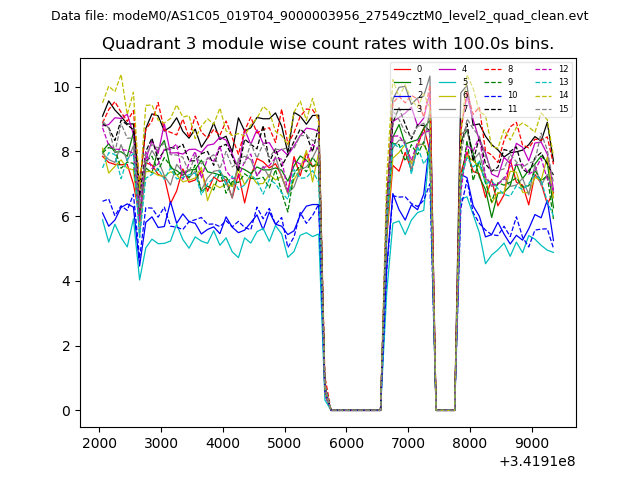
| Module-wise count rates for Quadrant D Data is divided into 100 sec bins |
 |
 |
| Parameter | Plot |
|---|---|
| CZT HV Monitor | 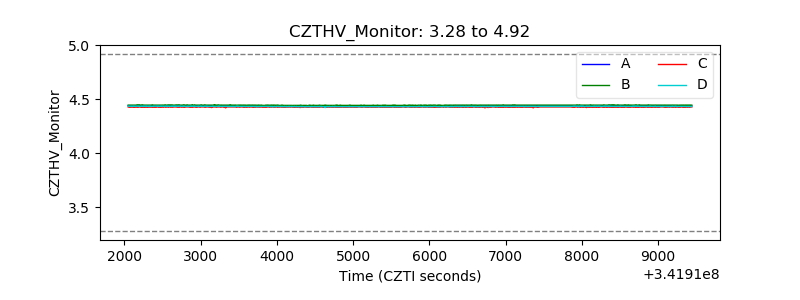 |
| D_VDD | 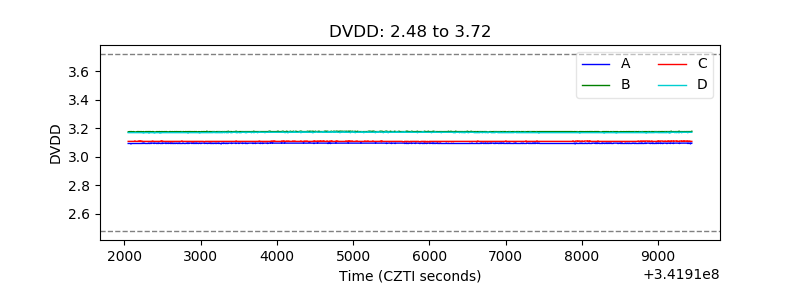 |
| Temperature 1 | 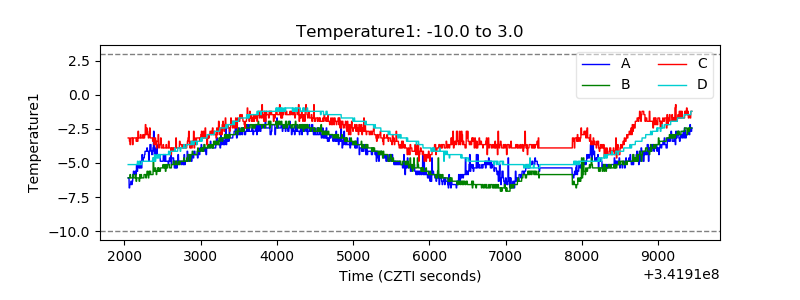 |
| Veto HV Monitor | 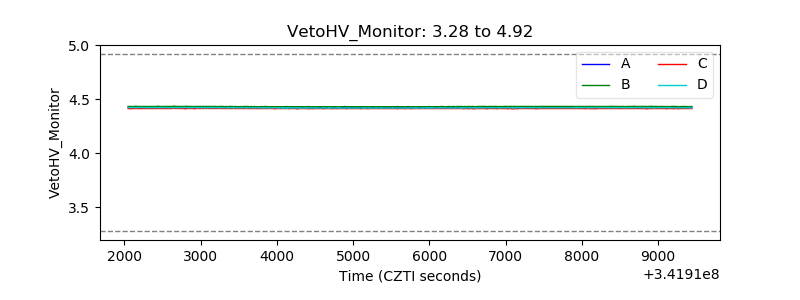 |
| Veto LLD | 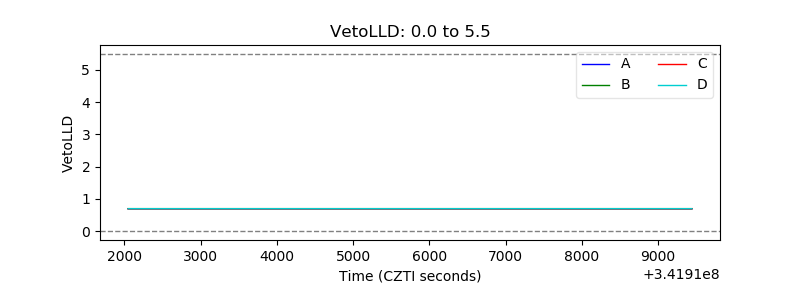 |
| Alpha Counter | 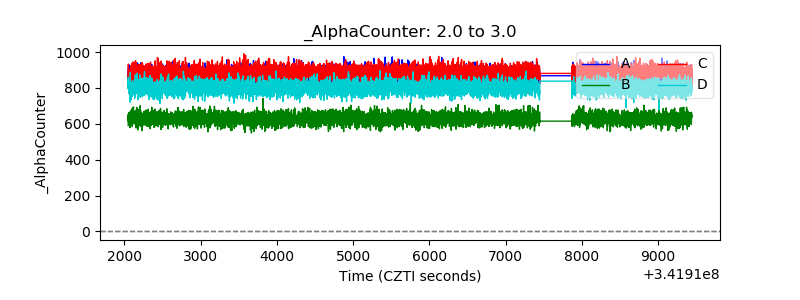 |
| _CPM_Rate | 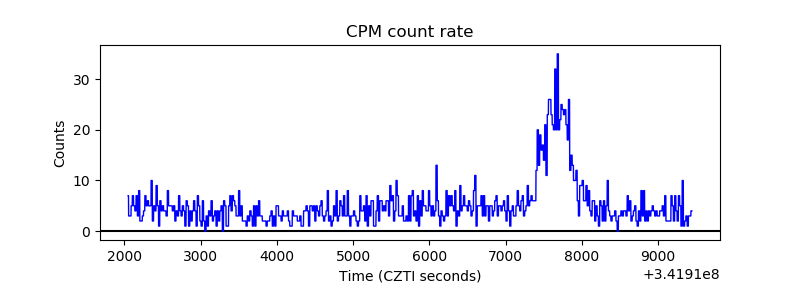 |
| CZT Counter | 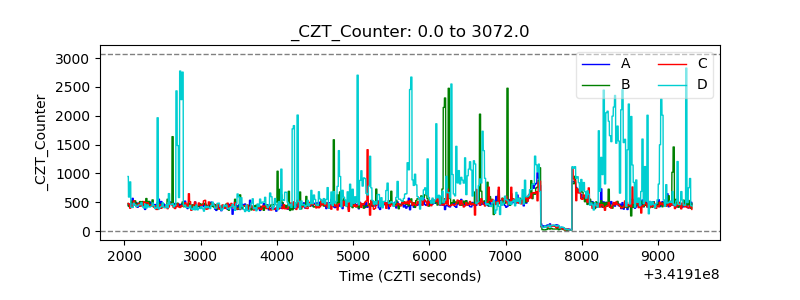 |
| +2.5 Volts monitor |  |
| +5 Volts monitor |  |
| _ROLL_ROT | 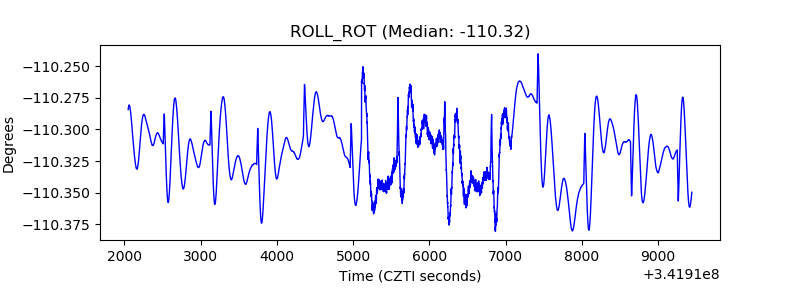 |
| _Roll_DEC | 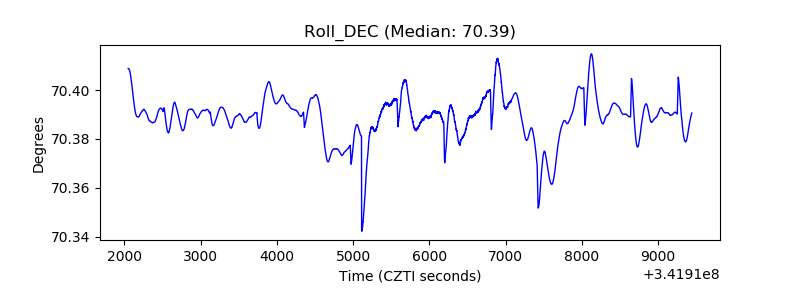 |
| _Roll_RA | 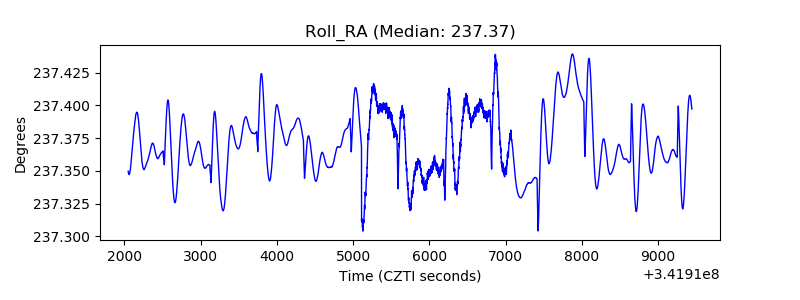 |
| Veto Counter | 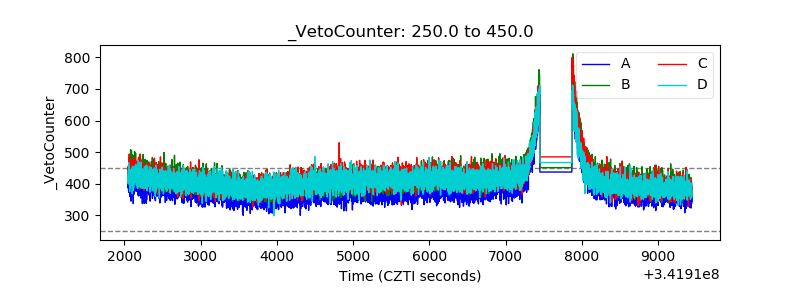 |