| Param | Original file | Final file |
|---|---|---|
| Filename | modeM0/AS1C05_019T04_9000003956_27550cztM0_level2.evt | modeM0/AS1C05_019T04_9000003956_27550cztM0_level2_quad_clean.evt |
| Size (bytes) | 566,856,000 | 116,084,160 |
| Size | 540.6 MB | 110.7 MB |
| Events in quadrant A | 3,340,951 | 778,234 |
| Events in quadrant B | 3,988,286 | 786,498 |
| Events in quadrant C | 4,606,384 | 733,919 |
| Events in quadrant D | 4,750,499 | 722,736 |
| Mode M0 | |||
|---|---|---|---|
| Quadrant | BADHDUFLAG | Total packets | Discarded packets |
| A | 0 | 14672 | 0 |
| B | 0 | 16419 | 0 |
| C | 0 | 18363 | 0 |
| D | 0 | 18857 | 0 |
| Quadrant | Total seconds | Saturated seconds | Saturation percentage |
|---|---|---|---|
| A | 7092 | 130 | 1.833051% |
| B | 7093 | 234 | 3.299027% |
| C | 7092 | 525 | 7.402707% |
| D | 7092 | 411 | 5.795262% |
Noise dominated data is calculated using 1-second bins in cleaned event files. If a bin has >2000 counts, and if more than 50% of those come from <1% of pixels, then it is considered to be noise-dominated and hence unusable.
| Quadrant | # 1 sec bins | Bins with >0 counts | Bins with >2000 counts | High rate bins dominated by noise | Noise dominated (total time) | Noise dominated (detector-on time) | Marked lightcurve |
|---|---|---|---|---|---|---|---|
| A | 7092 | 7092 | 0 | 0 | 0.00% | 0.00% | 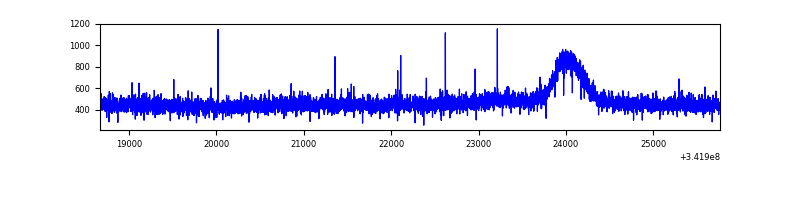 |
| B | 7093 | 7093 | 59 | 59 | 0.83% | 0.83% | 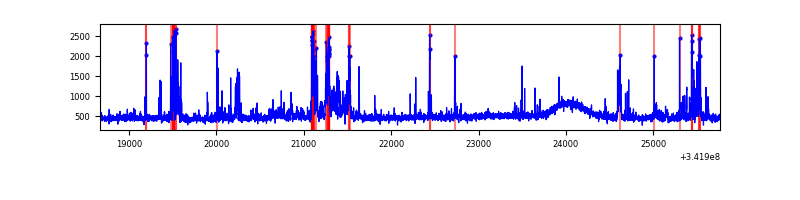 |
| C | 7092 | 7092 | 153 | 153 | 2.16% | 2.16% | 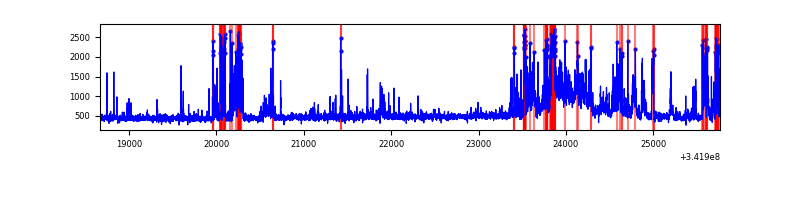 |
| D | 7092 | 7092 | 287 | 287 | 4.05% | 4.05% | 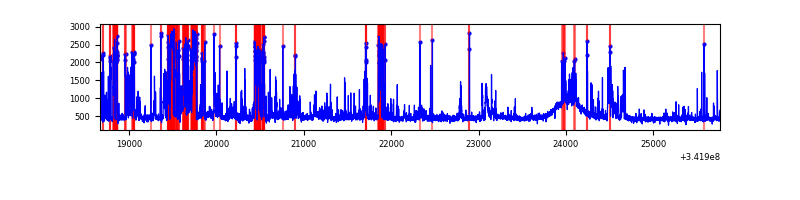 |
Top three noisy pixels from each quadrant. If the there are fewer than three noisy pixels in the level2.evt file, extra rows are filled as -1
| Pixel properties | Quadrant properties | ||||||
|---|---|---|---|---|---|---|---|
| Quadrant | DetID | PixID | Counts | Sigma | Mean | Median | Sigma |
| A | 13 | 254 | 11567 | 61.41 | 866 | 846 | 174.6 |
| A | 3 | 137 | 8336 | 42.9 | 866 | 846 | 174.6 |
| A | 0 | 226 | 7588 | 38.62 | 866 | 846 | 174.6 |
| B | 10 | 245 | 527012 | 3238.08 | 853 | 830 | 162.5 |
| B | 15 | 32 | 40021 | 241.18 | 853 | 830 | 162.5 |
| B | 12 | 111 | 20293 | 119.77 | 853 | 830 | 162.5 |
| C | 7 | 221 | 956816 | 5056.09 | 809 | 813 | 189.1 |
| C | 2 | 16 | 322931 | 1703.61 | 809 | 813 | 189.1 |
| C | 14 | 238 | 131373 | 690.5 | 809 | 813 | 189.1 |
| D | 1 | 52 | 1386737 | 7103.45 | 825 | 799 | 195.1 |
| D | 6 | 112 | 90368 | 459.07 | 825 | 799 | 195.1 |
| D | 2 | 250 | 77877 | 395.05 | 825 | 799 | 195.1 |
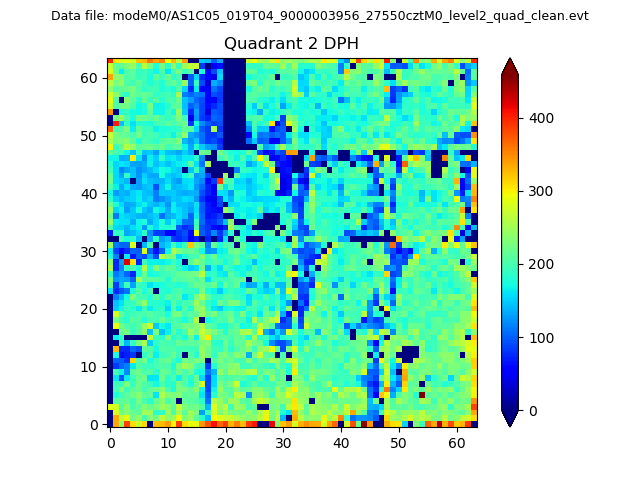
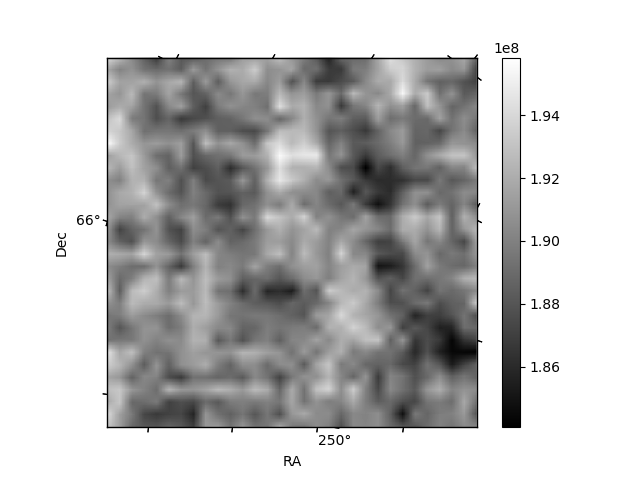
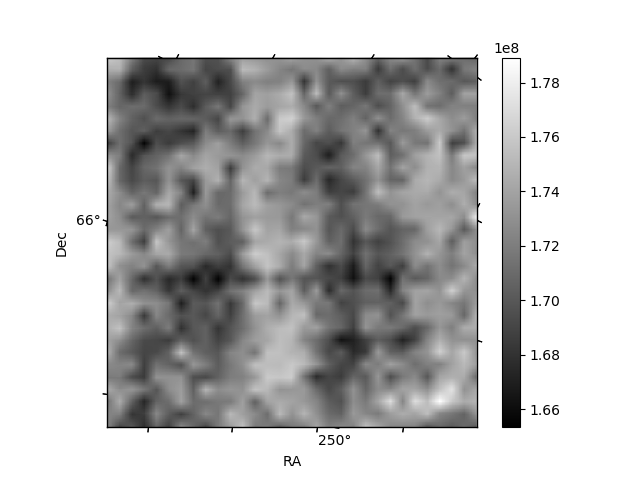
Histogram calculated using DETX and DETY for each event in the final _common_clean file
| Quadrant A | 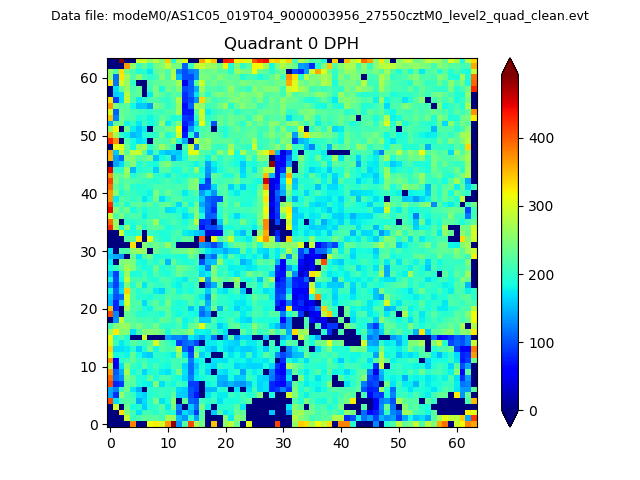 |
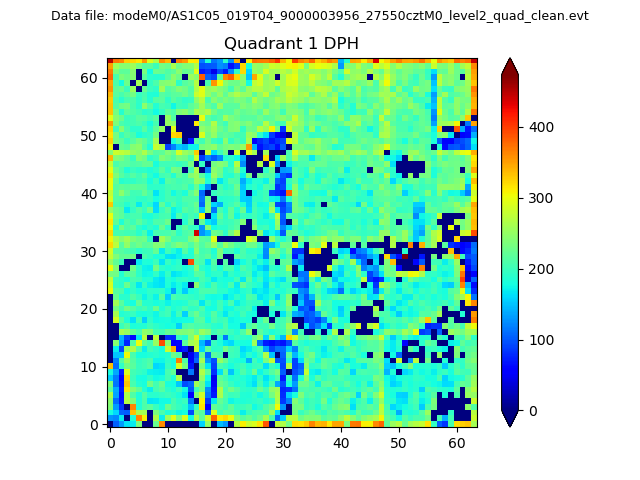 |
Quadrant B |
|---|---|---|---|
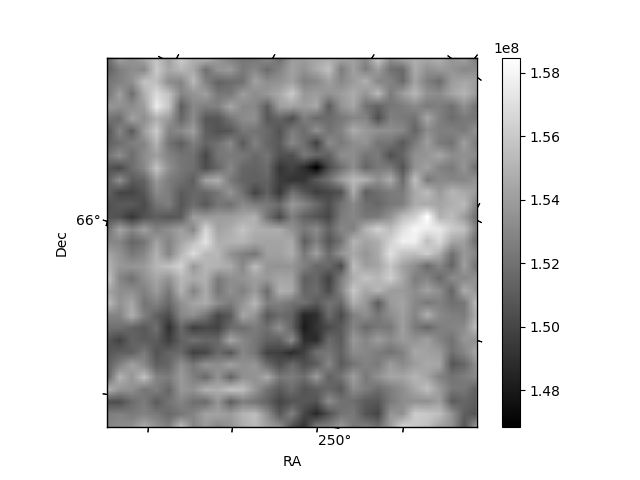
| Quadrant D | 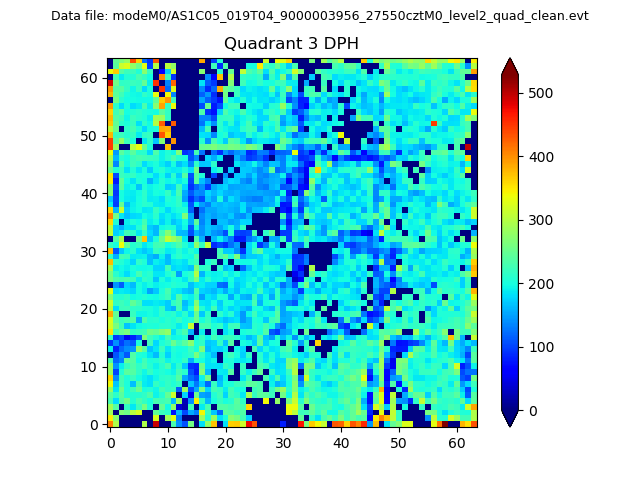 |
 |
Quadrant C |
| Plot type | Count rate plots | Images |
|---|---|---|
| Comparison with Poisson distribution Blue bars denote a histogram of data divided into 1 sec bins. Red curve is a Poisson curve with rate = median count rate of data. |
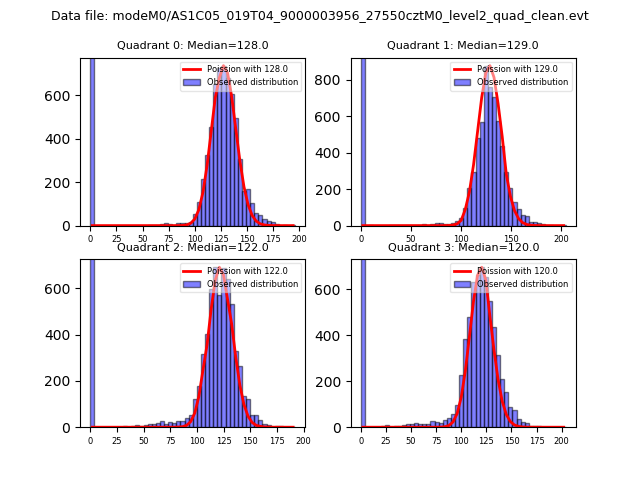 |
 |
| Quadrant-wise count rates Data is divided into 100 sec bins |
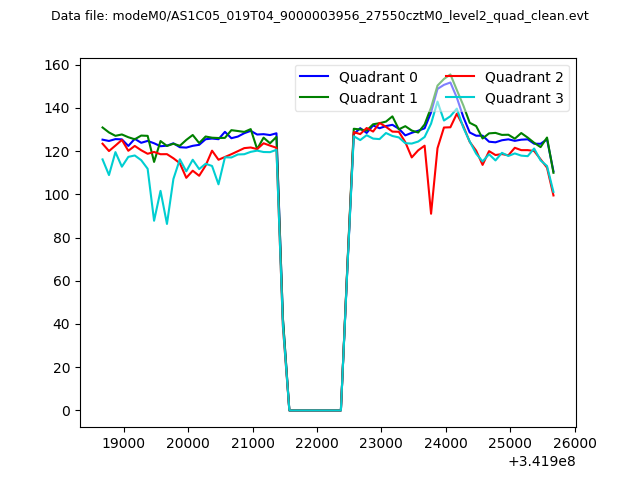 |
|
| Module-wise count rates for Quadrant A Data is divided into 100 sec bins |
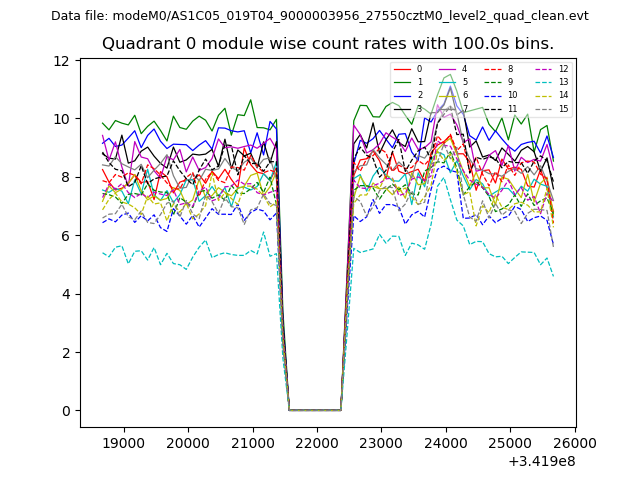 |
 |
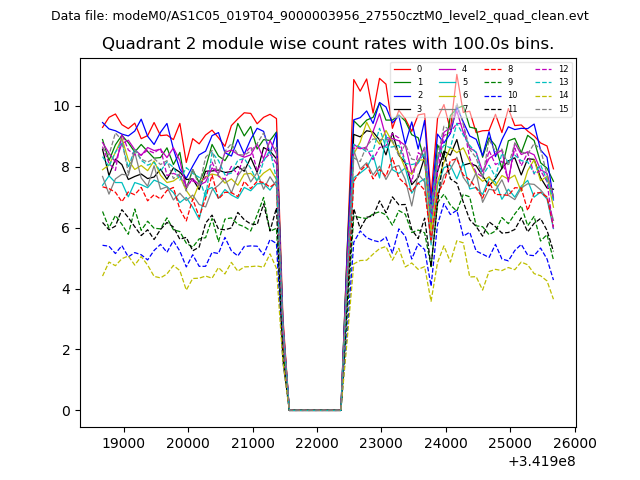
| Module-wise count rates for Quadrant B Data is divided into 100 sec bins |
 |
 |
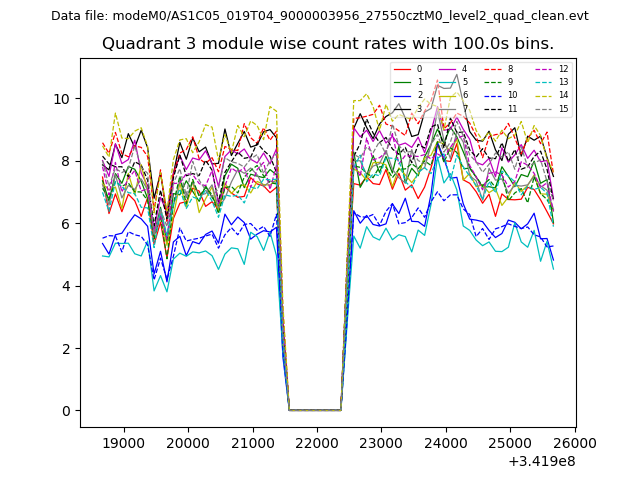
| Module-wise count rates for Quadrant C Data is divided into 100 sec bins |
 |
 |
| Module-wise count rates for Quadrant D Data is divided into 100 sec bins |
 |
 |
| Parameter | Plot |
|---|---|
| CZT HV Monitor | 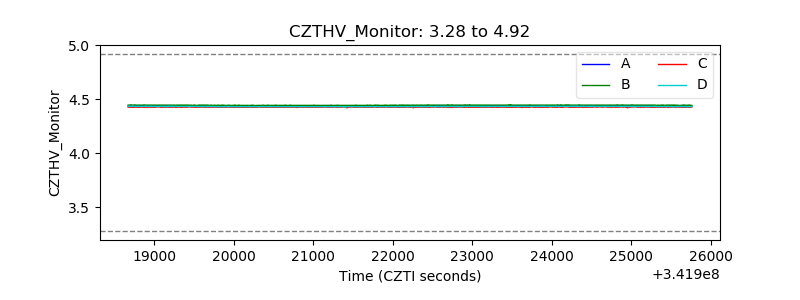 |
| D_VDD | 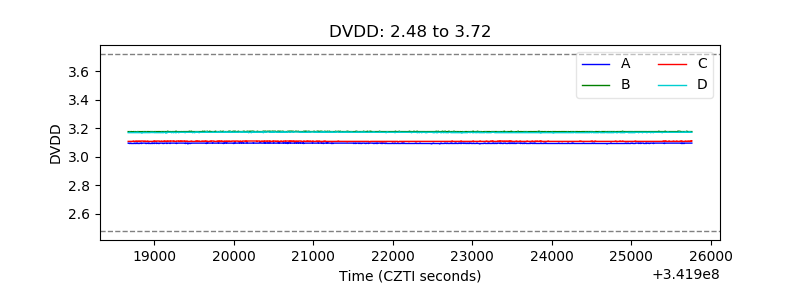 |
| Temperature 1 | 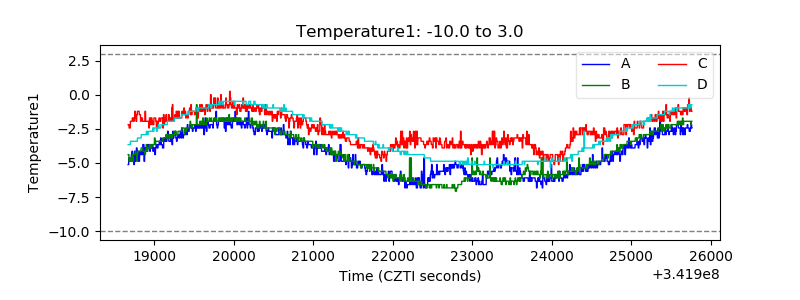 |
| Veto HV Monitor | 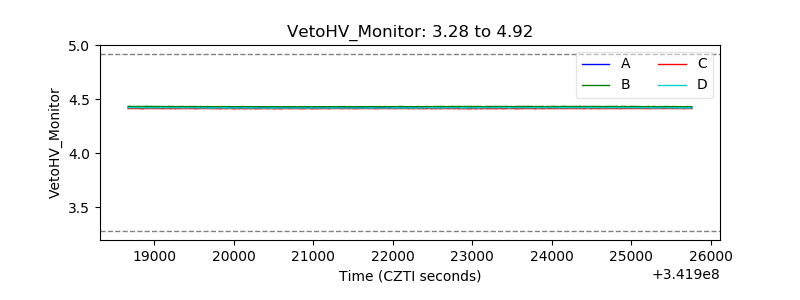 |
| Veto LLD | 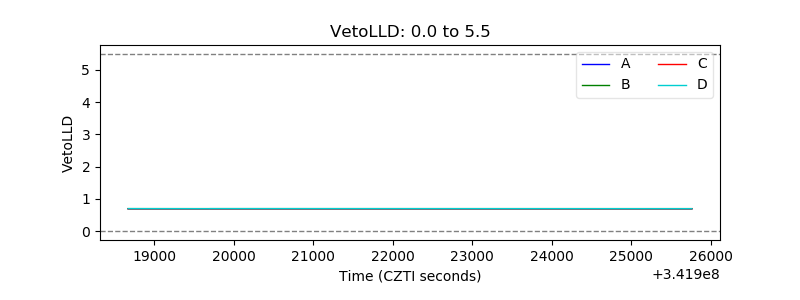 |
| Alpha Counter | 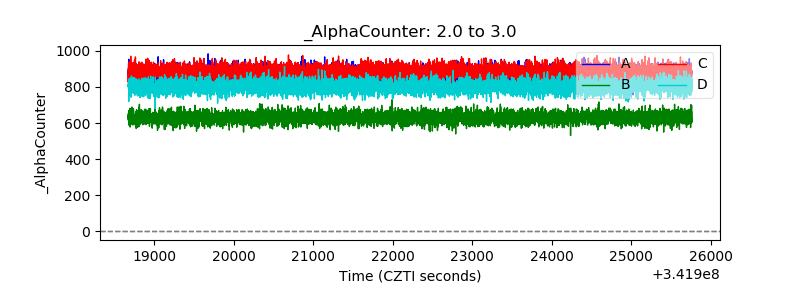 |
| _CPM_Rate | 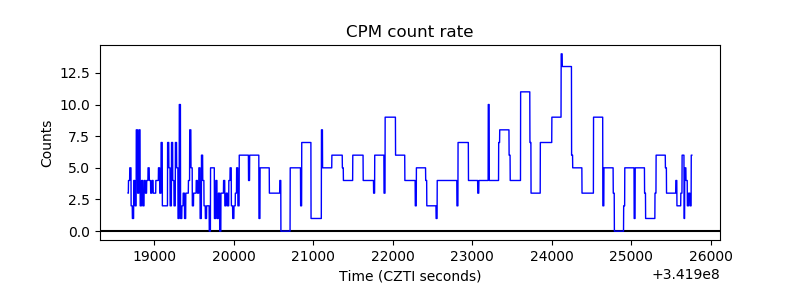 |
| CZT Counter | 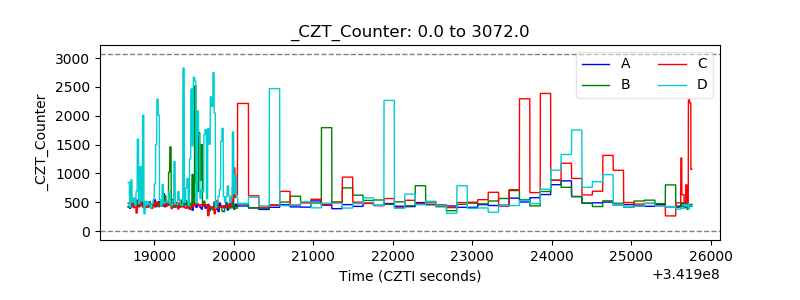 |
| +2.5 Volts monitor | 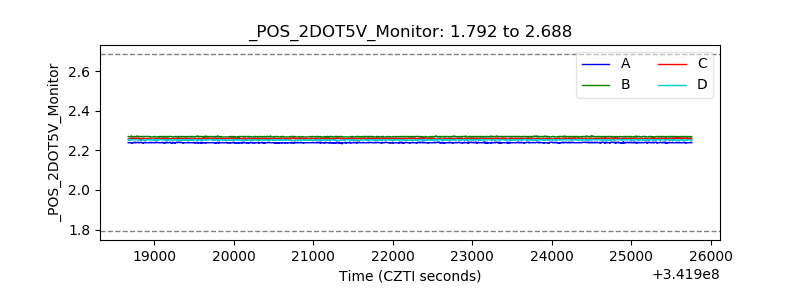 |
| +5 Volts monitor |  |
| _ROLL_ROT | 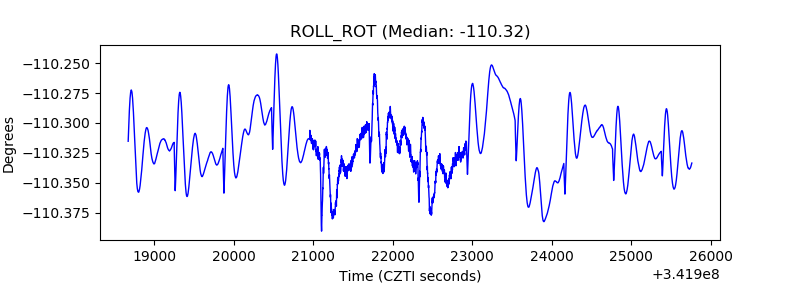 |
| _Roll_DEC | 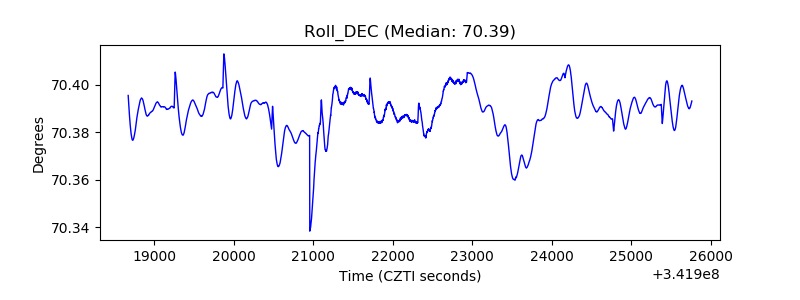 |
| _Roll_RA | 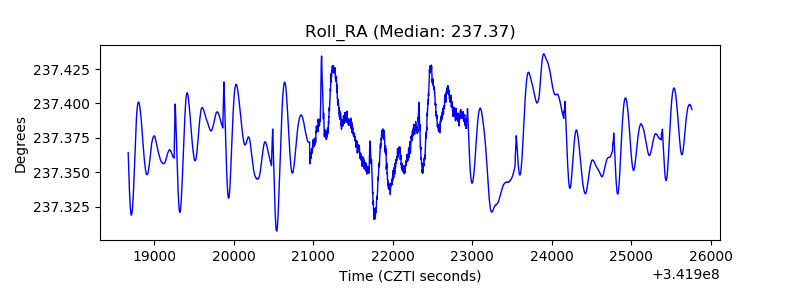 |
| Veto Counter | 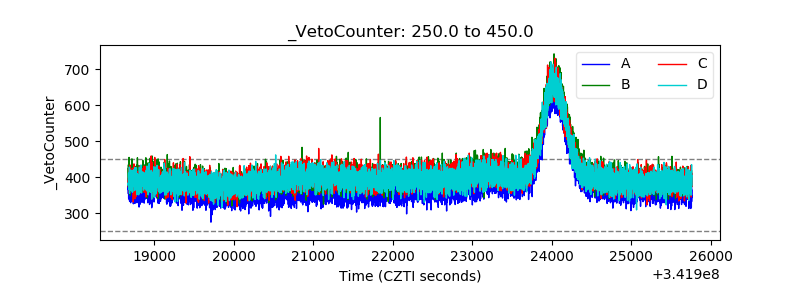 |