| Param | Original file | Final file |
|---|---|---|
| Filename | modeM0/AS1C05_019T04_9000003956_27551cztM0_level2.evt | modeM0/AS1C05_019T04_9000003956_27551cztM0_level2_quad_clean.evt |
| Size (bytes) | 576,250,560 | 121,170,240 |
| Size | 549.6 MB | 115.6 MB |
| Events in quadrant A | 3,428,514 | 810,887 |
| Events in quadrant B | 3,783,340 | 821,935 |
| Events in quadrant C | 5,018,160 | 765,097 |
| Events in quadrant D | 4,719,175 | 755,950 |
| Mode M9 | |||
|---|---|---|---|
| Quadrant | BADHDUFLAG | Total packets | Discarded packets |
| A | 0 | 1 | 0 |
| B | 0 | 1 | 0 |
| C | 0 | 1 | 0 |
| D | 0 | 1 | 0 |
| Mode M0 | |||
|---|---|---|---|
| Quadrant | BADHDUFLAG | Total packets | Discarded packets |
| A | 0 | 15153 | 0 |
| B | 0 | 15908 | 0 |
| C | 0 | 19755 | 0 |
| D | 0 | 18963 | 0 |
| Quadrant | Total seconds | Saturated seconds | Saturation percentage |
|---|---|---|---|
| A | 7401 | 117 | 1.580867% |
| B | 7401 | 156 | 2.107823% |
| C | 7402 | 494 | 6.673872% |
| D | 7402 | 345 | 4.660902% |
Noise dominated data is calculated using 1-second bins in cleaned event files. If a bin has >2000 counts, and if more than 50% of those come from <1% of pixels, then it is considered to be noise-dominated and hence unusable.
| Quadrant | # 1 sec bins | Bins with >0 counts | Bins with >2000 counts | High rate bins dominated by noise | Noise dominated (total time) | Noise dominated (detector-on time) | Marked lightcurve |
|---|---|---|---|---|---|---|---|
| A | 7561 | 7401 | 0 | 0 | 0.00% | 0.00% |  |
| B | 7561 | 7401 | 12 | 12 | 0.16% | 0.16% |  |
| C | 7562 | 7402 | 243 | 243 | 3.21% | 3.28% |  |
| D | 7562 | 7402 | 217 | 217 | 2.87% | 2.93% |  |
Top three noisy pixels from each quadrant. If the there are fewer than three noisy pixels in the level2.evt file, extra rows are filled as -1
| Pixel properties | Quadrant properties | ||||||
|---|---|---|---|---|---|---|---|
| Quadrant | DetID | PixID | Counts | Sigma | Mean | Median | Sigma |
| A | 13 | 254 | 12360 | 64.39 | 888 | 870 | 178.4 |
| A | 3 | 137 | 8778 | 44.32 | 888 | 870 | 178.4 |
| A | 0 | 226 | 7486 | 37.08 | 888 | 870 | 178.4 |
| B | 10 | 245 | 186243 | 1109.46 | 876 | 852 | 167.1 |
| B | 3 | 64 | 81351 | 481.74 | 876 | 852 | 167.1 |
| B | 15 | 32 | 43146 | 253.11 | 876 | 852 | 167.1 |
| C | 7 | 221 | 1486500 | 7524.67 | 838 | 841 | 197.4 |
| C | 14 | 238 | 134337 | 676.14 | 838 | 841 | 197.4 |
| C | 10 | 22 | 62118 | 310.36 | 838 | 841 | 197.4 |
| D | 1 | 52 | 1252480 | 6140.04 | 852 | 827 | 203.9 |
| D | 2 | 250 | 163579 | 798.39 | 852 | 827 | 203.9 |
| D | 2 | 234 | 34777 | 166.54 | 852 | 827 | 203.9 |
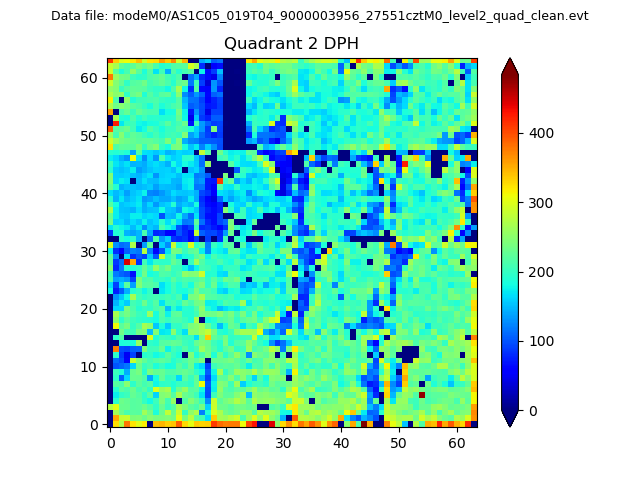
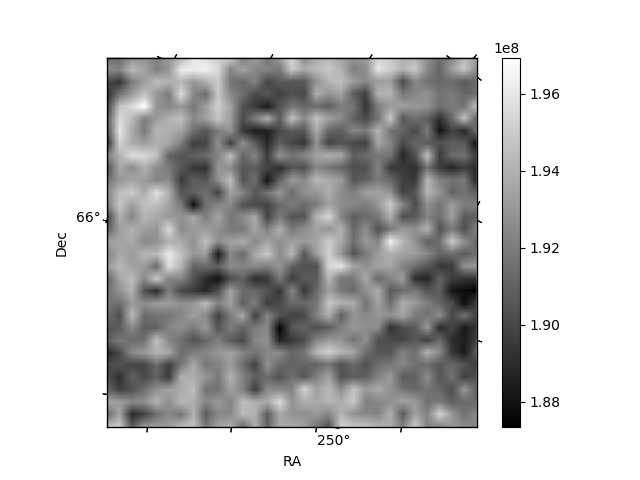
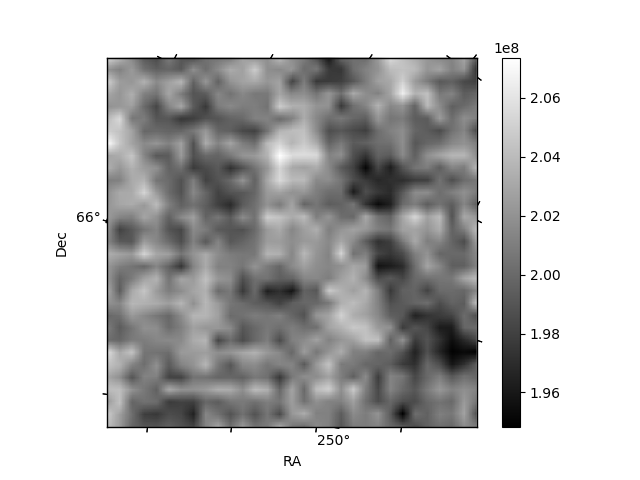
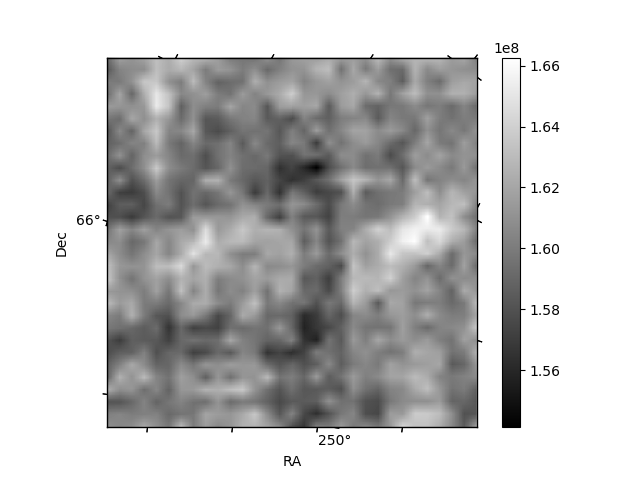
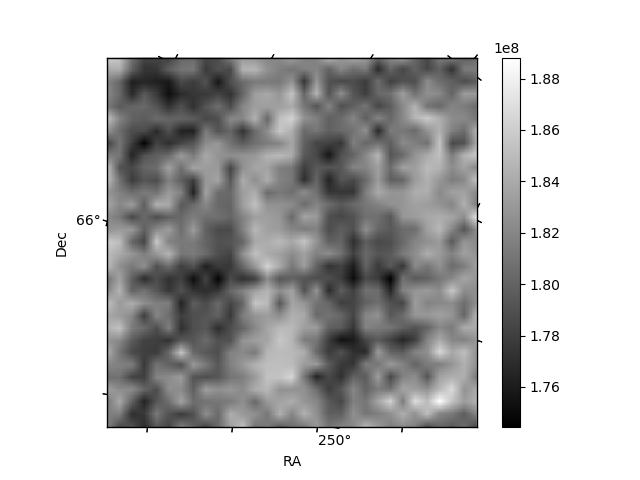
Histogram calculated using DETX and DETY for each event in the final _common_clean file
| Quadrant A | 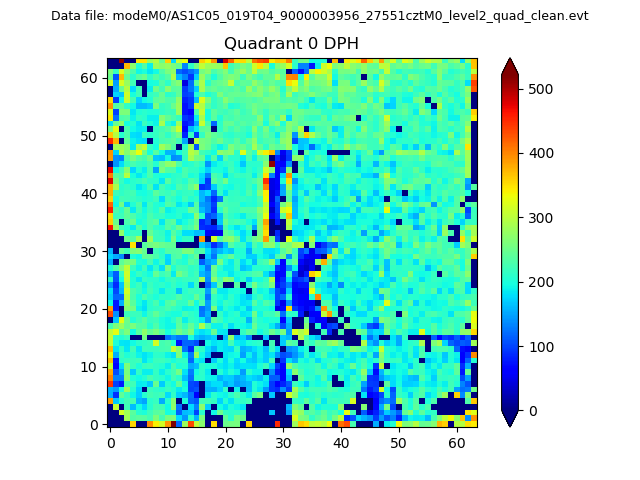 |
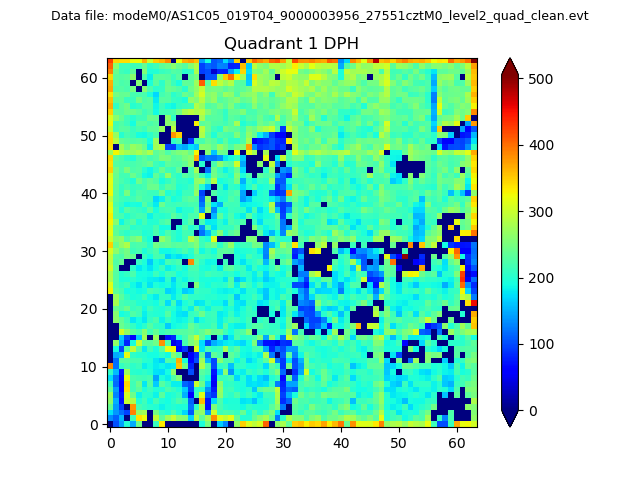 |
Quadrant B |
|---|---|---|---|
| Quadrant D | 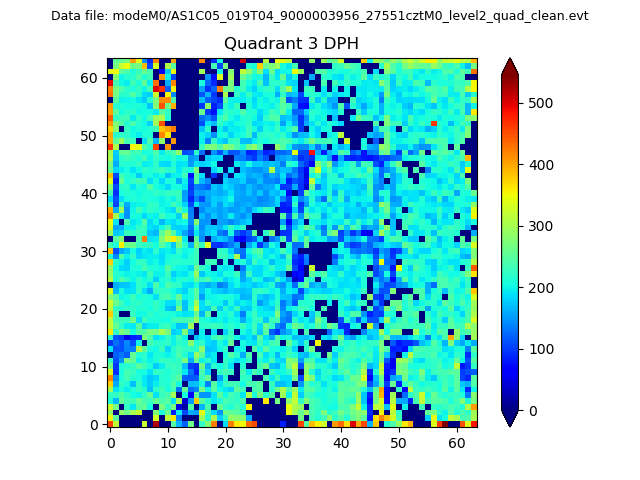 |
 |
Quadrant C |
| Plot type | Count rate plots | Images |
|---|---|---|
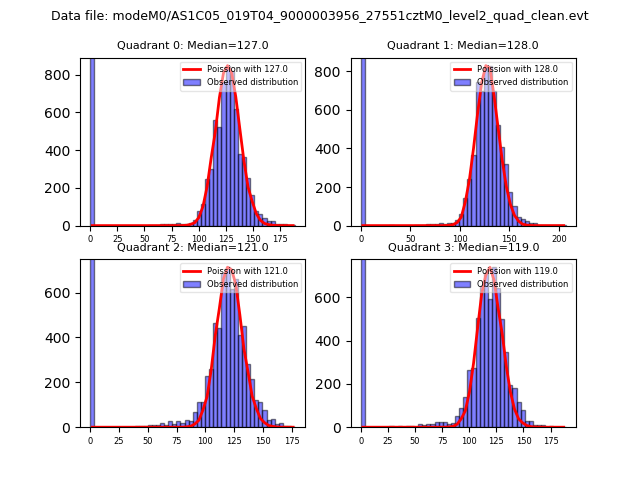
| Comparison with Poisson distribution Blue bars denote a histogram of data divided into 1 sec bins. Red curve is a Poisson curve with rate = median count rate of data. |
 |
 |
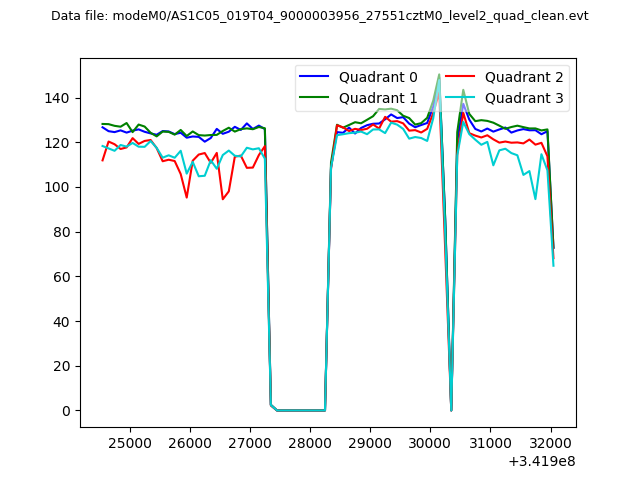
| Quadrant-wise count rates Data is divided into 100 sec bins |
 |
|
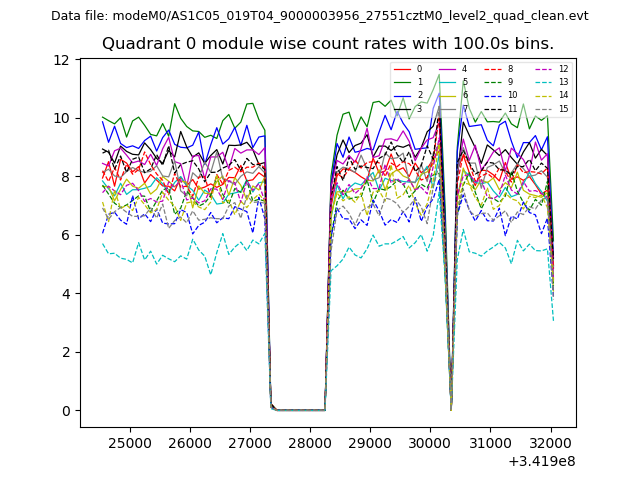
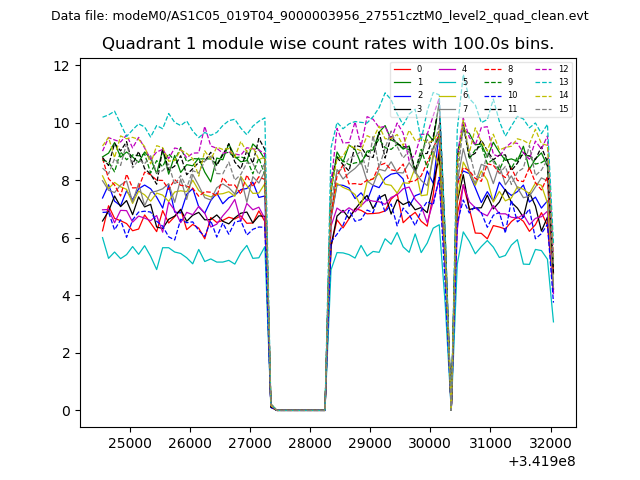
| Module-wise count rates for Quadrant A Data is divided into 100 sec bins |
 |
 |
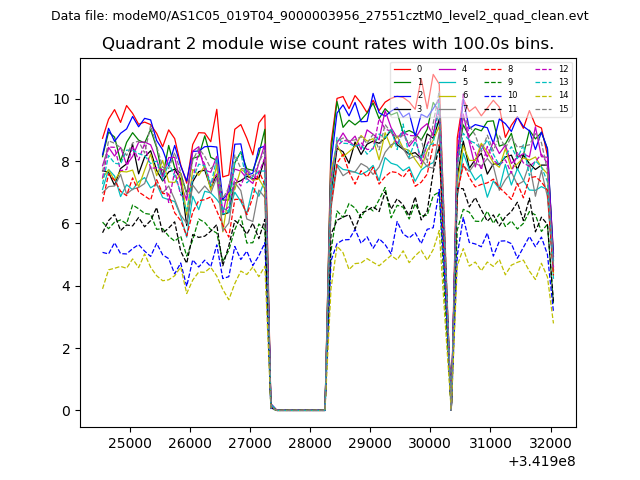
| Module-wise count rates for Quadrant B Data is divided into 100 sec bins |
 |
 |
| Module-wise count rates for Quadrant C Data is divided into 100 sec bins |
 |
 |
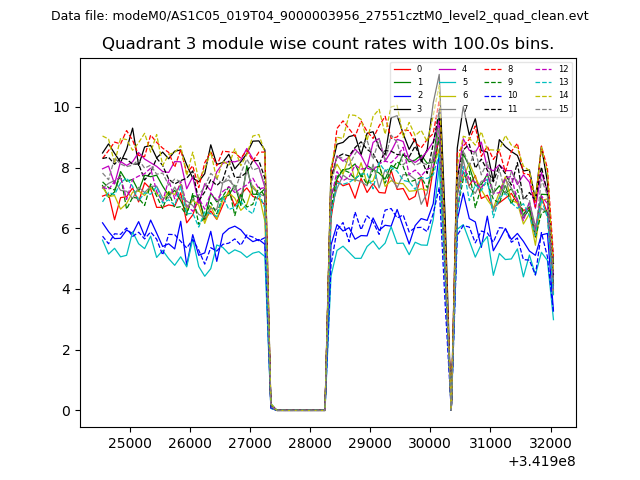
| Module-wise count rates for Quadrant D Data is divided into 100 sec bins |
 |
 |
| Parameter | Plot |
|---|---|
| CZT HV Monitor | 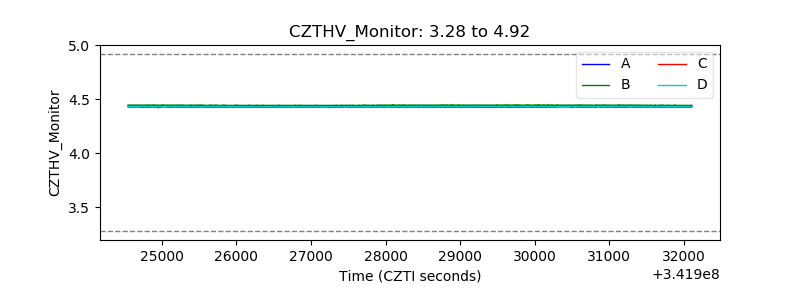 |
| D_VDD | 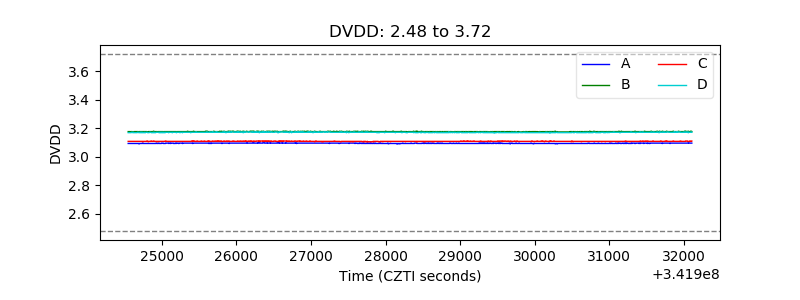 |
| Temperature 1 | 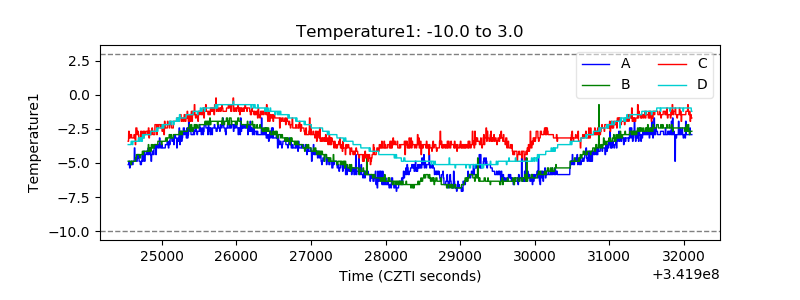 |
| Veto HV Monitor | 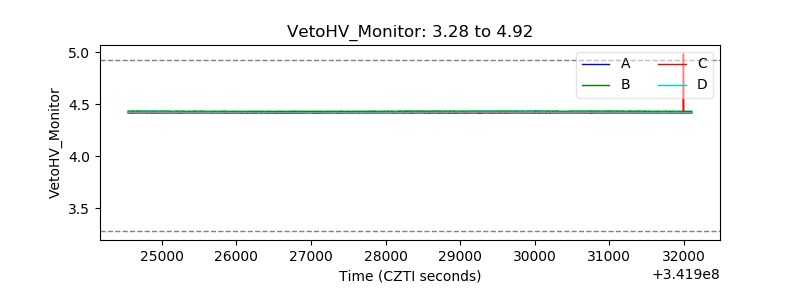 |
| Veto LLD | 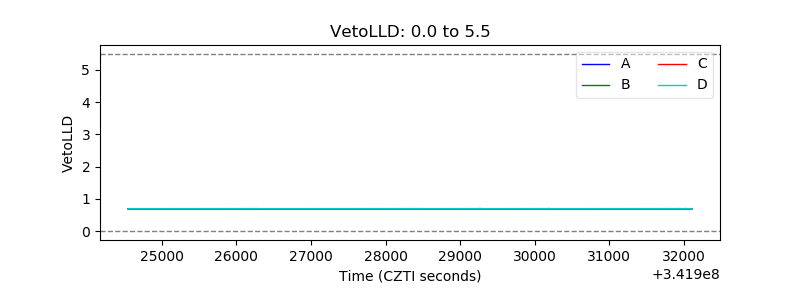 |
| Alpha Counter | 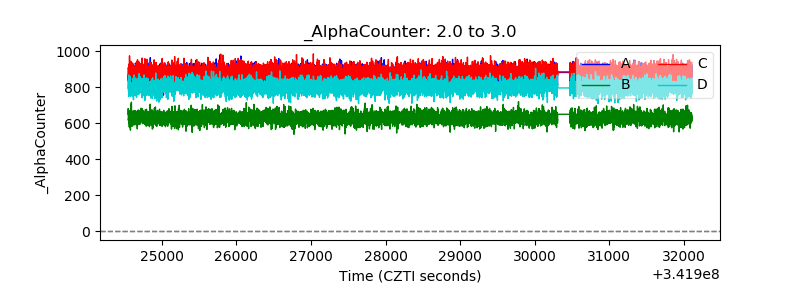 |
| _CPM_Rate | 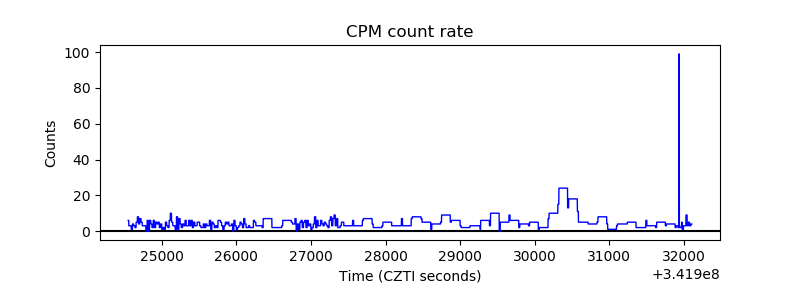 |
| CZT Counter | 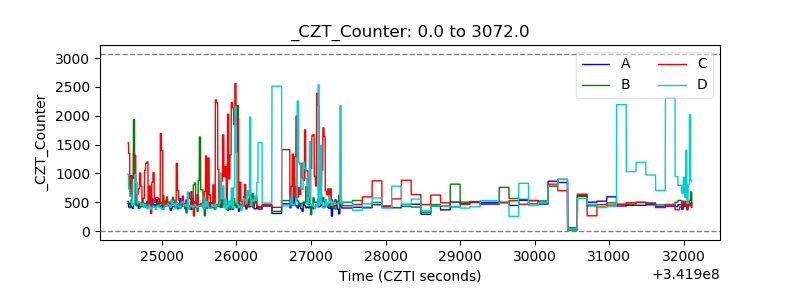 |
| +2.5 Volts monitor |  |
| +5 Volts monitor |  |
| _ROLL_ROT | 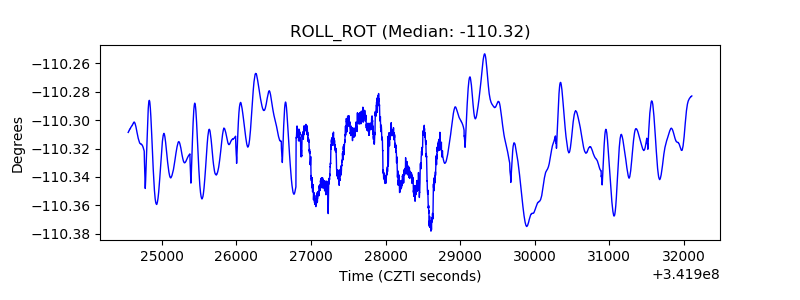 |
| _Roll_DEC | 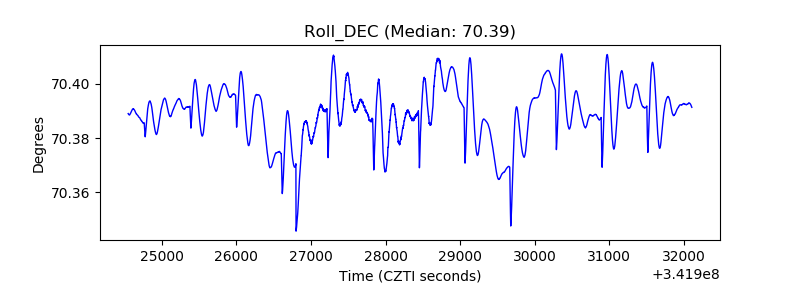 |
| _Roll_RA | 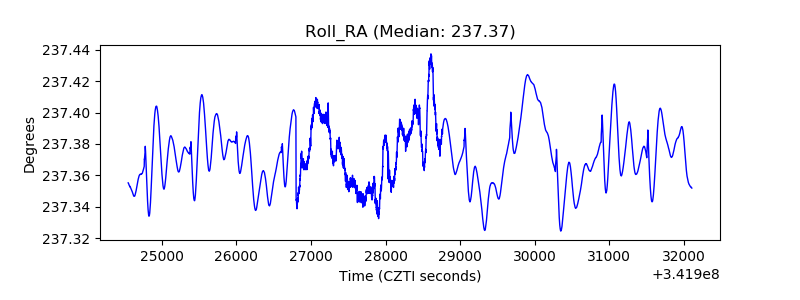 |
| Veto Counter | 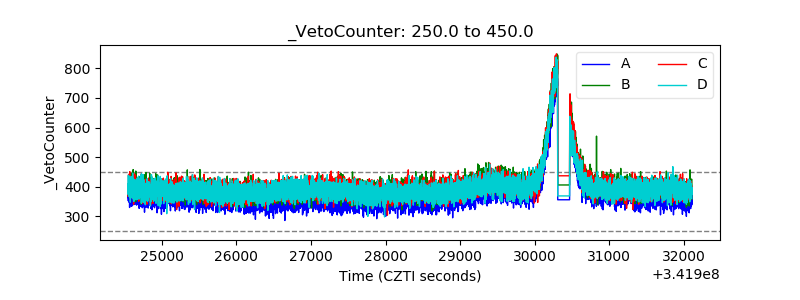 |