| Param | Original file | Final file |
|---|---|---|
| Filename | modeM0/AS1C05_019T04_9000003956_27554cztM0_level2.evt | modeM0/AS1C05_019T04_9000003956_27554cztM0_level2_quad_clean.evt |
| Size (bytes) | 1,811,318,400 | 370,926,720 |
| Size | 1.7 GB | 353.7 MB |
| Events in quadrant A | 10,874,158 | 2,473,229 |
| Events in quadrant B | 12,354,224 | 2,485,421 |
| Events in quadrant C | 12,827,116 | 2,374,446 |
| Events in quadrant D | 17,203,118 | 2,273,361 |
| Mode M9 | |||
|---|---|---|---|
| Quadrant | BADHDUFLAG | Total packets | Discarded packets |
| A | 0 | 20 | 0 |
| B | 0 | 20 | 0 |
| C | 0 | 20 | 0 |
| D | 0 | 20 | 0 |
| Mode M0 | |||
|---|---|---|---|
| Quadrant | BADHDUFLAG | Total packets | Discarded packets |
| A | 0 | 48138 | 0 |
| B | 0 | 52088 | 0 |
| C | 0 | 53335 | 0 |
| D | 0 | 66931 | 0 |
| Quadrant | Total seconds | Saturated seconds | Saturation percentage |
|---|---|---|---|
| A | 23660 | 188 | 0.794590% |
| B | 23661 | 482 | 2.037107% |
| C | 23661 | 709 | 2.996492% |
| D | 23661 | 1608 | 6.795993% |
Noise dominated data is calculated using 1-second bins in cleaned event files. If a bin has >2000 counts, and if more than 50% of those come from <1% of pixels, then it is considered to be noise-dominated and hence unusable.
| Quadrant | # 1 sec bins | Bins with >0 counts | Bins with >2000 counts | High rate bins dominated by noise | Noise dominated (total time) | Noise dominated (detector-on time) | Marked lightcurve |
|---|---|---|---|---|---|---|---|
| A | 25775 | 23661 | 0 | 0 | 0.00% | 0.00% | 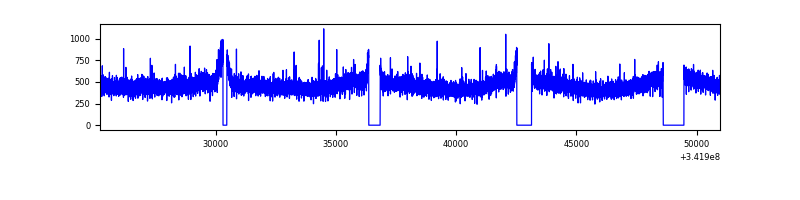 |
| B | 25776 | 23662 | 175 | 175 | 0.68% | 0.74% | 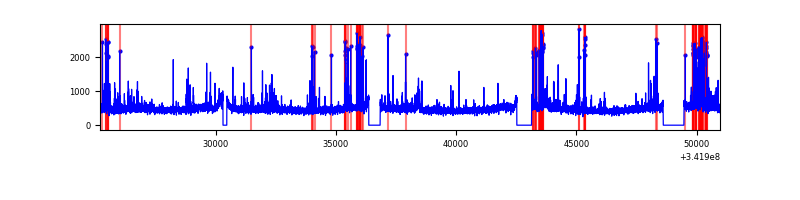 |
| C | 25776 | 23661 | 263 | 263 | 1.02% | 1.11% | 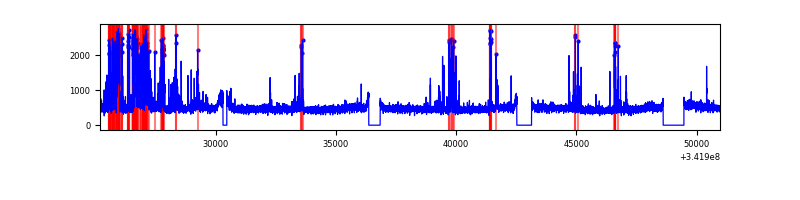 |
| D | 25776 | 23662 | 1202 | 1202 | 4.66% | 5.08% | 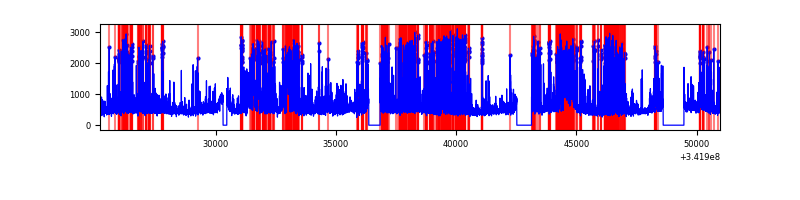 |
Top three noisy pixels from each quadrant. If the there are fewer than three noisy pixels in the level2.evt file, extra rows are filled as -1
| Pixel properties | Quadrant properties | ||||||
|---|---|---|---|---|---|---|---|
| Quadrant | DetID | PixID | Counts | Sigma | Mean | Median | Sigma |
| A | 13 | 254 | 38637 | 63.81 | 2817 | 2754 | 562.3 |
| A | 3 | 137 | 27851 | 44.63 | 2817 | 2754 | 562.3 |
| A | 0 | 226 | 23703 | 37.25 | 2817 | 2754 | 562.3 |
| B | 10 | 245 | 1065359 | 2015.38 | 2786 | 2710 | 527.3 |
| B | 15 | 32 | 166693 | 311.0 | 2786 | 2710 | 527.3 |
| B | 3 | 64 | 119174 | 220.88 | 2786 | 2710 | 527.3 |
| C | 7 | 221 | 1445835 | 2287.03 | 2701 | 2713 | 631.0 |
| C | 14 | 238 | 435238 | 685.46 | 2701 | 2713 | 631.0 |
| C | 2 | 16 | 284518 | 446.6 | 2701 | 2713 | 631.0 |
| D | 1 | 52 | 6520004 | 10171.45 | 2676 | 2597 | 640.8 |
| D | 2 | 250 | 379417 | 588.09 | 2676 | 2597 | 640.8 |
| D | 2 | 234 | 108915 | 165.93 | 2676 | 2597 | 640.8 |
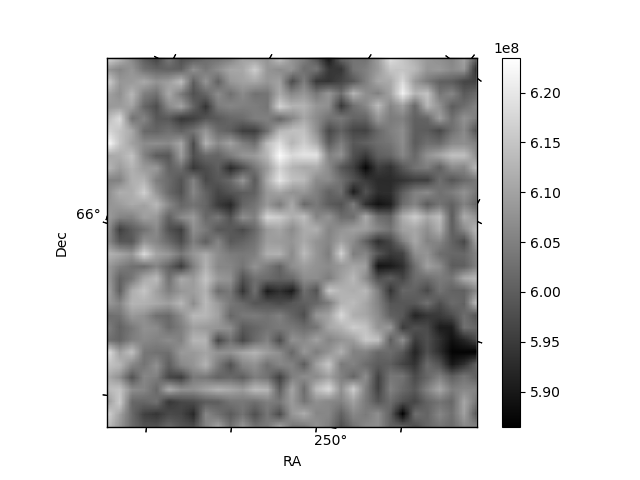
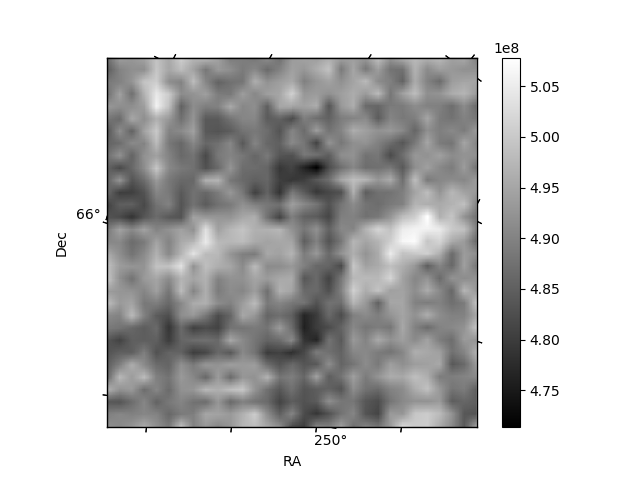
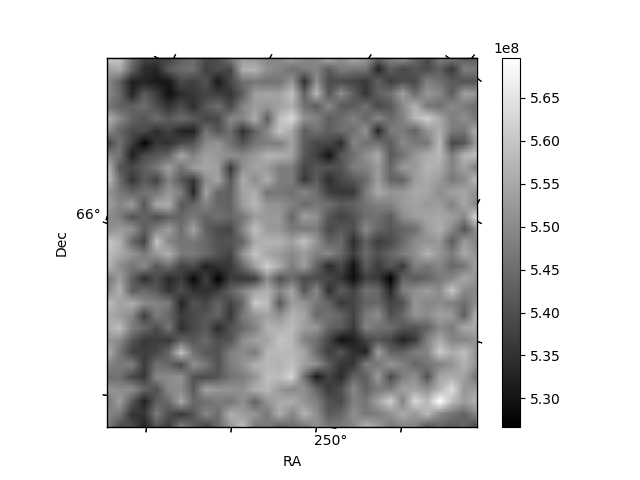
Histogram calculated using DETX and DETY for each event in the final _common_clean file
| Quadrant A | 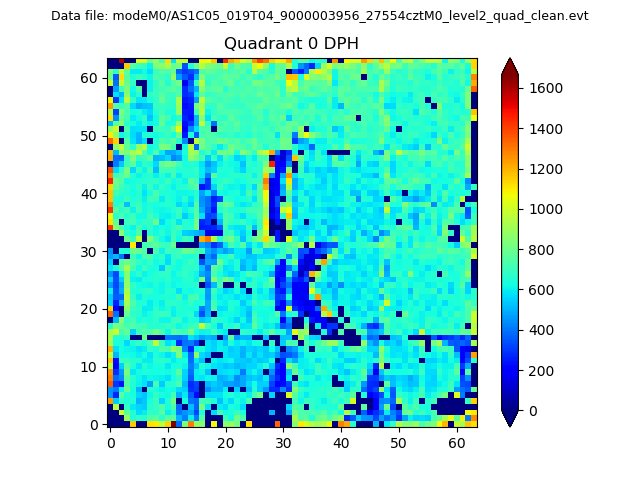 |
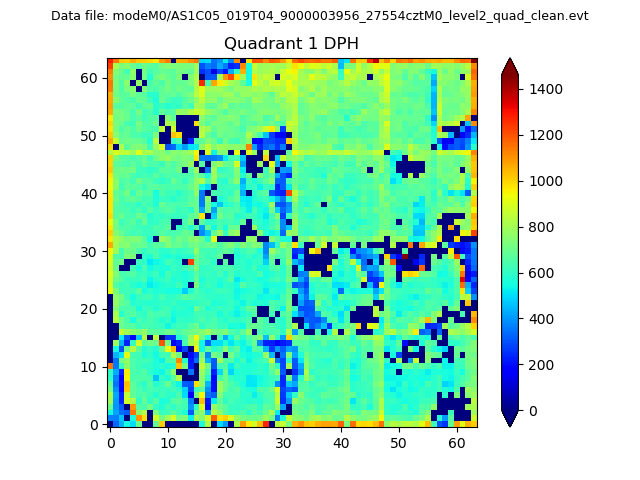 |
Quadrant B |
|---|---|---|---|
| Quadrant D | 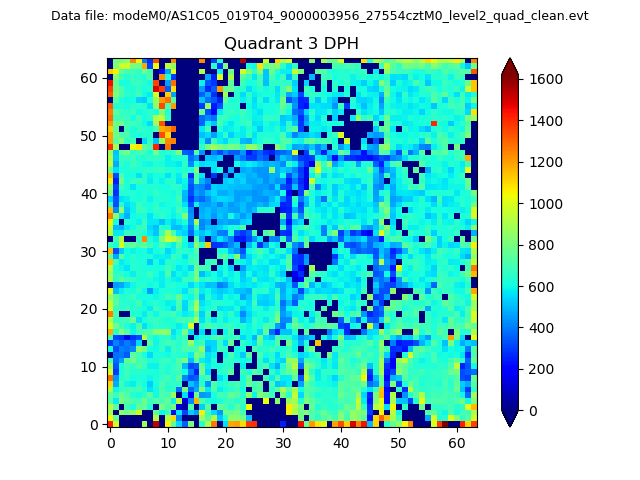 |
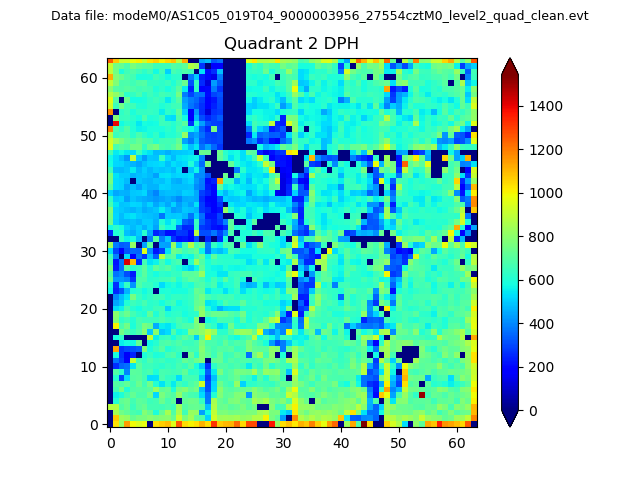 |
Quadrant C |
| Plot type | Count rate plots | Images |
|---|---|---|
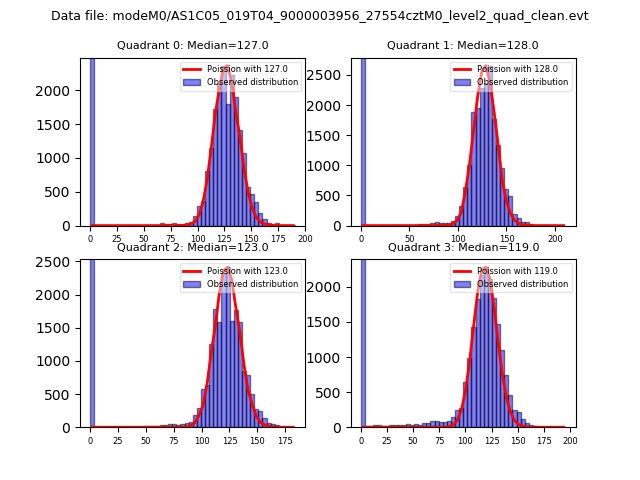
| Comparison with Poisson distribution Blue bars denote a histogram of data divided into 1 sec bins. Red curve is a Poisson curve with rate = median count rate of data. |
 |
 |
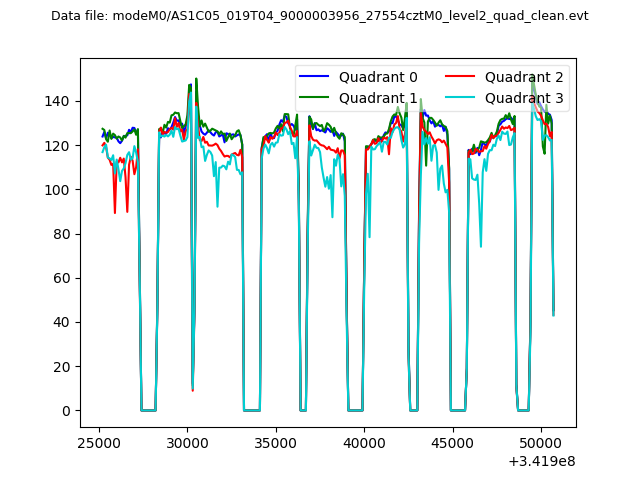
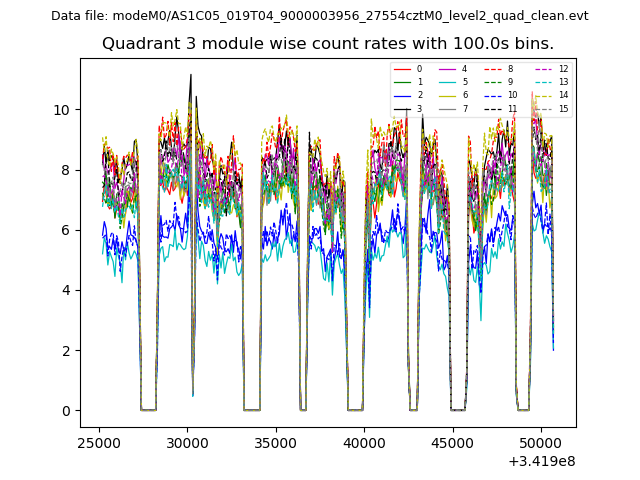
| Quadrant-wise count rates Data is divided into 100 sec bins |
 |
|
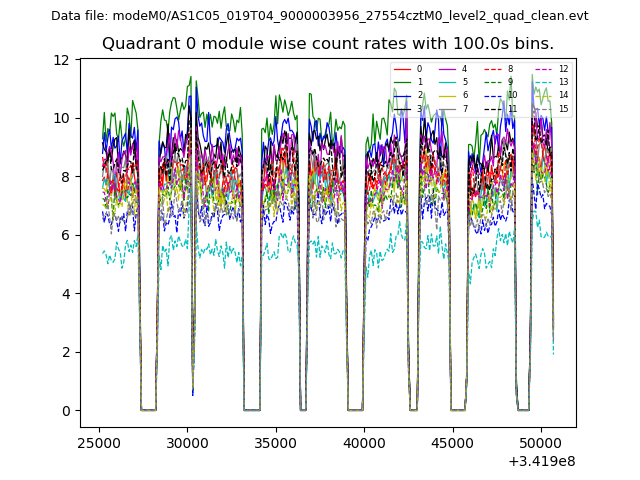
| Module-wise count rates for Quadrant A Data is divided into 100 sec bins |
 |
 |
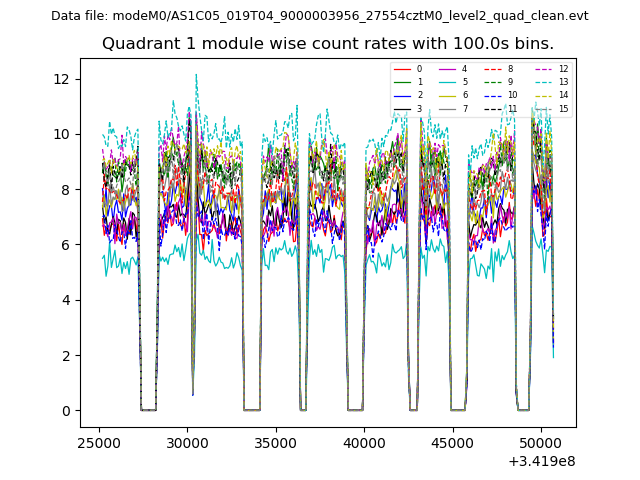
| Module-wise count rates for Quadrant B Data is divided into 100 sec bins |
 |
 |
| Module-wise count rates for Quadrant C Data is divided into 100 sec bins |
 |
 |
| Module-wise count rates for Quadrant D Data is divided into 100 sec bins |
 |
 |
| Parameter | Plot |
|---|---|
| CZT HV Monitor | 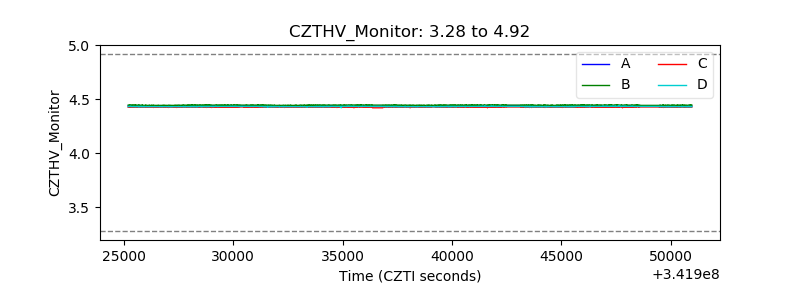 |
| D_VDD | 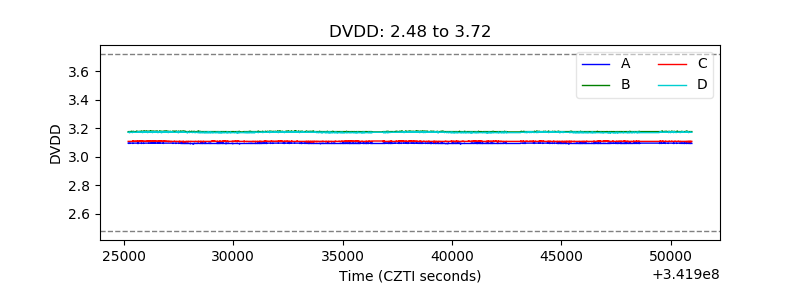 |
| Temperature 1 | 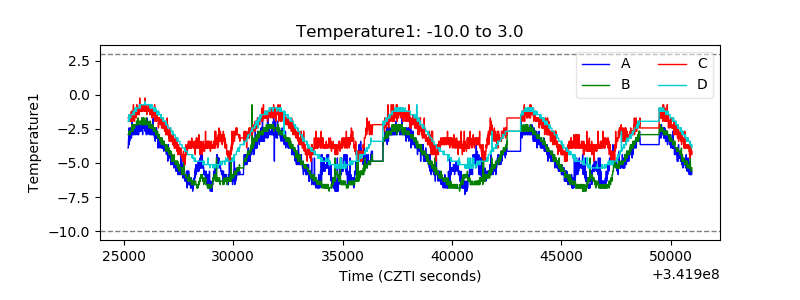 |
| Veto HV Monitor | 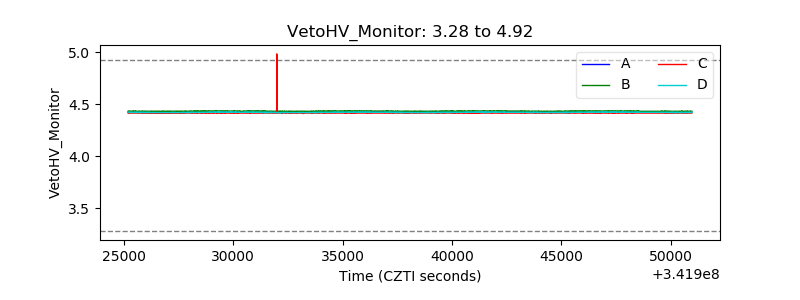 |
| Veto LLD | 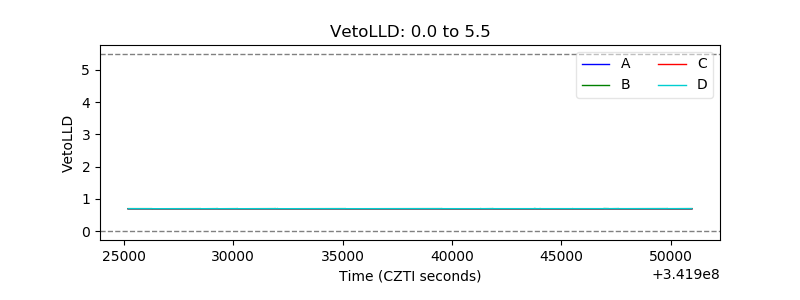 |
| Alpha Counter | 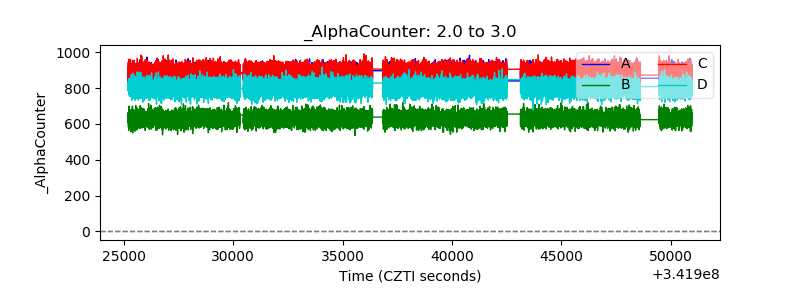 |
| _CPM_Rate | 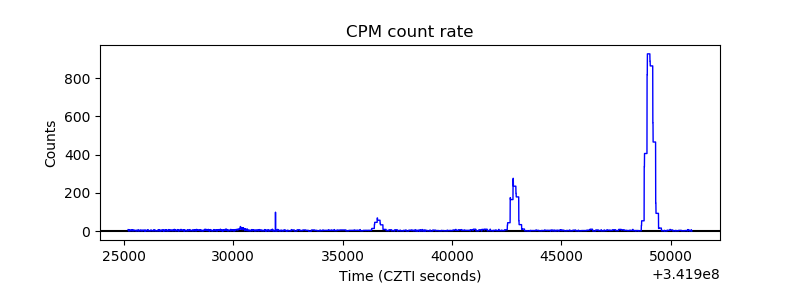 |
| CZT Counter | 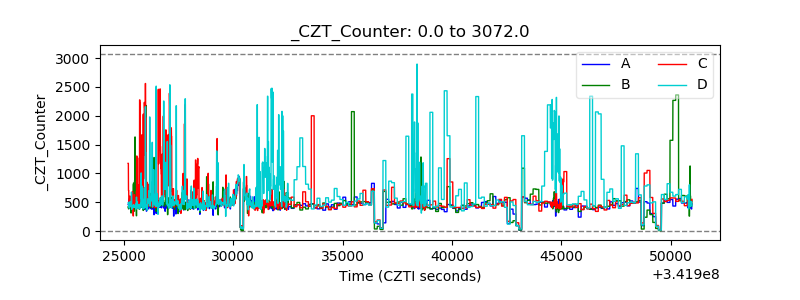 |
| +2.5 Volts monitor |  |
| +5 Volts monitor |  |
| _ROLL_ROT | 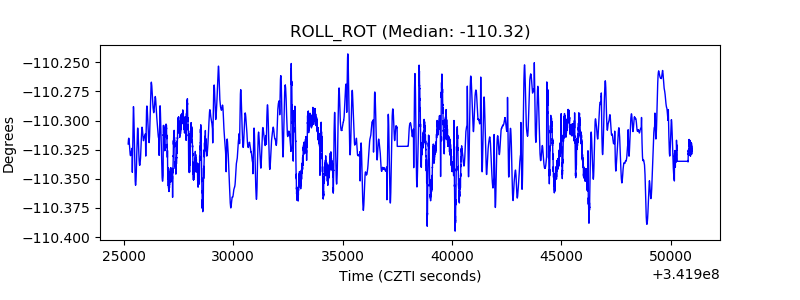 |
| _Roll_DEC | 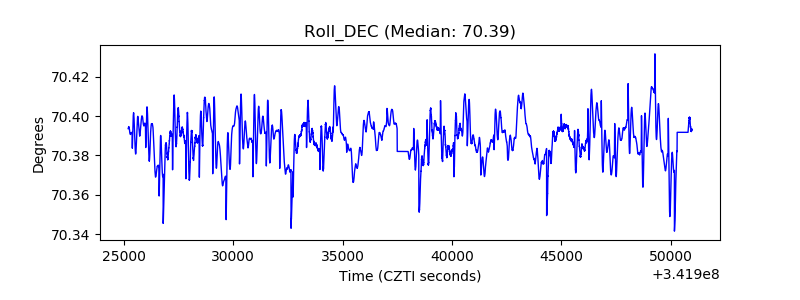 |
| _Roll_RA |  |
| Veto Counter | 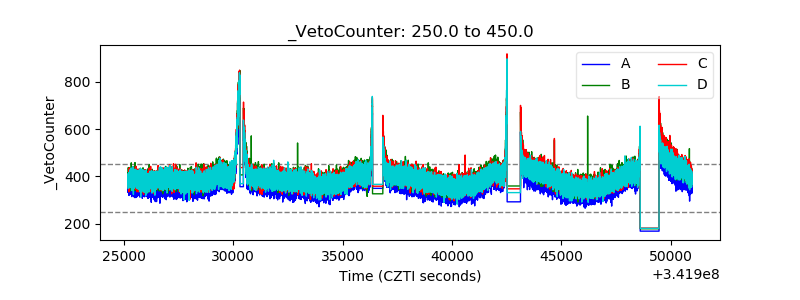 |