| Param | Original file | Final file |
|---|---|---|
| Filename | modeM0/AS1C05_019T04_9000003956_27555cztM0_level2.evt | modeM0/AS1C05_019T04_9000003956_27555cztM0_level2_quad_clean.evt |
| Size (bytes) | 474,359,040 | 102,827,520 |
| Size | 452.4 MB | 98.1 MB |
| Events in quadrant A | 3,105,169 | 673,398 |
| Events in quadrant B | 3,679,613 | 678,952 |
| Events in quadrant C | 3,225,657 | 660,487 |
| Events in quadrant D | 3,905,543 | 639,486 |
| Mode M9 | |||
|---|---|---|---|
| Quadrant | BADHDUFLAG | Total packets | Discarded packets |
| A | 0 | 10 | 0 |
| B | 0 | 11 | 0 |
| C | 0 | 11 | 0 |
| D | 0 | 11 | 0 |
| Mode M0 | |||
|---|---|---|---|
| Quadrant | BADHDUFLAG | Total packets | Discarded packets |
| A | 0 | 13597 | 0 |
| B | 0 | 15291 | 0 |
| C | 0 | 13864 | 0 |
| D | 0 | 16203 | 0 |
| Quadrant | Total seconds | Saturated seconds | Saturation percentage |
|---|---|---|---|
| A | 6617 | 29 | 0.438265% |
| B | 6617 | 173 | 2.614478% |
| C | 6617 | 83 | 1.254345% |
| D | 6617 | 162 | 2.448239% |
Noise dominated data is calculated using 1-second bins in cleaned event files. If a bin has >2000 counts, and if more than 50% of those come from <1% of pixels, then it is considered to be noise-dominated and hence unusable.
| Quadrant | # 1 sec bins | Bins with >0 counts | Bins with >2000 counts | High rate bins dominated by noise | Noise dominated (total time) | Noise dominated (detector-on time) | Marked lightcurve |
|---|---|---|---|---|---|---|---|
| A | 7627 | 6617 | 0 | 0 | 0.00% | 0.00% | 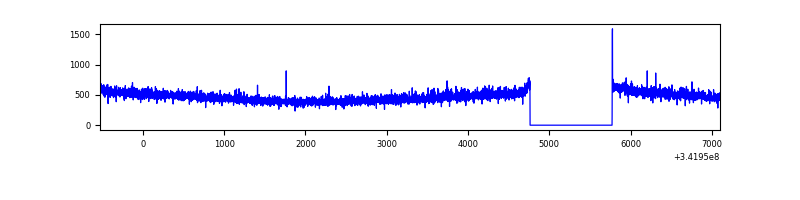 |
| B | 7627 | 6617 | 98 | 98 | 1.28% | 1.48% | 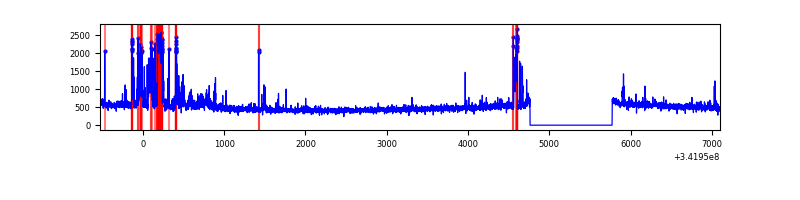 |
| C | 7627 | 6617 | 4 | 4 | 0.05% | 0.06% | 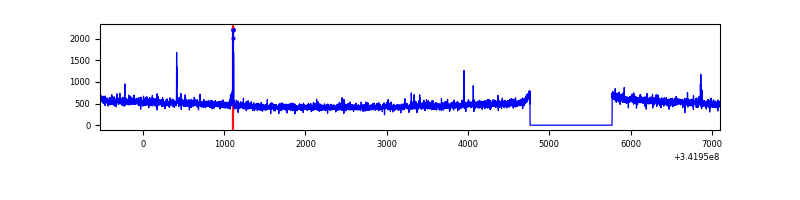 |
| D | 7627 | 6617 | 95 | 95 | 1.25% | 1.44% | 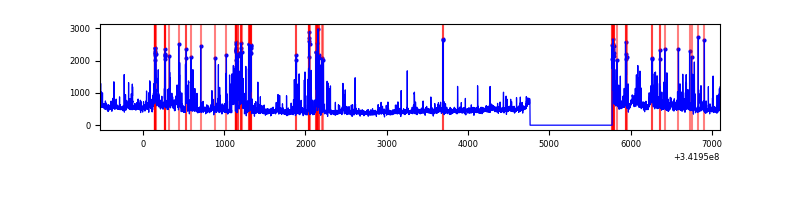 |
Top three noisy pixels from each quadrant. If the there are fewer than three noisy pixels in the level2.evt file, extra rows are filled as -1
| Pixel properties | Quadrant properties | ||||||
|---|---|---|---|---|---|---|---|
| Quadrant | DetID | PixID | Counts | Sigma | Mean | Median | Sigma |
| A | 13 | 254 | 10824 | 62.2 | 802 | 784 | 161.4 |
| A | 3 | 137 | 7933 | 44.29 | 802 | 784 | 161.4 |
| A | 10 | 67 | 6866 | 37.68 | 802 | 784 | 161.4 |
| B | 10 | 245 | 521081 | 3432.32 | 797 | 776 | 151.6 |
| B | 12 | 111 | 18499 | 116.91 | 797 | 776 | 151.6 |
| B | 11 | 111 | 16855 | 106.07 | 797 | 776 | 151.6 |
| C | 14 | 238 | 124771 | 671.67 | 782 | 784 | 184.6 |
| C | 10 | 22 | 21429 | 111.84 | 782 | 784 | 184.6 |
| C | 7 | 221 | 19589 | 101.87 | 782 | 784 | 184.6 |
| D | 1 | 52 | 749385 | 4045.75 | 782 | 761 | 185.0 |
| D | 2 | 250 | 73165 | 391.29 | 782 | 761 | 185.0 |
| D | 12 | 233 | 43006 | 228.3 | 782 | 761 | 185.0 |
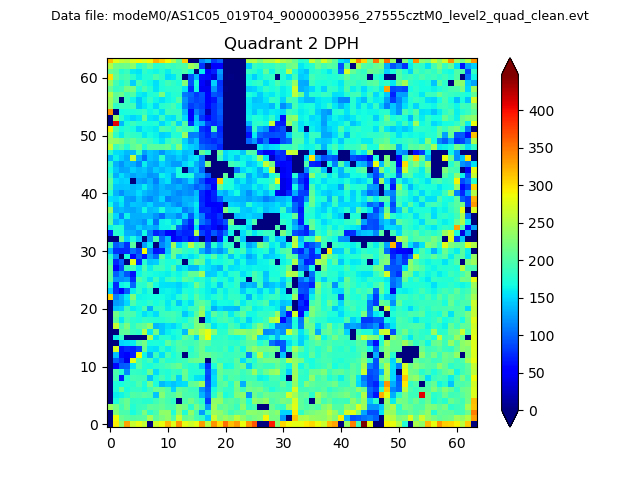
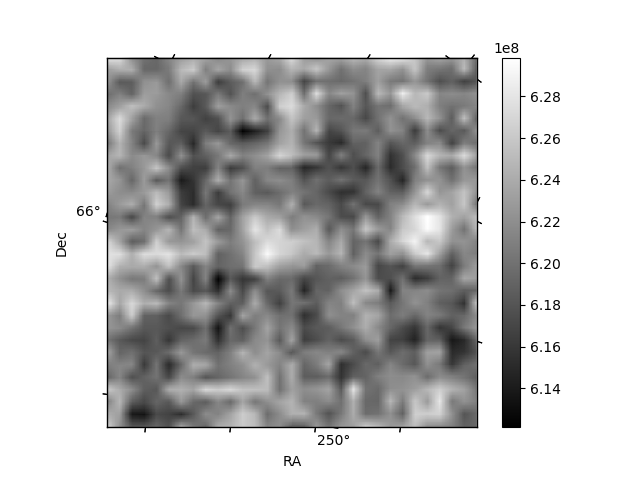
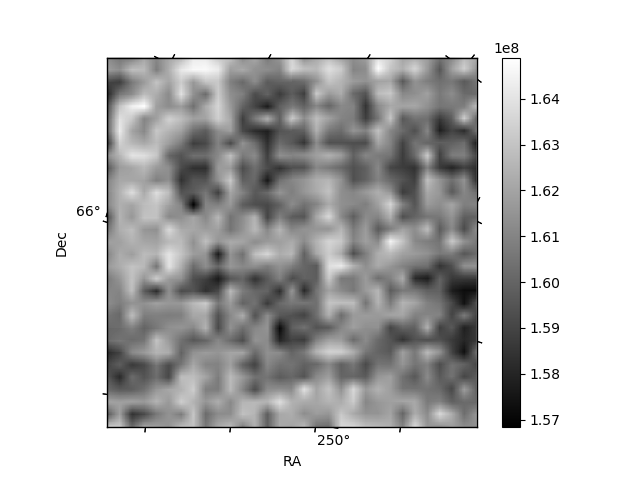
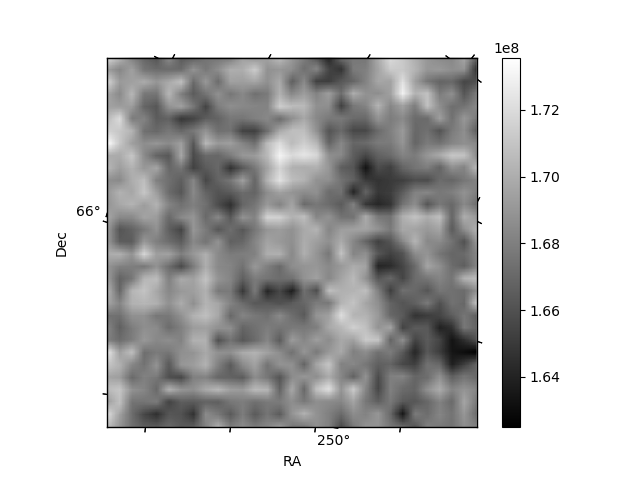
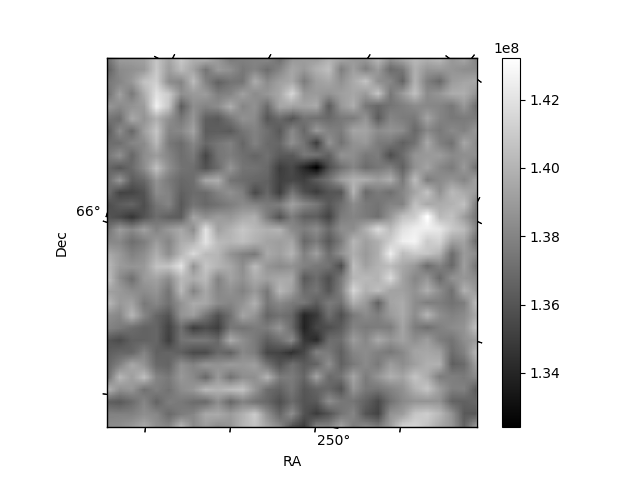
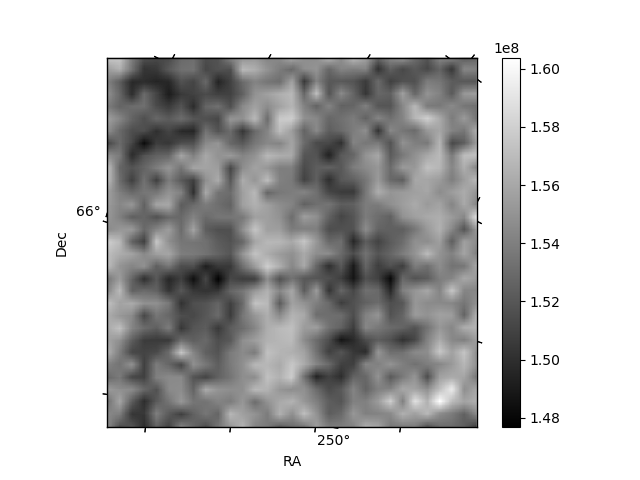
Histogram calculated using DETX and DETY for each event in the final _common_clean file
| Quadrant A | 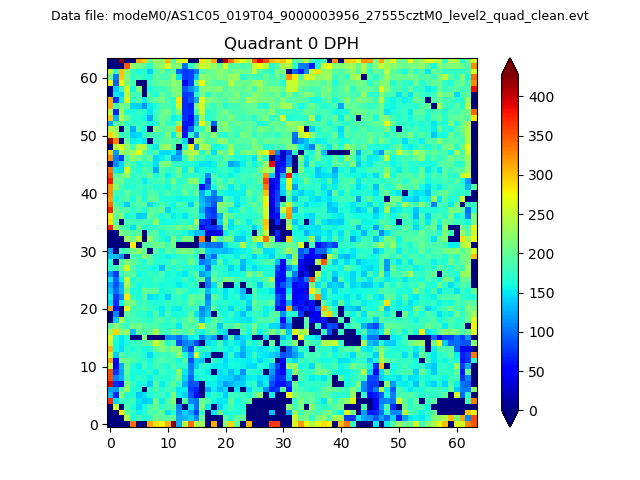 |
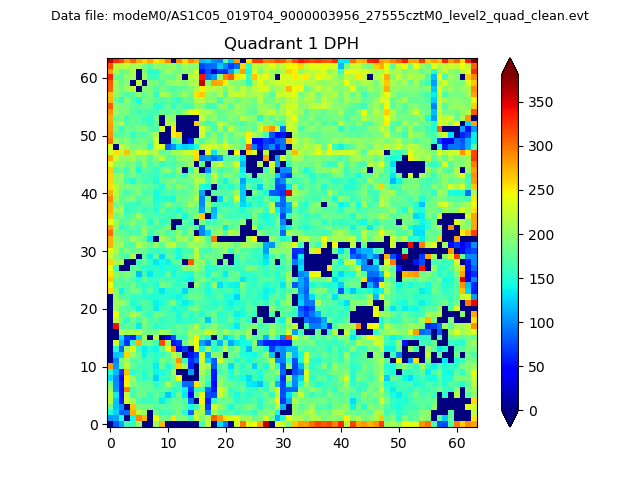 |
Quadrant B |
|---|---|---|---|
| Quadrant D | 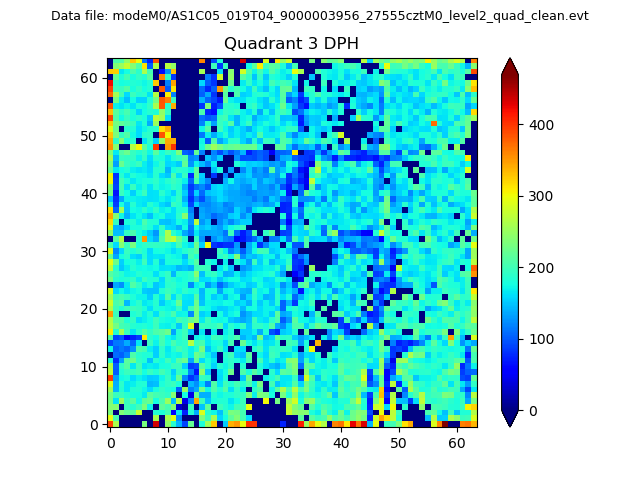 |
 |
Quadrant C |
| Plot type | Count rate plots | Images |
|---|---|---|
| Comparison with Poisson distribution Blue bars denote a histogram of data divided into 1 sec bins. Red curve is a Poisson curve with rate = median count rate of data. |
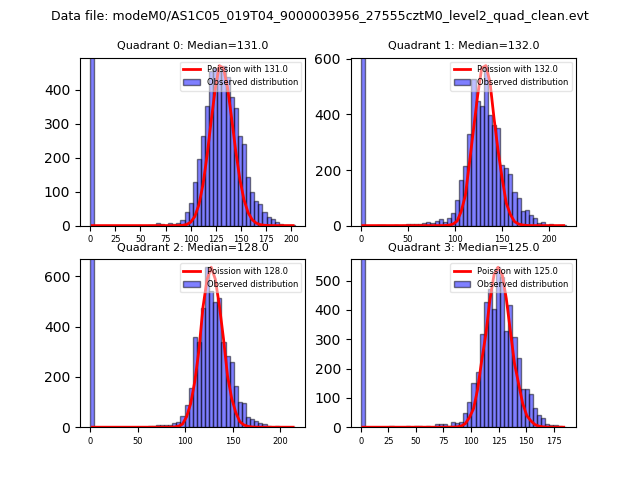 |
 |
| Quadrant-wise count rates Data is divided into 100 sec bins |
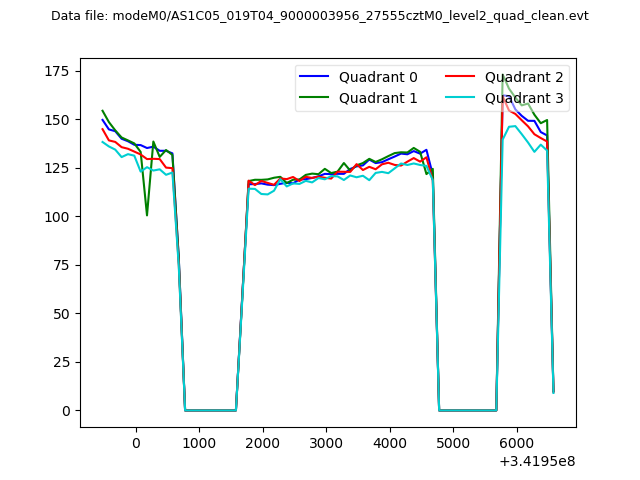 |
|
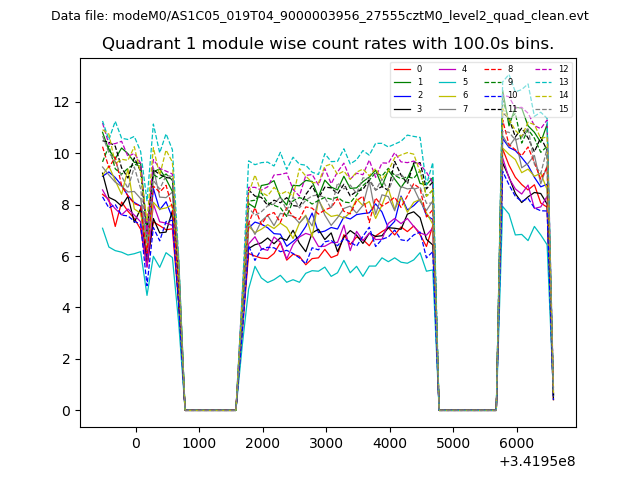
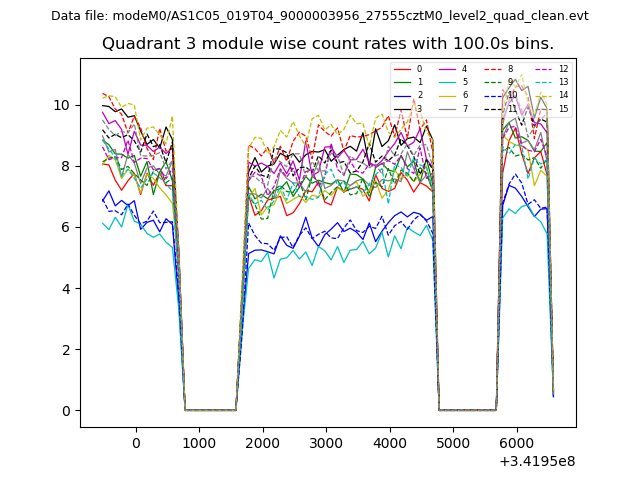
| Module-wise count rates for Quadrant A Data is divided into 100 sec bins |
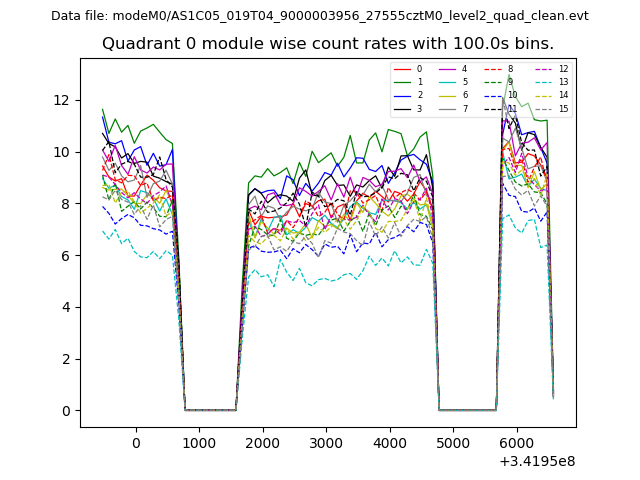 |
 |
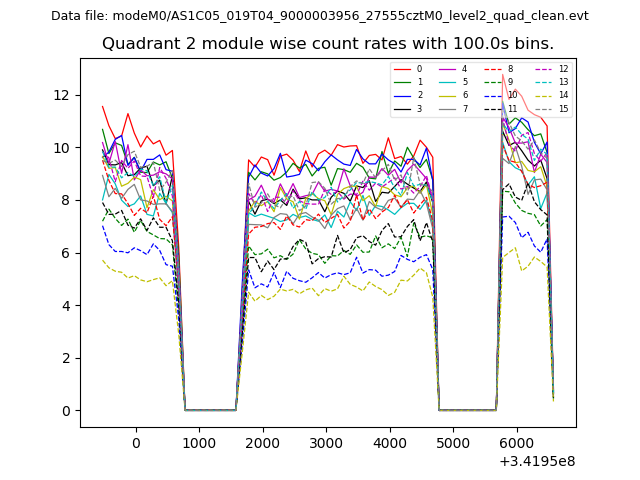
| Module-wise count rates for Quadrant B Data is divided into 100 sec bins |
 |
 |
| Module-wise count rates for Quadrant C Data is divided into 100 sec bins |
 |
 |
| Module-wise count rates for Quadrant D Data is divided into 100 sec bins |
 |
 |
| Parameter | Plot |
|---|---|
| CZT HV Monitor | 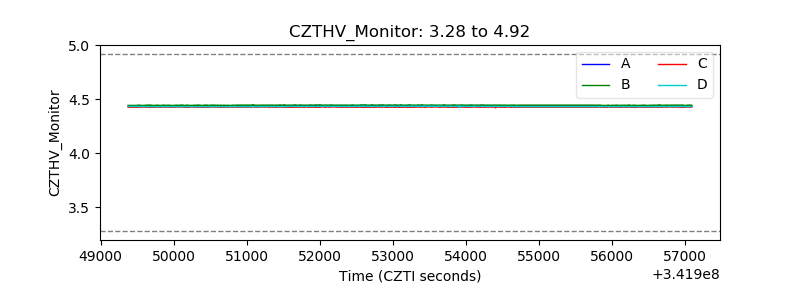 |
| D_VDD | 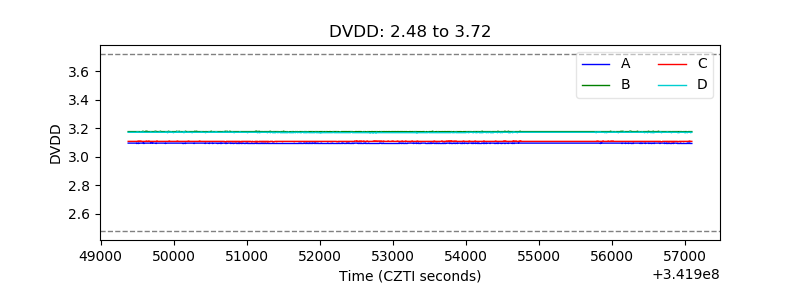 |
| Temperature 1 | 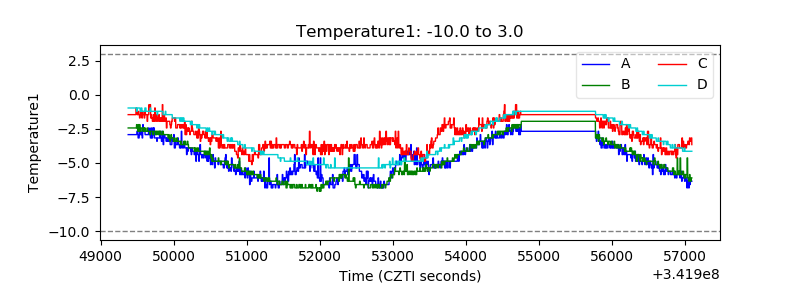 |
| Veto HV Monitor | 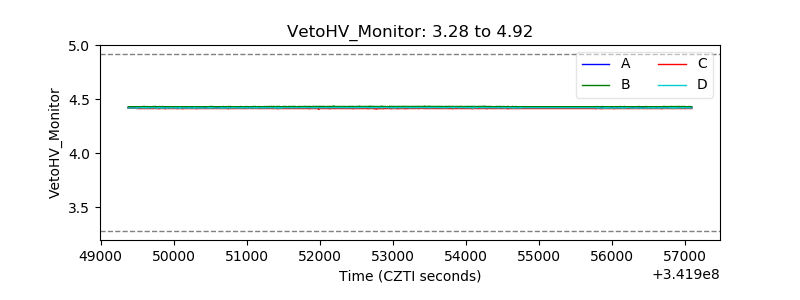 |
| Veto LLD | 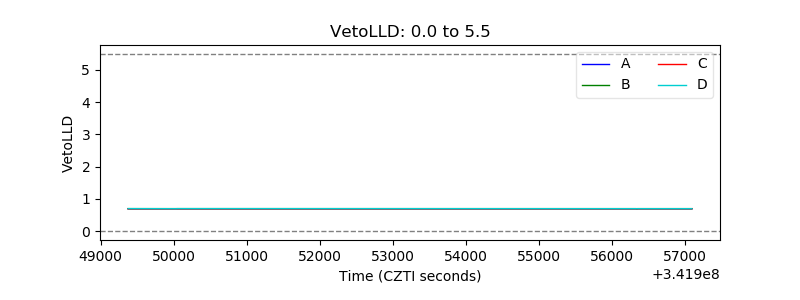 |
| Alpha Counter | 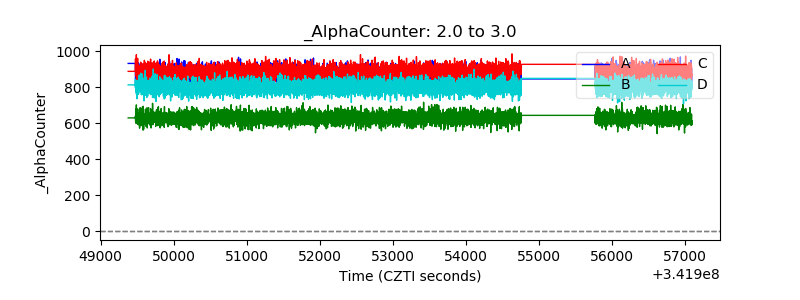 |
| _CPM_Rate | 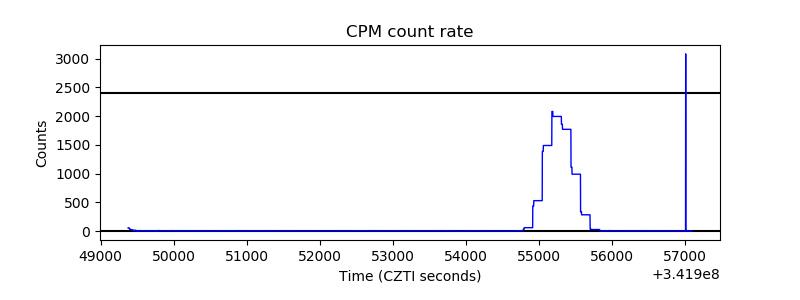 |
| CZT Counter | 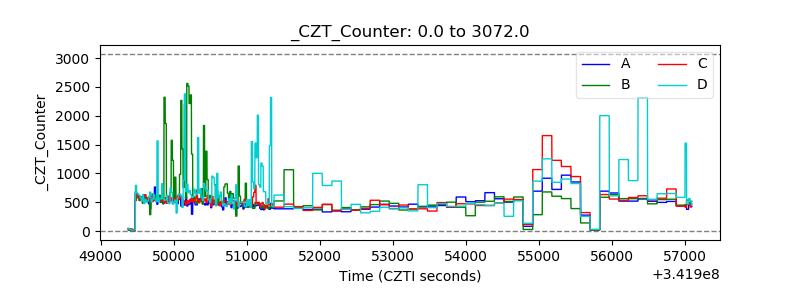 |
| +2.5 Volts monitor |  |
| +5 Volts monitor |  |
| _ROLL_ROT | 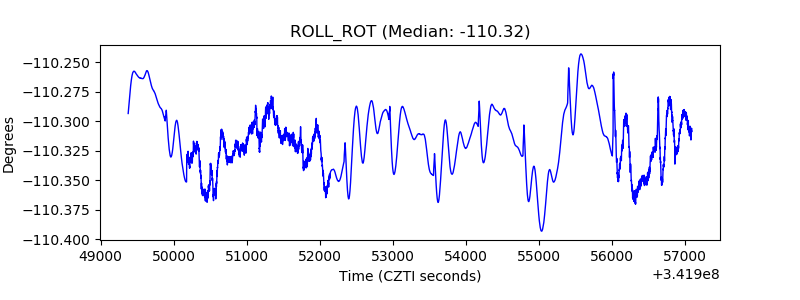 |
| _Roll_DEC | 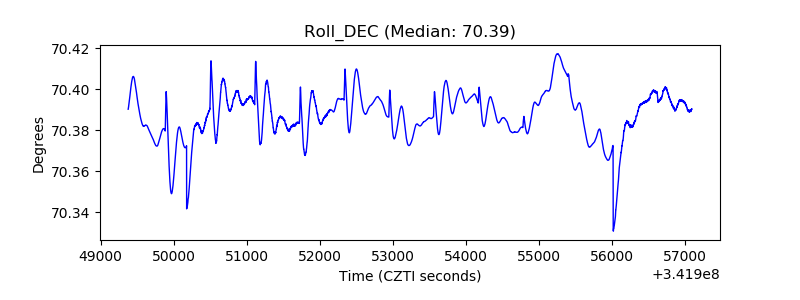 |
| _Roll_RA | 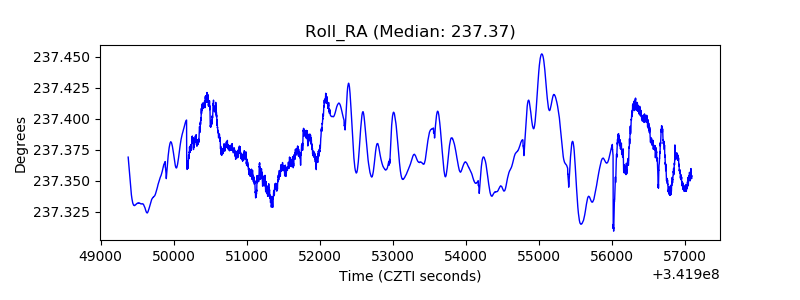 |
| Veto Counter | 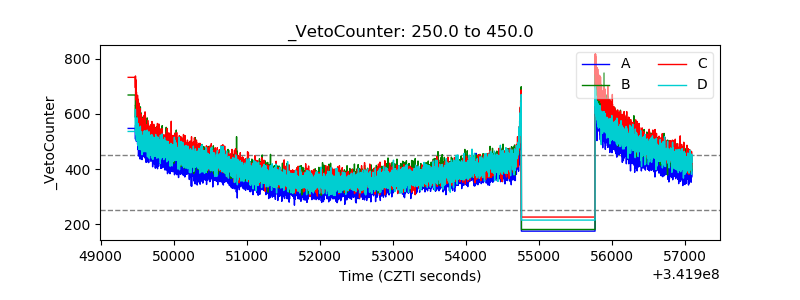 |