| Param | Original file | Final file |
|---|---|---|
| Filename | modeM0/AS1C05_019T04_9000003956_27557cztM0_level2.evt | modeM0/AS1C05_019T04_9000003956_27557cztM0_level2_quad_clean.evt |
| Size (bytes) | 580,959,360 | 95,987,520 |
| Size | 554.0 MB | 91.5 MB |
| Events in quadrant A | 3,194,508 | 635,637 |
| Events in quadrant B | 4,316,094 | 617,440 |
| Events in quadrant C | 3,325,043 | 630,503 |
| Events in quadrant D | 6,304,194 | 555,510 |
| Mode M9 | |||
|---|---|---|---|
| Quadrant | BADHDUFLAG | Total packets | Discarded packets |
| A | 0 | 11 | 0 |
| B | 0 | 12 | 0 |
| C | 0 | 12 | 0 |
| D | 0 | 12 | 0 |
| Mode M0 | |||
|---|---|---|---|
| Quadrant | BADHDUFLAG | Total packets | Discarded packets |
| A | 0 | 13977 | 0 |
| B | 0 | 17204 | 0 |
| C | 0 | 14315 | 0 |
| D | 0 | 23382 | 0 |
| Quadrant | Total seconds | Saturated seconds | Saturation percentage |
|---|---|---|---|
| A | 6697 | 24 | 0.358369% |
| B | 6697 | 452 | 6.749291% |
| C | 6697 | 77 | 1.149769% |
| D | 6697 | 1022 | 15.260564% |
Noise dominated data is calculated using 1-second bins in cleaned event files. If a bin has >2000 counts, and if more than 50% of those come from <1% of pixels, then it is considered to be noise-dominated and hence unusable.
| Quadrant | # 1 sec bins | Bins with >0 counts | Bins with >2000 counts | High rate bins dominated by noise | Noise dominated (total time) | Noise dominated (detector-on time) | Marked lightcurve |
|---|---|---|---|---|---|---|---|
| A | 7841 | 6696 | 0 | 0 | 0.00% | 0.00% | 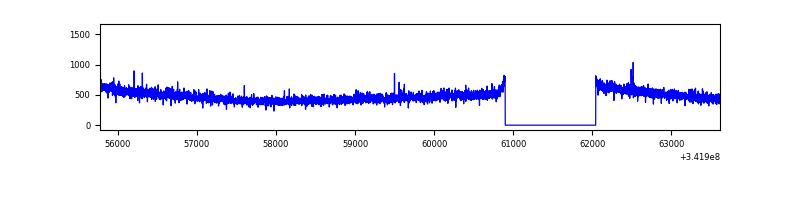 |
| B | 7842 | 6697 | 303 | 303 | 3.86% | 4.52% | 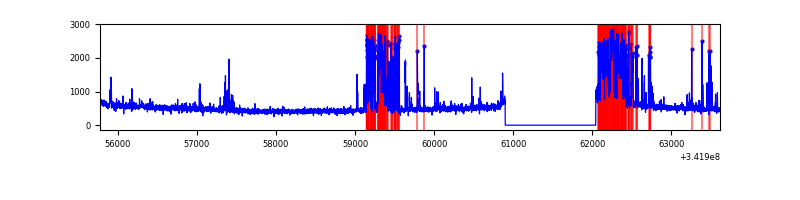 |
| C | 7842 | 6697 | 3 | 3 | 0.04% | 0.04% | 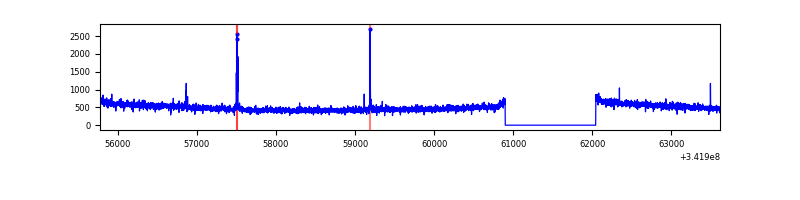 |
| D | 7841 | 6696 | 896 | 896 | 11.43% | 13.38% | 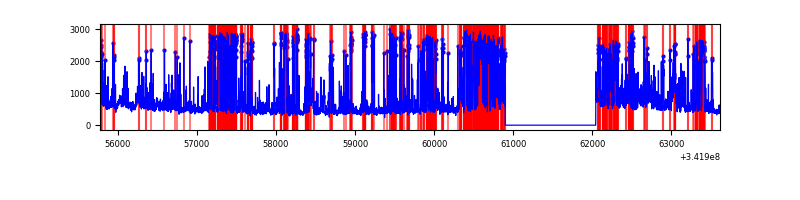 |
Top three noisy pixels from each quadrant. If the there are fewer than three noisy pixels in the level2.evt file, extra rows are filled as -1
| Pixel properties | Quadrant properties | ||||||
|---|---|---|---|---|---|---|---|
| Quadrant | DetID | PixID | Counts | Sigma | Mean | Median | Sigma |
| A | 13 | 254 | 10998 | 62.16 | 825 | 805 | 164.0 |
| A | 3 | 137 | 7853 | 42.98 | 825 | 805 | 164.0 |
| A | 0 | 226 | 6853 | 36.88 | 825 | 805 | 164.0 |
| B | 10 | 245 | 1158611 | 7704.37 | 798 | 777 | 150.3 |
| B | 12 | 111 | 18432 | 117.48 | 798 | 777 | 150.3 |
| B | 11 | 111 | 16738 | 106.21 | 798 | 777 | 150.3 |
| C | 14 | 238 | 130655 | 685.79 | 809 | 815 | 189.3 |
| C | 2 | 16 | 33810 | 174.27 | 809 | 815 | 189.3 |
| C | 15 | 208 | 5854 | 26.61 | 809 | 815 | 189.3 |
| D | 1 | 52 | 3302921 | 18672.49 | 748 | 728 | 176.8 |
| D | 2 | 250 | 81759 | 458.2 | 748 | 728 | 176.8 |
| D | 12 | 227 | 56412 | 314.87 | 748 | 728 | 176.8 |
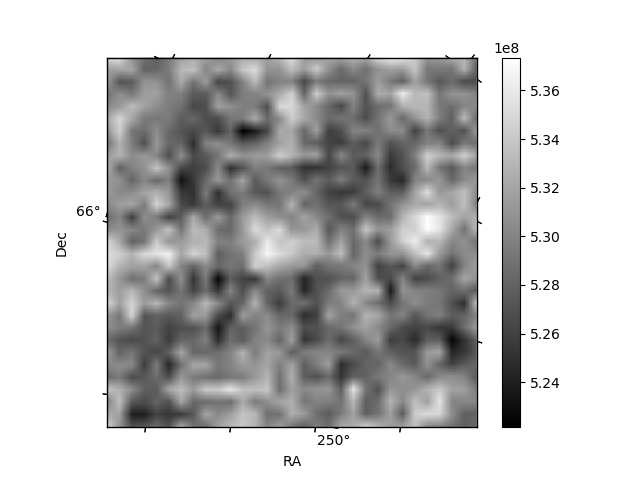
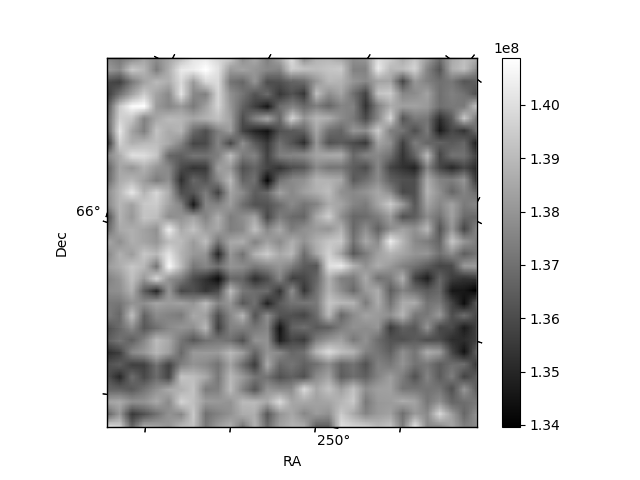
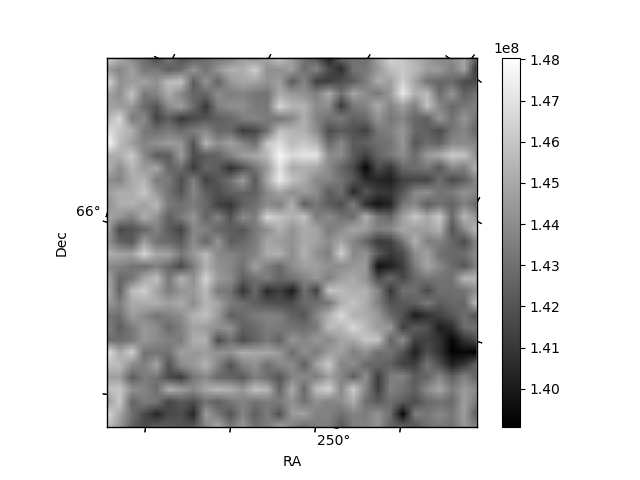
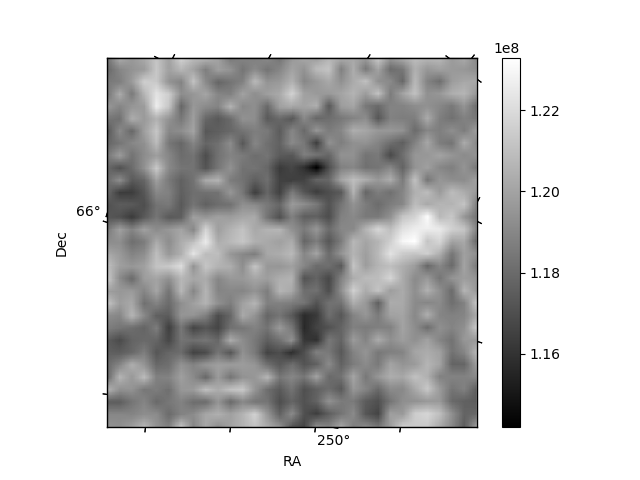
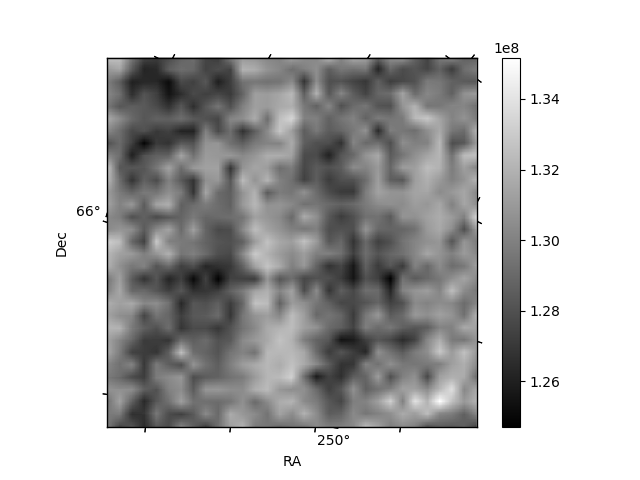
Histogram calculated using DETX and DETY for each event in the final _common_clean file
| Quadrant A | 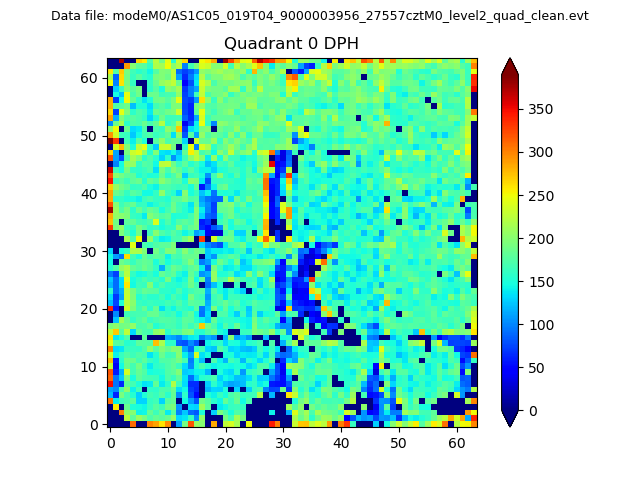 |
 |
Quadrant B |
|---|---|---|---|
| Quadrant D | 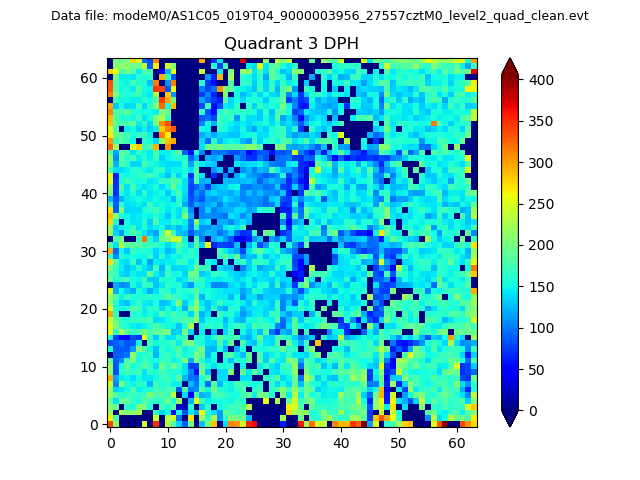 |
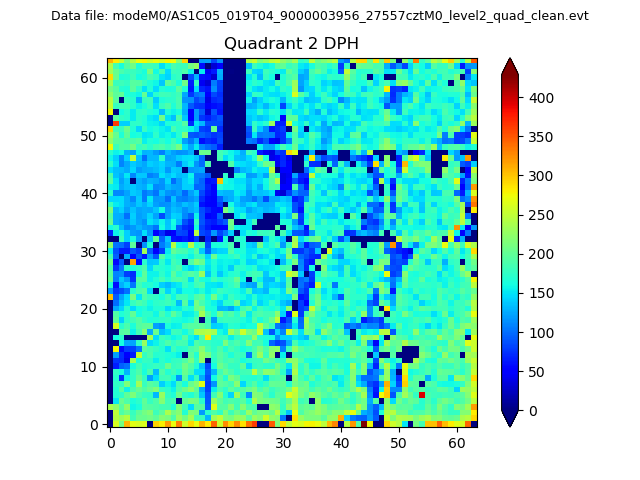 |
Quadrant C |
| Plot type | Count rate plots | Images |
|---|---|---|
| Comparison with Poisson distribution Blue bars denote a histogram of data divided into 1 sec bins. Red curve is a Poisson curve with rate = median count rate of data. |
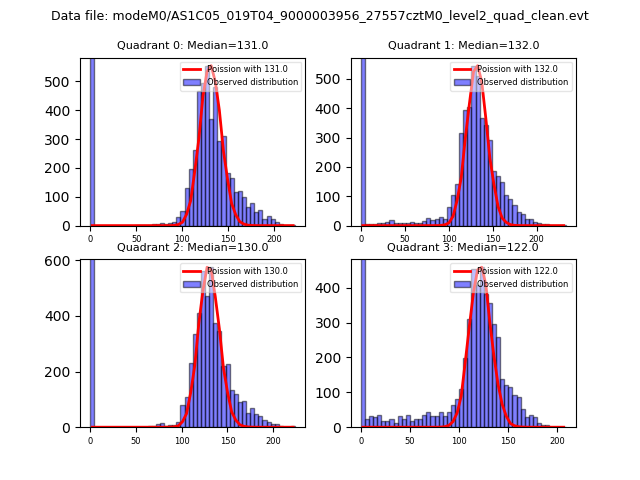 |
 |
| Quadrant-wise count rates Data is divided into 100 sec bins |
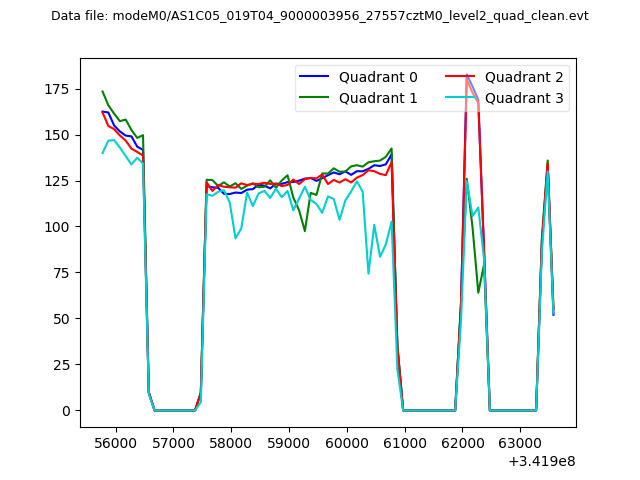 |
|
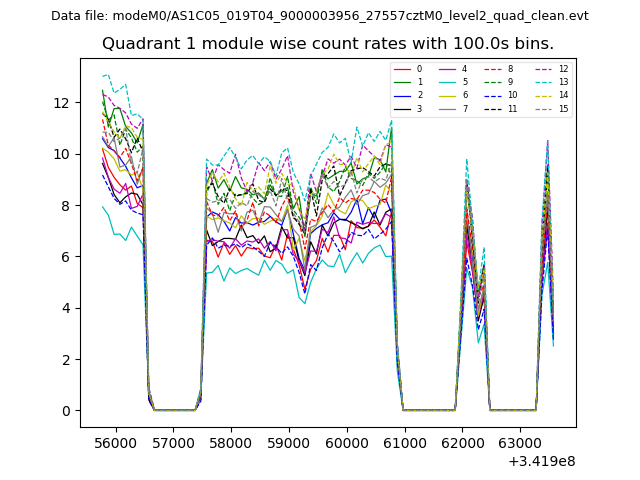
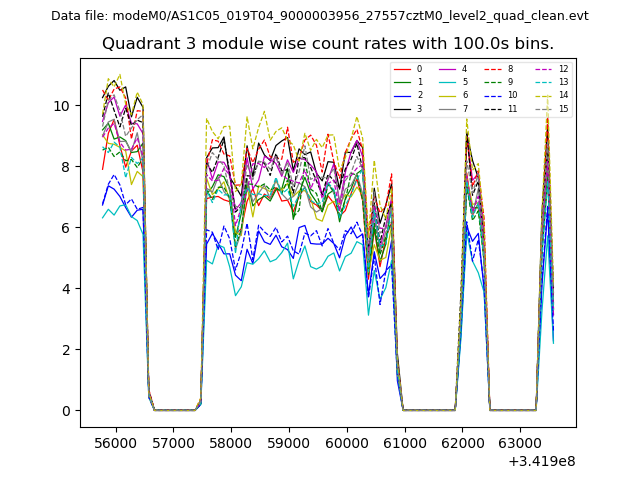
| Module-wise count rates for Quadrant A Data is divided into 100 sec bins |
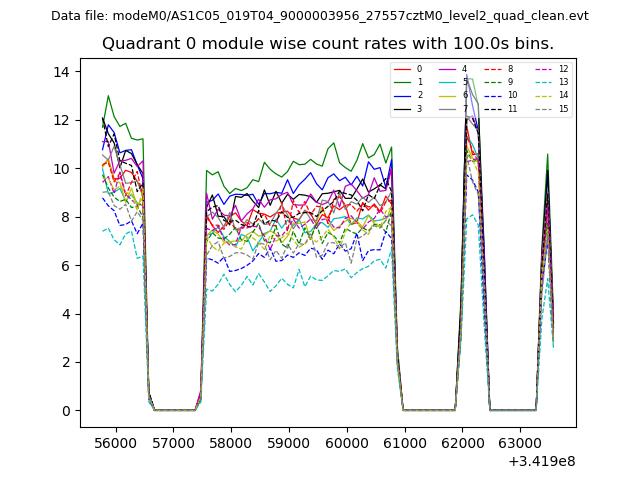 |
 |
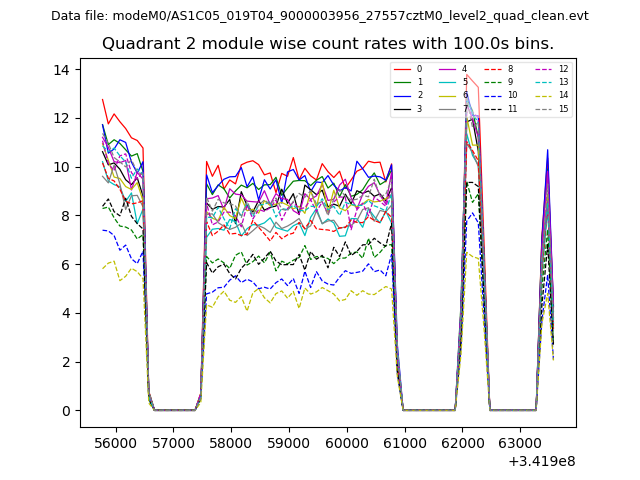
| Module-wise count rates for Quadrant B Data is divided into 100 sec bins |
 |
 |
| Module-wise count rates for Quadrant C Data is divided into 100 sec bins |
 |
 |
| Module-wise count rates for Quadrant D Data is divided into 100 sec bins |
 |
 |
| Parameter | Plot |
|---|---|
| CZT HV Monitor | 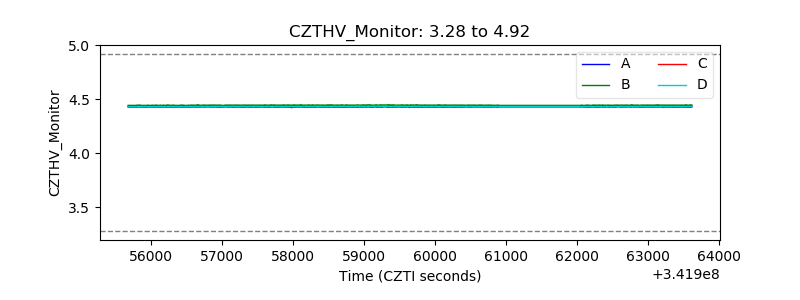 |
| D_VDD | 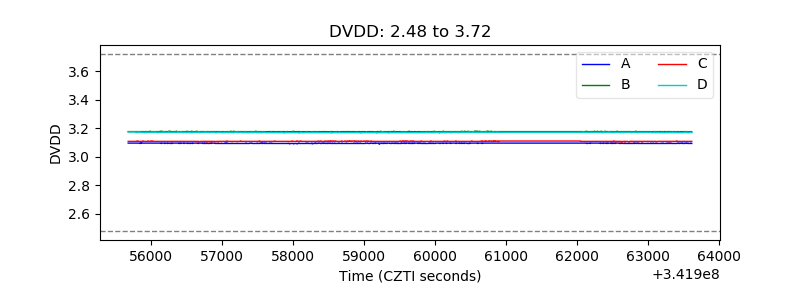 |
| Temperature 1 | 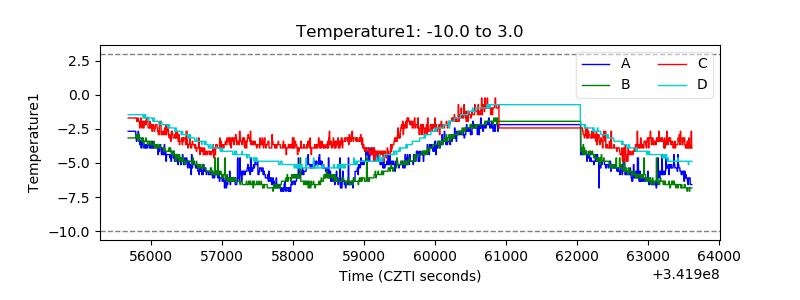 |
| Veto HV Monitor | 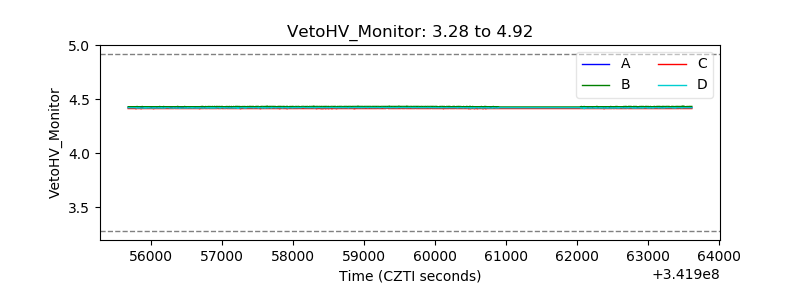 |
| Veto LLD | 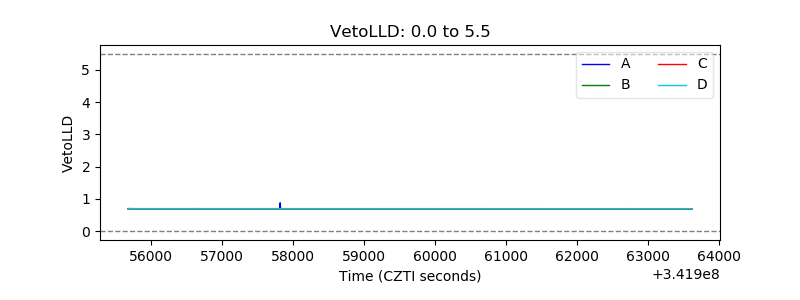 |
| Alpha Counter | 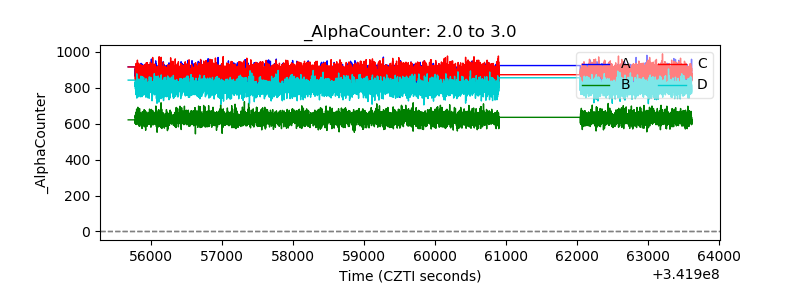 |
| _CPM_Rate |  |
| CZT Counter | 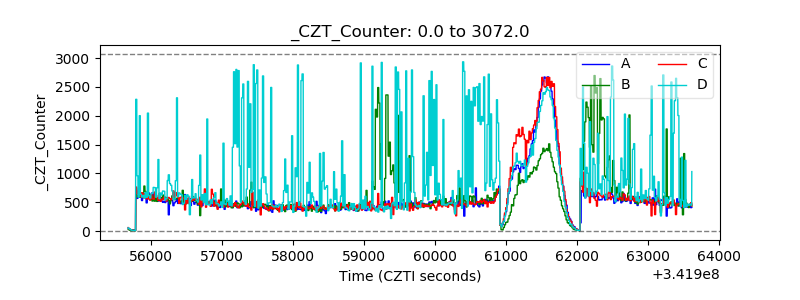 |
| +2.5 Volts monitor |  |
| +5 Volts monitor |  |
| _ROLL_ROT | 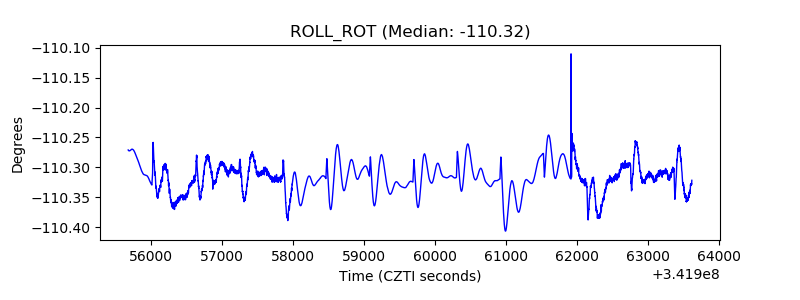 |
| _Roll_DEC | 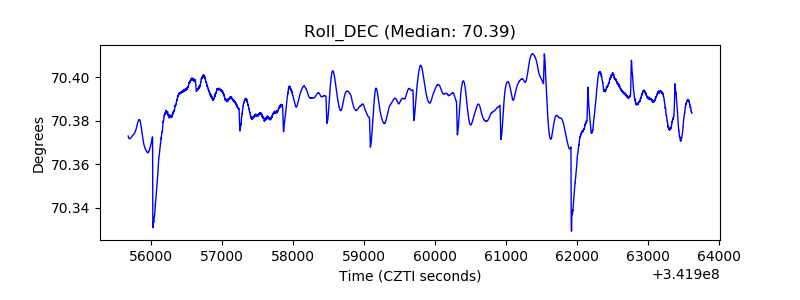 |
| _Roll_RA | 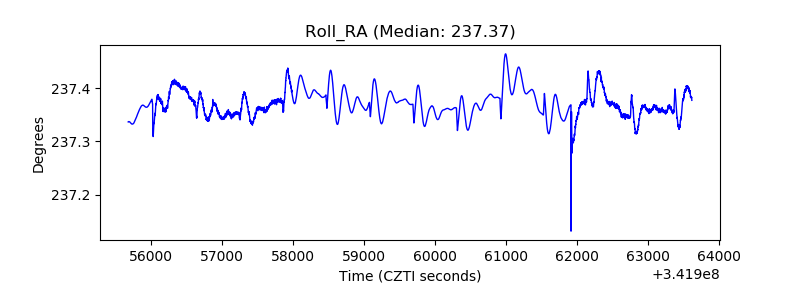 |
| Veto Counter | 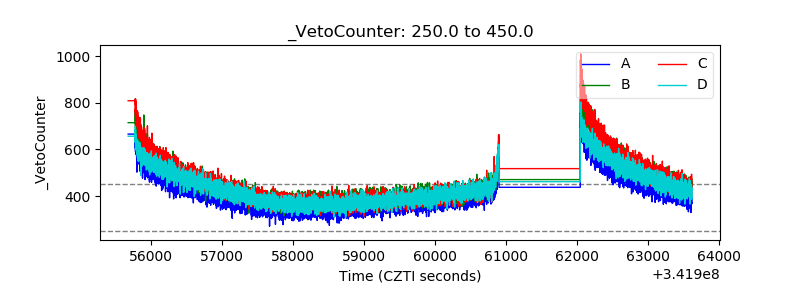 |