| Param | Original file | Final file |
|---|---|---|
| Filename | modeM0/AS1C05_019T04_9000003956_27558cztM0_level2.evt | modeM0/AS1C05_019T04_9000003956_27558cztM0_level2_quad_clean.evt |
| Size (bytes) | 544,717,440 | 94,173,120 |
| Size | 519.5 MB | 89.8 MB |
| Events in quadrant A | 3,181,440 | 619,265 |
| Events in quadrant B | 4,062,526 | 607,441 |
| Events in quadrant C | 3,308,668 | 615,583 |
| Events in quadrant D | 5,505,382 | 557,882 |
| Mode M9 | |||
|---|---|---|---|
| Quadrant | BADHDUFLAG | Total packets | Discarded packets |
| A | 0 | 15 | 0 |
| B | 0 | 16 | 0 |
| C | 0 | 16 | 0 |
| D | 0 | 16 | 0 |
| Mode M0 | |||
|---|---|---|---|
| Quadrant | BADHDUFLAG | Total packets | Discarded packets |
| A | 0 | 13736 | 0 |
| B | 0 | 16299 | 0 |
| C | 0 | 14084 | 0 |
| D | 0 | 20939 | 0 |
| Quadrant | Total seconds | Saturated seconds | Saturation percentage |
|---|---|---|---|
| A | 6478 | 32 | 0.493980% |
| B | 6477 | 367 | 5.666203% |
| C | 6477 | 73 | 1.127065% |
| D | 6477 | 596 | 9.201791% |
Noise dominated data is calculated using 1-second bins in cleaned event files. If a bin has >2000 counts, and if more than 50% of those come from <1% of pixels, then it is considered to be noise-dominated and hence unusable.
| Quadrant | # 1 sec bins | Bins with >0 counts | Bins with >2000 counts | High rate bins dominated by noise | Noise dominated (total time) | Noise dominated (detector-on time) | Marked lightcurve |
|---|---|---|---|---|---|---|---|
| A | 7717 | 6477 | 0 | 0 | 0.00% | 0.00% |  |
| B | 7717 | 6477 | 207 | 207 | 2.68% | 3.20% |  |
| C | 7717 | 6477 | 1 | 1 | 0.01% | 0.02% |  |
| D | 7717 | 6477 | 509 | 509 | 6.60% | 7.86% |  |
Top three noisy pixels from each quadrant. If the there are fewer than three noisy pixels in the level2.evt file, extra rows are filled as -1
| Pixel properties | Quadrant properties | ||||||
|---|---|---|---|---|---|---|---|
| Quadrant | DetID | PixID | Counts | Sigma | Mean | Median | Sigma |
| A | 13 | 254 | 10786 | 61.05 | 823 | 807 | 163.5 |
| A | 4 | 2 | 7620 | 41.68 | 823 | 807 | 163.5 |
| A | 3 | 137 | 7400 | 40.33 | 823 | 807 | 163.5 |
| B | 10 | 245 | 894607 | 5966.46 | 802 | 782 | 149.8 |
| B | 12 | 111 | 17964 | 114.69 | 802 | 782 | 149.8 |
| B | 11 | 111 | 16187 | 102.83 | 802 | 782 | 149.8 |
| C | 14 | 238 | 131188 | 692.8 | 806 | 811 | 188.2 |
| C | 2 | 16 | 28846 | 148.97 | 806 | 811 | 188.2 |
| C | 15 | 208 | 6867 | 32.18 | 806 | 811 | 188.2 |
| D | 1 | 52 | 2460752 | 13501.93 | 768 | 749 | 182.2 |
| D | 2 | 250 | 51009 | 275.86 | 768 | 749 | 182.2 |
| D | 7 | 80 | 38944 | 209.64 | 768 | 749 | 182.2 |
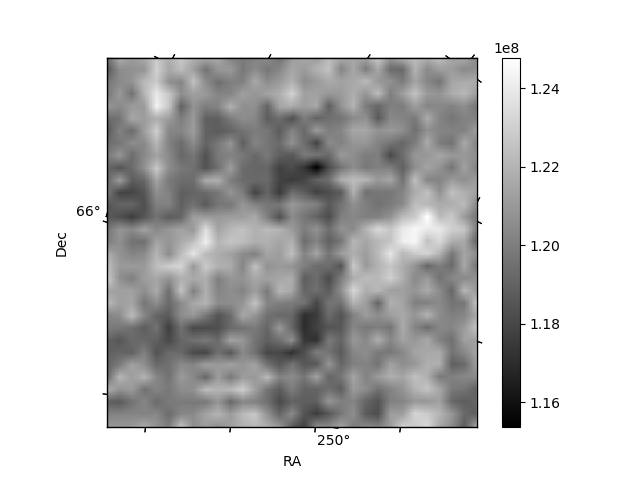
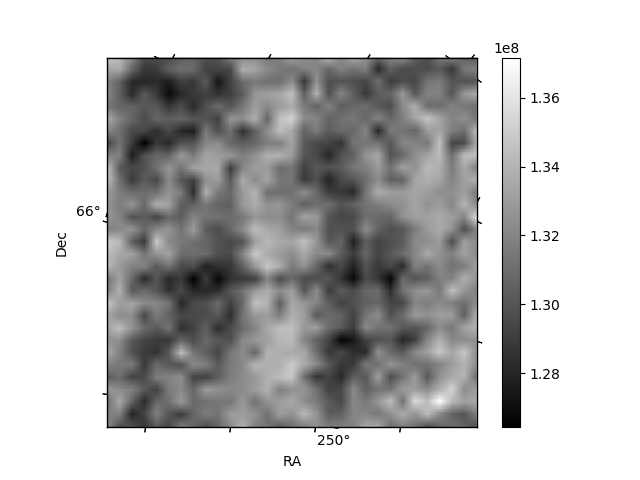
Histogram calculated using DETX and DETY for each event in the final _common_clean file
| Quadrant A | 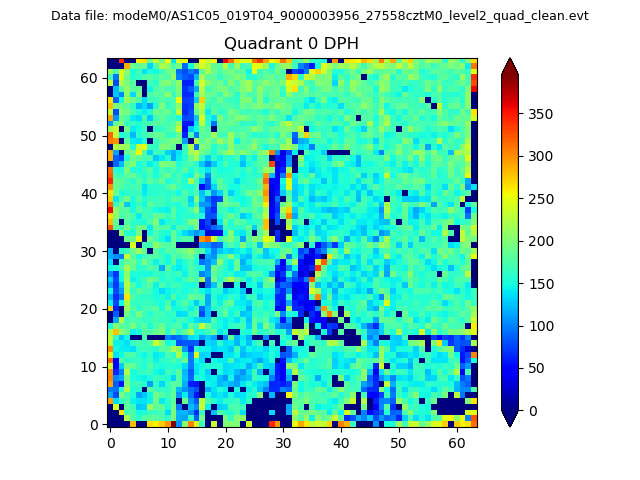 |
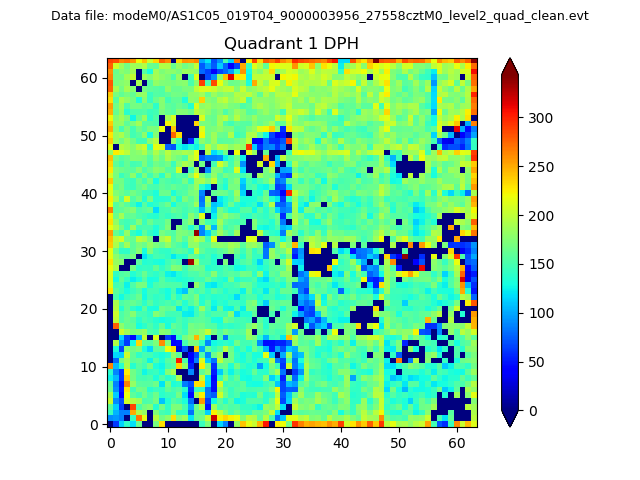 |
Quadrant B |
|---|---|---|---|
| Quadrant D | 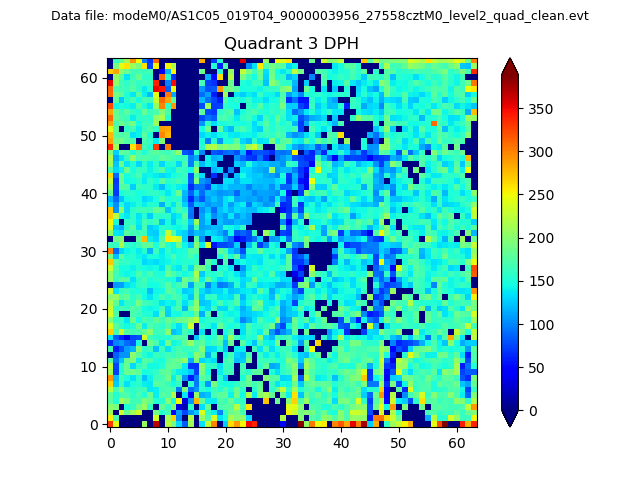 |
 |
Quadrant C |
| Plot type | Count rate plots | Images |
|---|---|---|
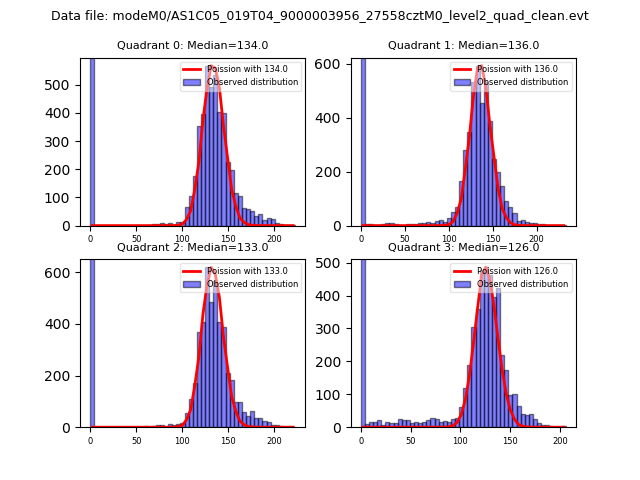
| Comparison with Poisson distribution Blue bars denote a histogram of data divided into 1 sec bins. Red curve is a Poisson curve with rate = median count rate of data. |
 |
 |
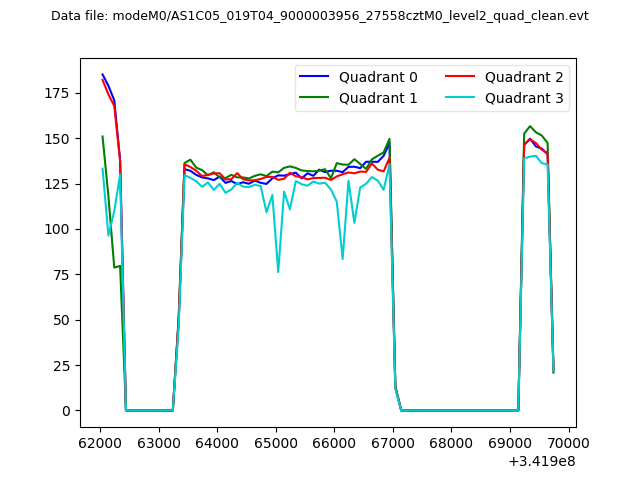
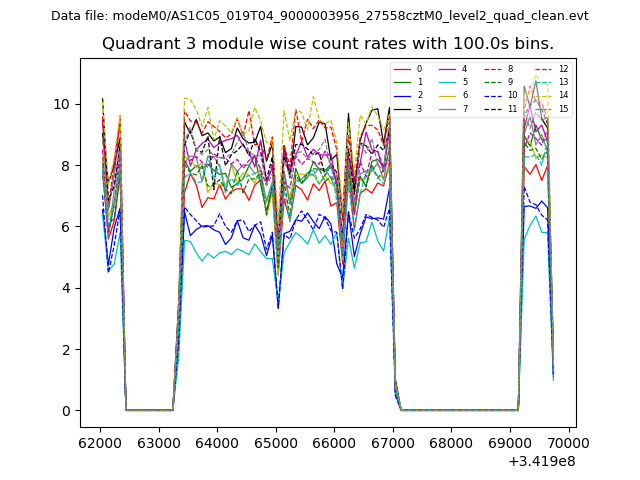
| Quadrant-wise count rates Data is divided into 100 sec bins |
 |
|
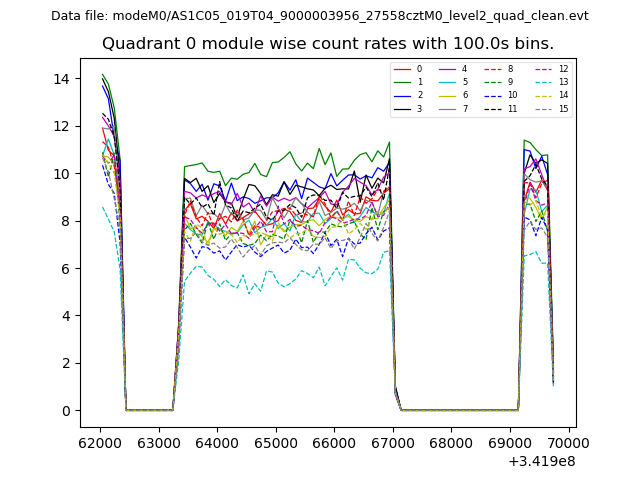
| Module-wise count rates for Quadrant A Data is divided into 100 sec bins |
 |
 |
| Module-wise count rates for Quadrant B Data is divided into 100 sec bins |
 |
 |
| Module-wise count rates for Quadrant C Data is divided into 100 sec bins |
 |
 |
| Module-wise count rates for Quadrant D Data is divided into 100 sec bins |
 |
 |
| Parameter | Plot |
|---|---|
| CZT HV Monitor | 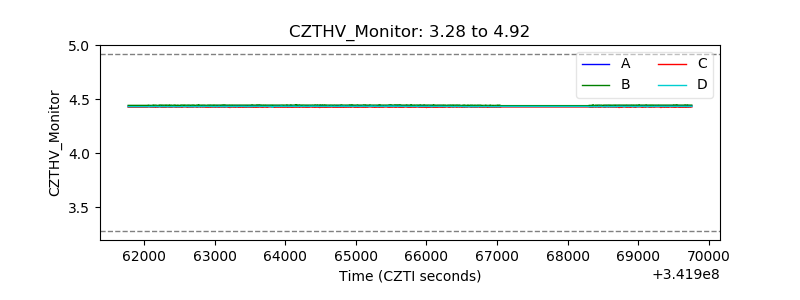 |
| D_VDD | 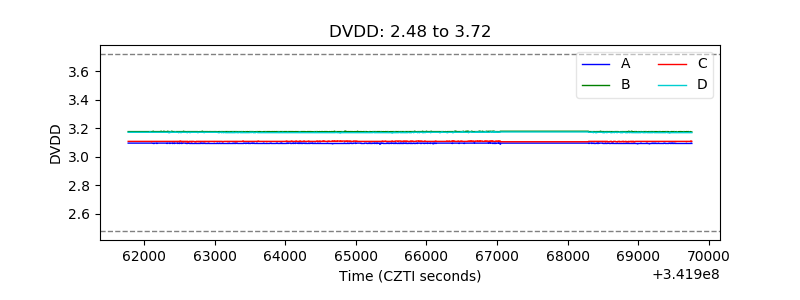 |
| Temperature 1 |  |
| Veto HV Monitor | 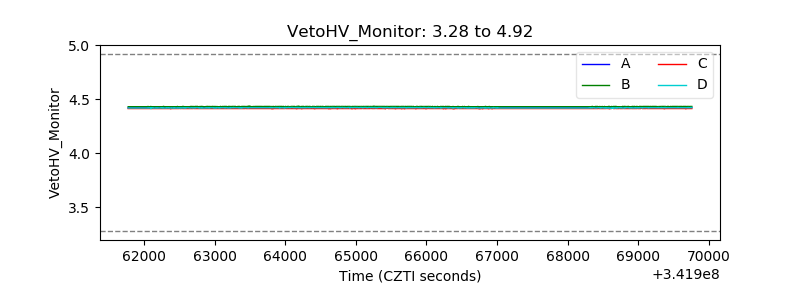 |
| Veto LLD | 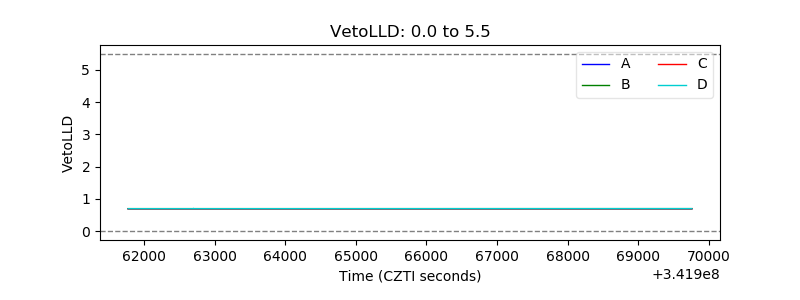 |
| Alpha Counter | 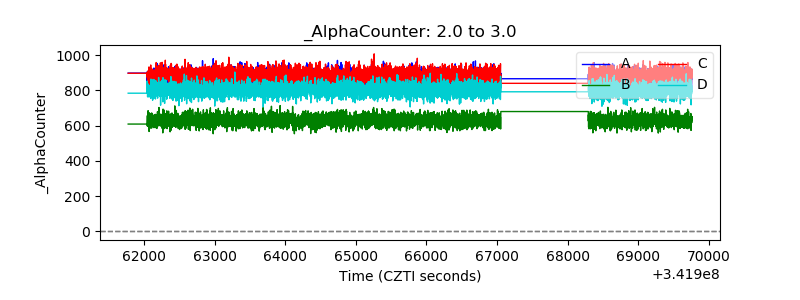 |
| _CPM_Rate | 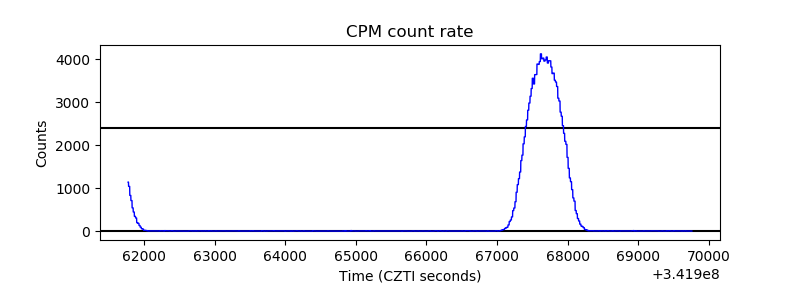 |
| CZT Counter | 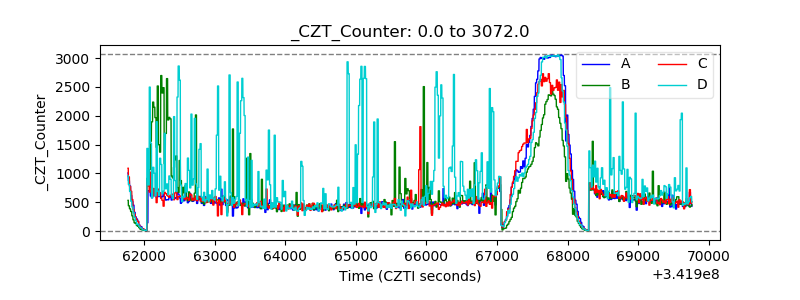 |
| +2.5 Volts monitor |  |
| +5 Volts monitor |  |
| _ROLL_ROT | 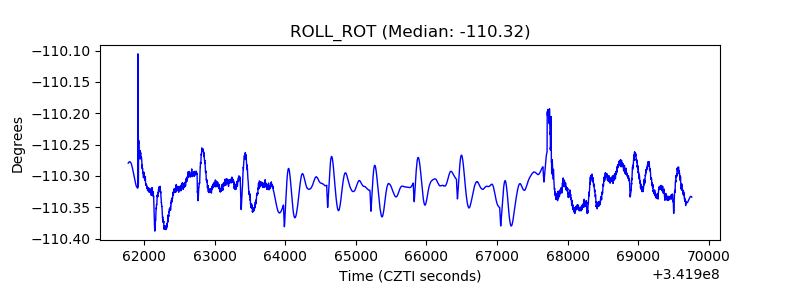 |
| _Roll_DEC | 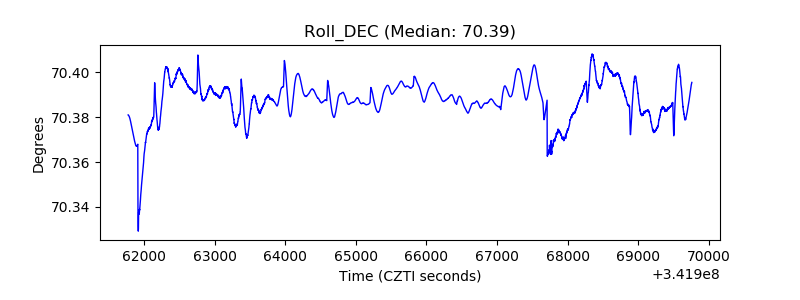 |
| _Roll_RA | 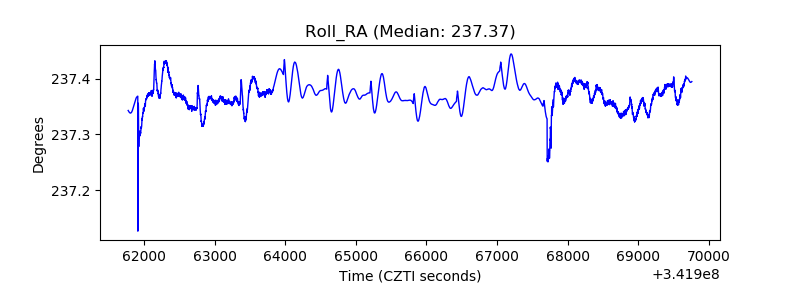 |
| Veto Counter | 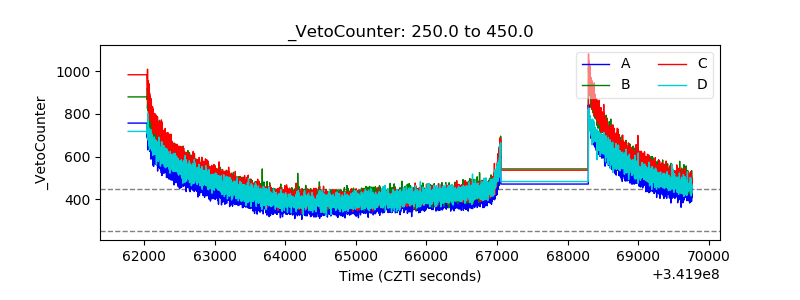 |