| Param | Original file | Final file |
|---|---|---|
| Filename | modeM0/AS1C05_019T04_9000003956_27559cztM0_level2.evt | modeM0/AS1C05_019T04_9000003956_27559cztM0_level2_quad_clean.evt |
| Size (bytes) | 503,239,680 | 106,603,200 |
| Size | 479.9 MB | 101.7 MB |
| Events in quadrant A | 3,571,010 | 698,183 |
| Events in quadrant B | 3,539,965 | 723,434 |
| Events in quadrant C | 3,344,433 | 689,721 |
| Events in quadrant D | 4,347,388 | 666,911 |
| Mode M9 | |||
|---|---|---|---|
| Quadrant | BADHDUFLAG | Total packets | Discarded packets |
| A | 0 | 18 | 0 |
| B | 0 | 19 | 0 |
| C | 0 | 19 | 0 |
| D | 0 | 19 | 0 |
| Mode M0 | |||
|---|---|---|---|
| Quadrant | BADHDUFLAG | Total packets | Discarded packets |
| A | 0 | 14748 | 0 |
| B | 0 | 14617 | 0 |
| C | 0 | 14059 | 0 |
| D | 0 | 17365 | 0 |
| Quadrant | Total seconds | Saturated seconds | Saturation percentage |
|---|---|---|---|
| A | 6459 | 97 | 1.501780% |
| B | 6459 | 92 | 1.424369% |
| C | 6459 | 86 | 1.331475% |
| D | 6459 | 123 | 1.904320% |
Noise dominated data is calculated using 1-second bins in cleaned event files. If a bin has >2000 counts, and if more than 50% of those come from <1% of pixels, then it is considered to be noise-dominated and hence unusable.
| Quadrant | # 1 sec bins | Bins with >0 counts | Bins with >2000 counts | High rate bins dominated by noise | Noise dominated (total time) | Noise dominated (detector-on time) | Marked lightcurve |
|---|---|---|---|---|---|---|---|
| A | 7778 | 6458 | 52 | 52 | 0.67% | 0.81% | 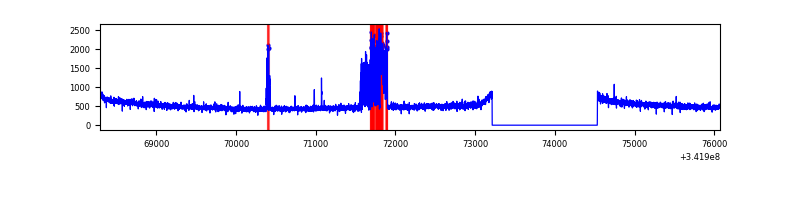 |
| B | 7778 | 6458 | 12 | 12 | 0.15% | 0.19% | 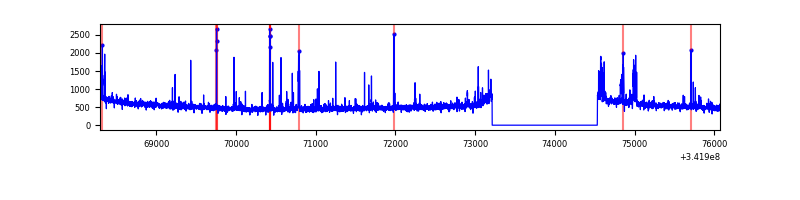 |
| C | 7778 | 6458 | 1 | 1 | 0.01% | 0.02% | 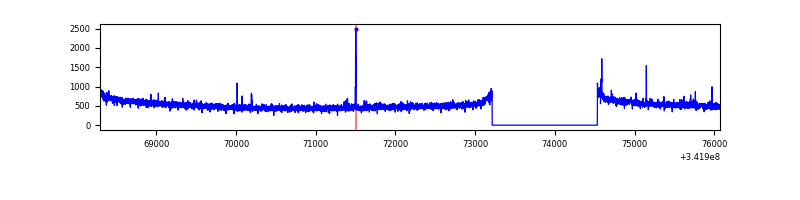 |
| D | 7778 | 6458 | 86 | 86 | 1.11% | 1.33% | 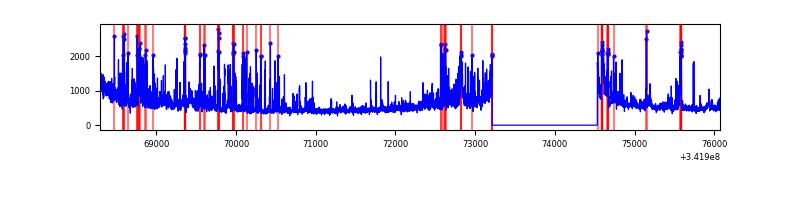 |
Top three noisy pixels from each quadrant. If the there are fewer than three noisy pixels in the level2.evt file, extra rows are filled as -1
| Pixel properties | Quadrant properties | ||||||
|---|---|---|---|---|---|---|---|
| Quadrant | DetID | PixID | Counts | Sigma | Mean | Median | Sigma |
| A | 4 | 2 | 330593 | 1986.1 | 841 | 826 | 166.0 |
| A | 13 | 254 | 10417 | 57.76 | 841 | 826 | 166.0 |
| A | 3 | 137 | 7409 | 39.65 | 841 | 826 | 166.0 |
| B | 10 | 245 | 196592 | 1237.83 | 845 | 824 | 158.2 |
| B | 3 | 64 | 29197 | 179.4 | 845 | 824 | 158.2 |
| B | 12 | 111 | 18624 | 112.55 | 845 | 824 | 158.2 |
| C | 14 | 238 | 134723 | 708.52 | 815 | 823 | 189.0 |
| C | 2 | 16 | 12335 | 60.91 | 815 | 823 | 189.0 |
| C | 10 | 22 | 11042 | 54.07 | 815 | 823 | 189.0 |
| D | 1 | 52 | 1152127 | 6019.24 | 808 | 787 | 191.3 |
| D | 12 | 227 | 59045 | 304.57 | 808 | 787 | 191.3 |
| D | 2 | 250 | 31902 | 162.67 | 808 | 787 | 191.3 |
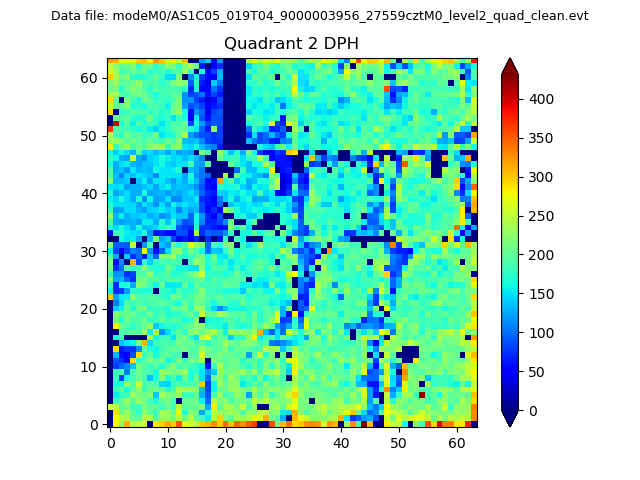
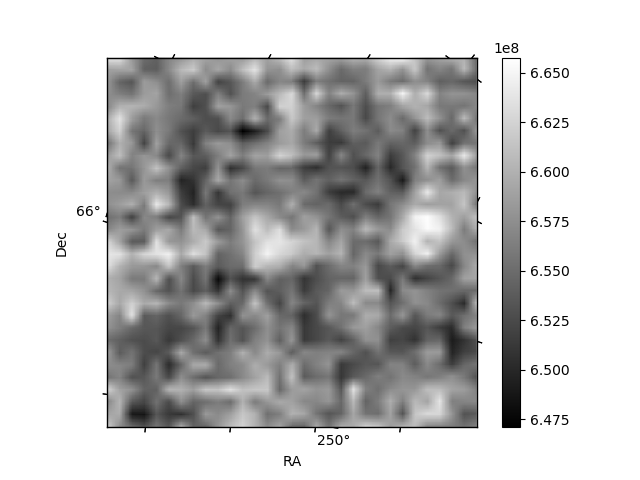
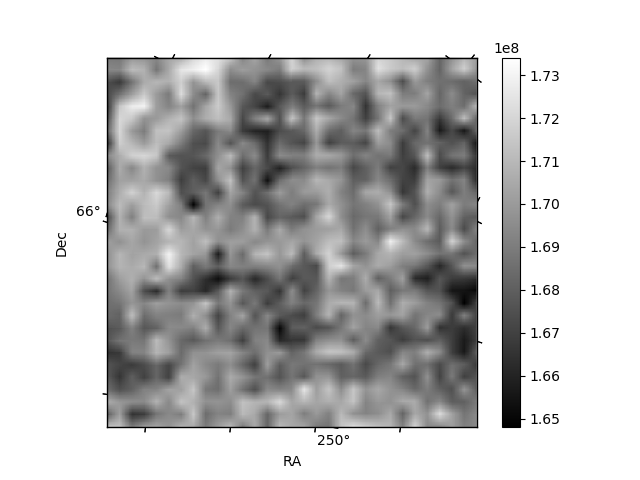
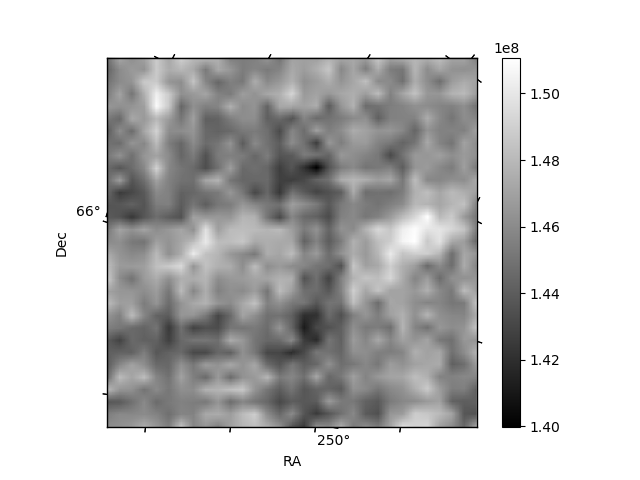
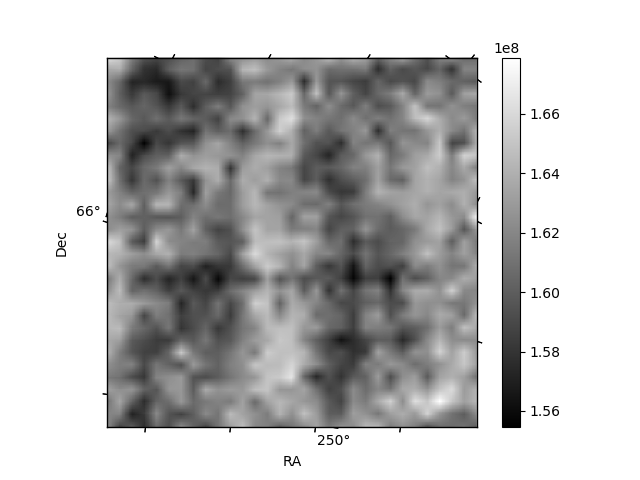
Histogram calculated using DETX and DETY for each event in the final _common_clean file
| Quadrant A | 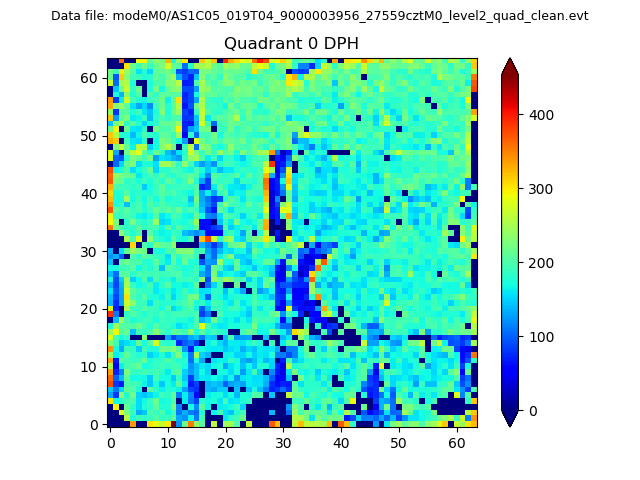 |
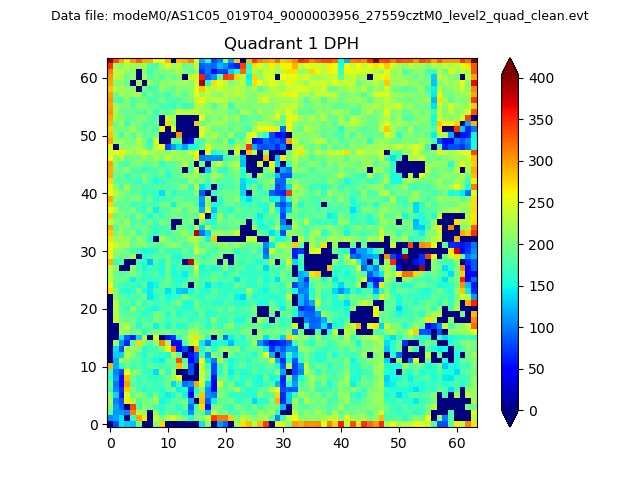 |
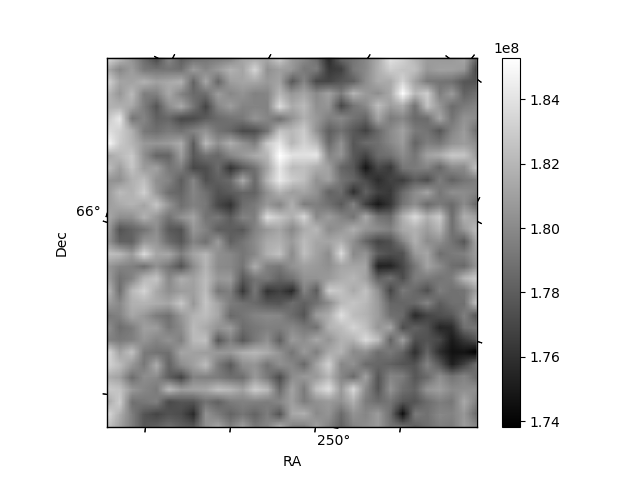
Quadrant B |
|---|---|---|---|
| Quadrant D | 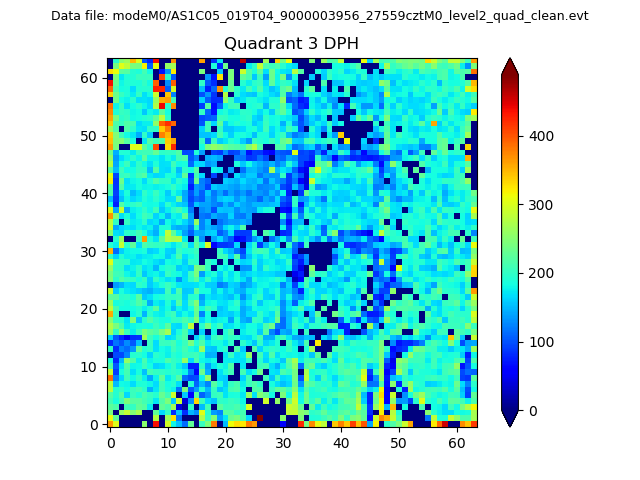 |
 |
Quadrant C |
| Plot type | Count rate plots | Images |
|---|---|---|
| Comparison with Poisson distribution Blue bars denote a histogram of data divided into 1 sec bins. Red curve is a Poisson curve with rate = median count rate of data. |
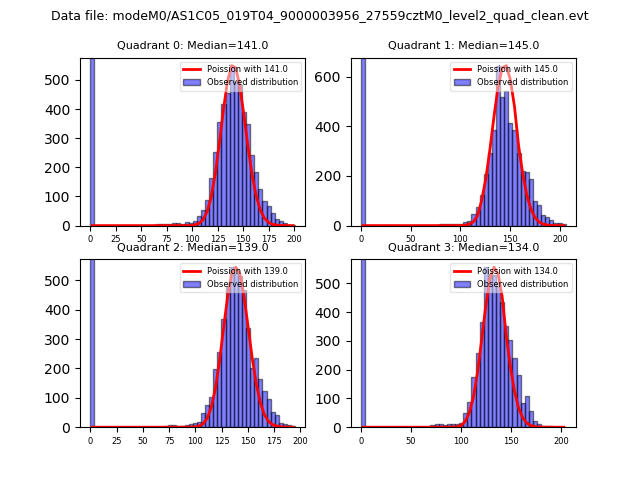 |
 |
| Quadrant-wise count rates Data is divided into 100 sec bins |
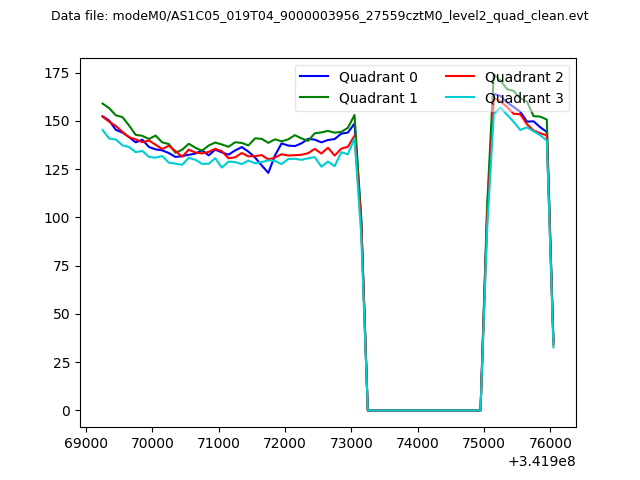 |
|
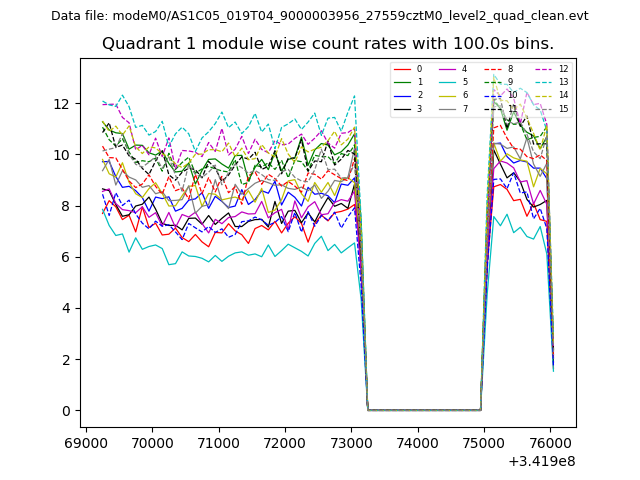
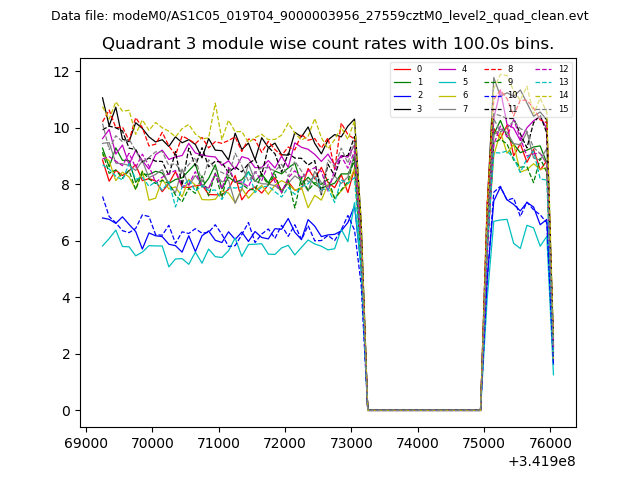
| Module-wise count rates for Quadrant A Data is divided into 100 sec bins |
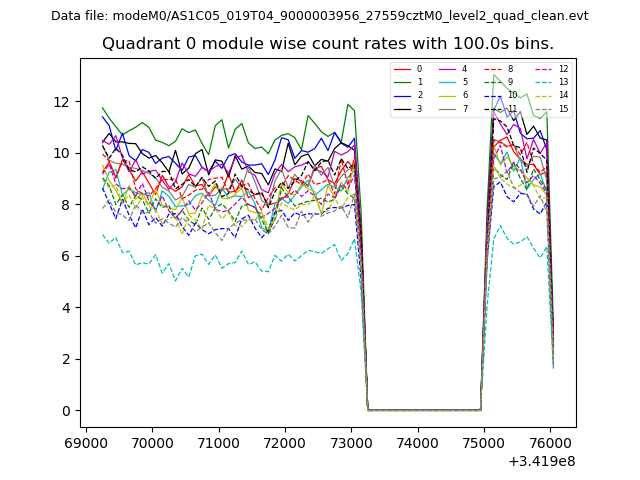 |
 |
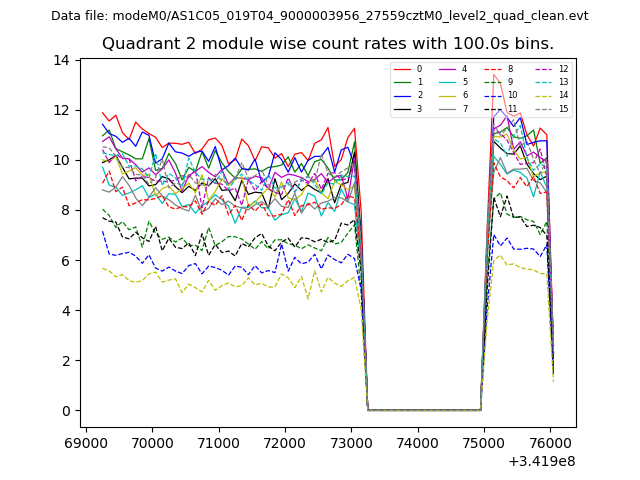
| Module-wise count rates for Quadrant B Data is divided into 100 sec bins |
 |
 |
| Module-wise count rates for Quadrant C Data is divided into 100 sec bins |
 |
 |
| Module-wise count rates for Quadrant D Data is divided into 100 sec bins |
 |
 |
| Parameter | Plot |
|---|---|
| CZT HV Monitor | 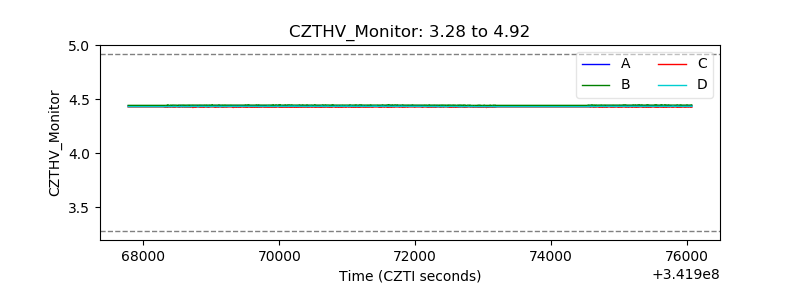 |
| D_VDD | 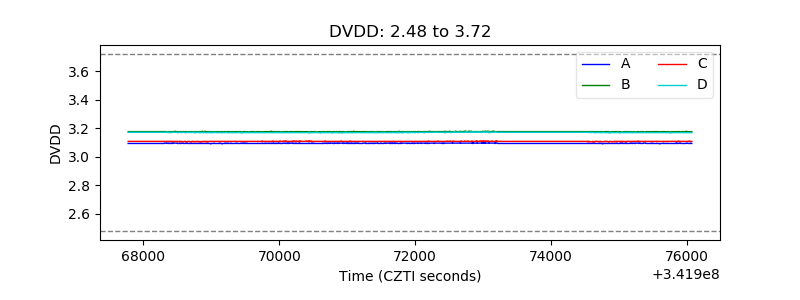 |
| Temperature 1 | 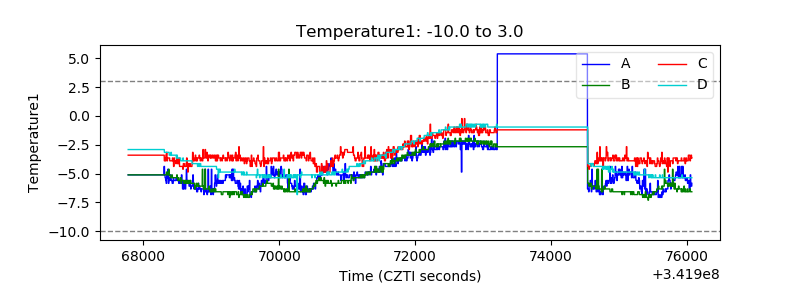 |
| Veto HV Monitor | 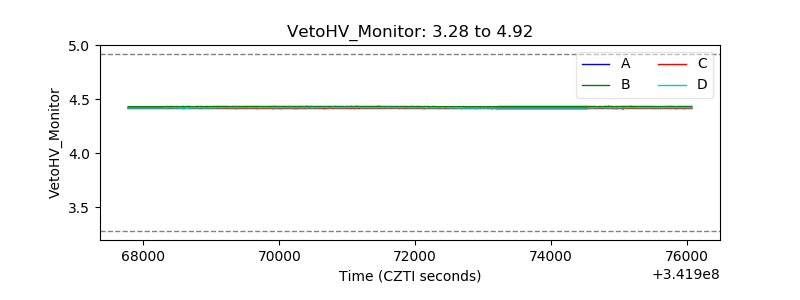 |
| Veto LLD | 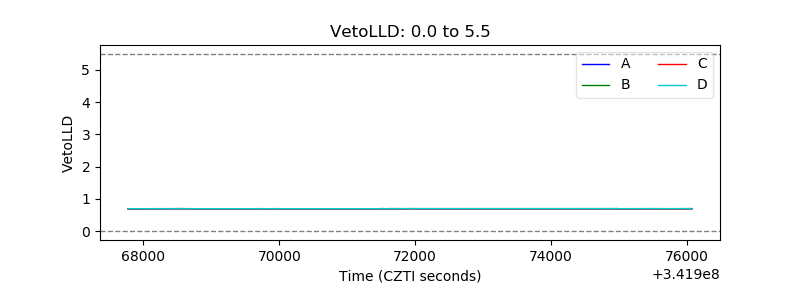 |
| Alpha Counter | 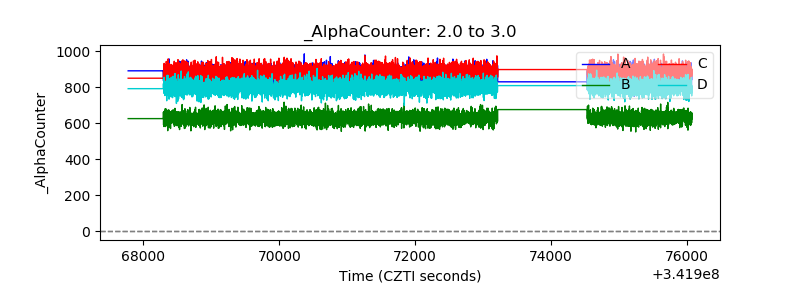 |
| _CPM_Rate | 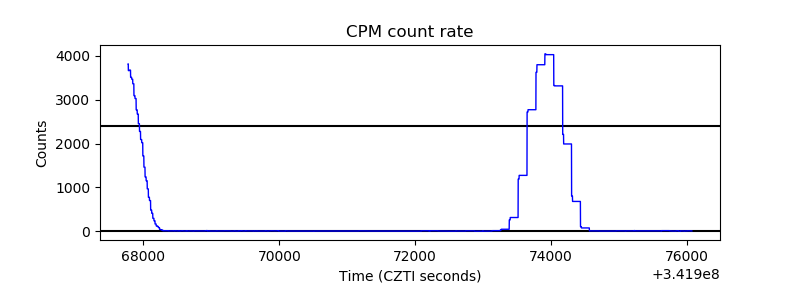 |
| CZT Counter | 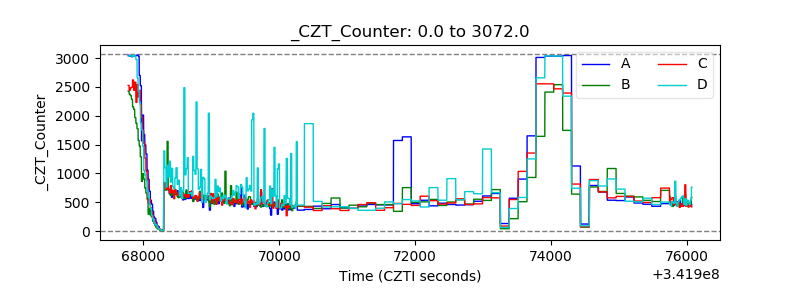 |
| +2.5 Volts monitor |  |
| +5 Volts monitor |  |
| _ROLL_ROT | 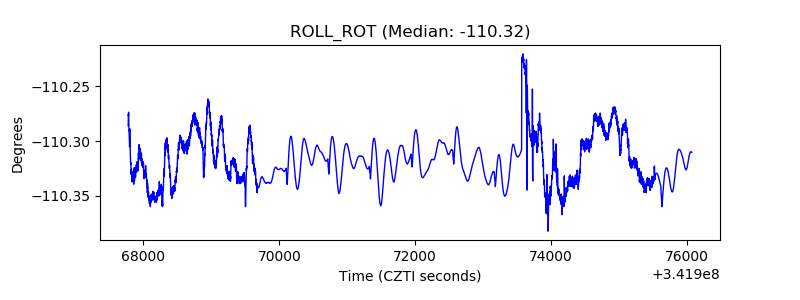 |
| _Roll_DEC | 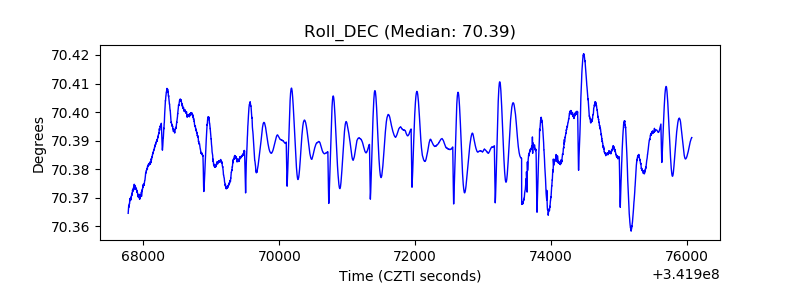 |
| _Roll_RA | 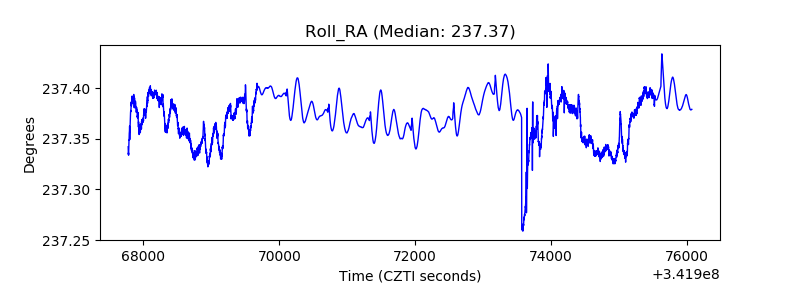 |
| Veto Counter | 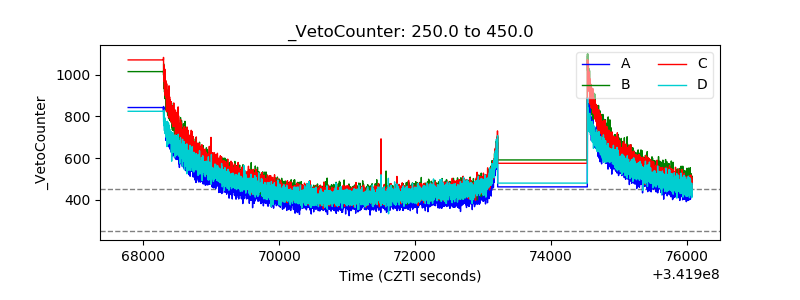 |