| Param | Original file | Final file |
|---|---|---|
| Filename | modeM0/AS1C05_019T04_9000003956_27560cztM0_level2.evt | modeM0/AS1C05_019T04_9000003956_27560cztM0_level2_quad_clean.evt |
| Size (bytes) | 435,412,800 | 121,032,000 |
| Size | 415.2 MB | 115.4 MB |
| Events in quadrant A | 2,908,195 | 832,003 |
| Events in quadrant B | 3,068,410 | 852,354 |
| Events in quadrant C | 2,991,412 | 801,815 |
| Events in quadrant D | 3,820,567 | 770,388 |
| Mode M9 | |||
|---|---|---|---|
| Quadrant | BADHDUFLAG | Total packets | Discarded packets |
| A | 0 | 14 | 0 |
| B | 0 | 14 | 0 |
| C | 0 | 14 | 0 |
| D | 0 | 14 | 0 |
| Mode M0 | |||
|---|---|---|---|
| Quadrant | BADHDUFLAG | Total packets | Discarded packets |
| A | 0 | 12167 | 0 |
| B | 0 | 12645 | 0 |
| C | 0 | 12454 | 0 |
| D | 0 | 15155 | 0 |
| Quadrant | Total seconds | Saturated seconds | Saturation percentage |
|---|---|---|---|
| A | 5860 | 36 | 0.614334% |
| B | 5860 | 55 | 0.938567% |
| C | 5860 | 64 | 1.092150% |
| D | 5860 | 150 | 2.559727% |
Noise dominated data is calculated using 1-second bins in cleaned event files. If a bin has >2000 counts, and if more than 50% of those come from <1% of pixels, then it is considered to be noise-dominated and hence unusable.
| Quadrant | # 1 sec bins | Bins with >0 counts | Bins with >2000 counts | High rate bins dominated by noise | Noise dominated (total time) | Noise dominated (detector-on time) | Marked lightcurve |
|---|---|---|---|---|---|---|---|
| A | 7234 | 5859 | 0 | 0 | 0.00% | 0.00% | 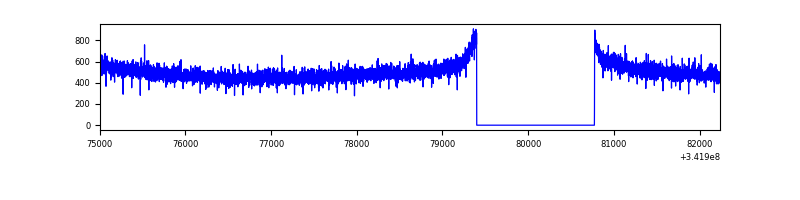 |
| B | 7234 | 5859 | 3 | 3 | 0.04% | 0.05% | 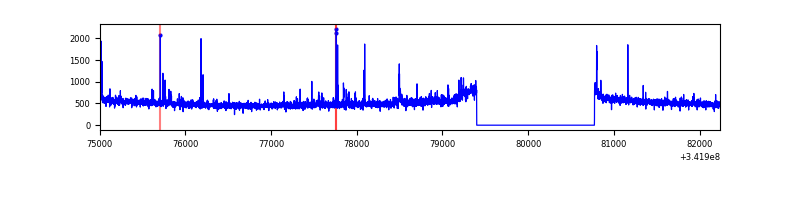 |
| C | 7234 | 5859 | 9 | 9 | 0.12% | 0.15% | 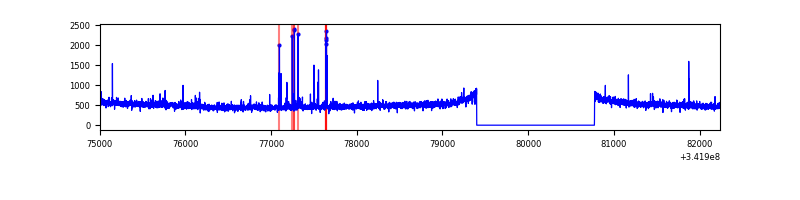 |
| D | 7234 | 5859 | 104 | 104 | 1.44% | 1.78% | 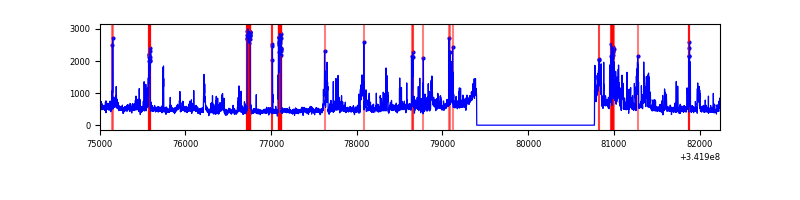 |
Top three noisy pixels from each quadrant. If the there are fewer than three noisy pixels in the level2.evt file, extra rows are filled as -1
| Pixel properties | Quadrant properties | ||||||
|---|---|---|---|---|---|---|---|
| Quadrant | DetID | PixID | Counts | Sigma | Mean | Median | Sigma |
| A | 13 | 254 | 9797 | 60.55 | 752 | 738 | 149.6 |
| A | 4 | 2 | 8251 | 50.21 | 752 | 738 | 149.6 |
| A | 3 | 137 | 6590 | 39.11 | 752 | 738 | 149.6 |
| B | 10 | 245 | 68183 | 481.18 | 751 | 733 | 140.2 |
| B | 3 | 64 | 39991 | 280.06 | 751 | 733 | 140.2 |
| B | 15 | 32 | 17774 | 121.57 | 751 | 733 | 140.2 |
| C | 14 | 238 | 118718 | 712.02 | 716 | 721 | 165.7 |
| C | 15 | 208 | 60834 | 362.74 | 716 | 721 | 165.7 |
| C | 7 | 221 | 11539 | 65.28 | 716 | 721 | 165.7 |
| D | 1 | 52 | 668171 | 4037.34 | 710 | 692 | 165.3 |
| D | 7 | 80 | 175633 | 1058.16 | 710 | 692 | 165.3 |
| D | 12 | 227 | 126512 | 761.04 | 710 | 692 | 165.3 |
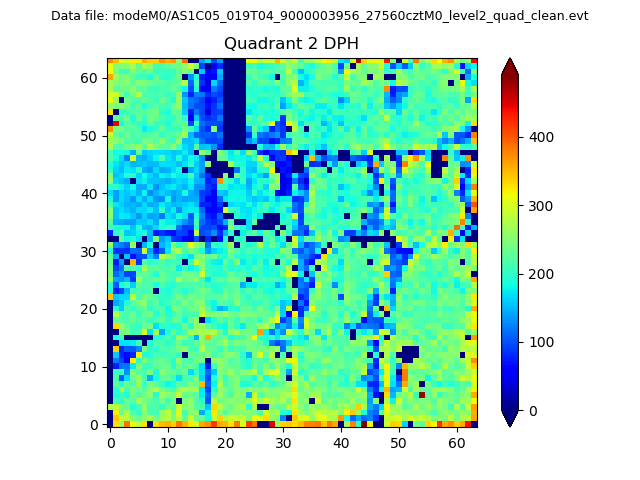
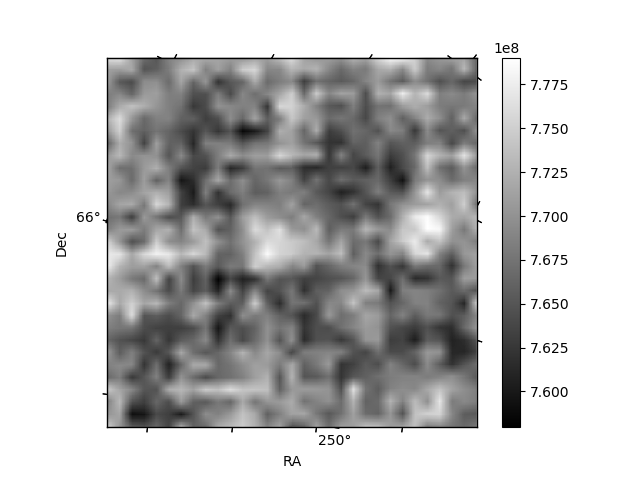
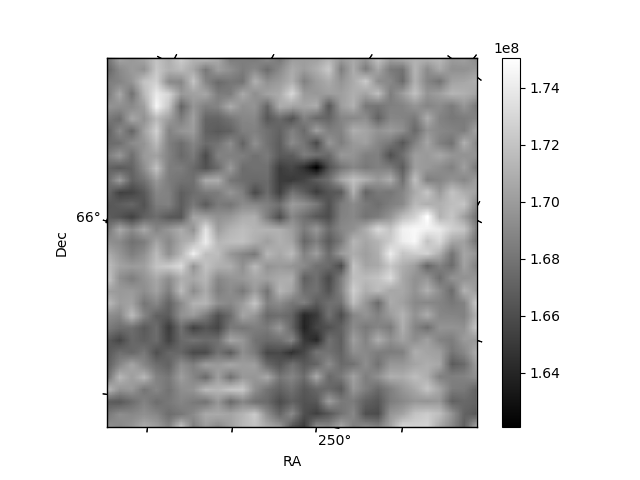
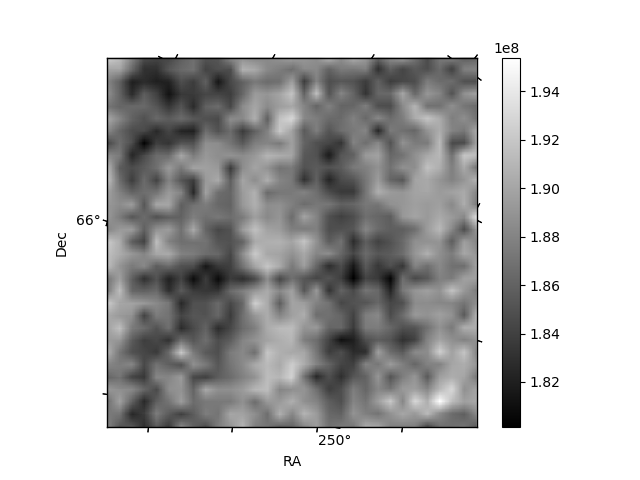
Histogram calculated using DETX and DETY for each event in the final _common_clean file
| Quadrant A | 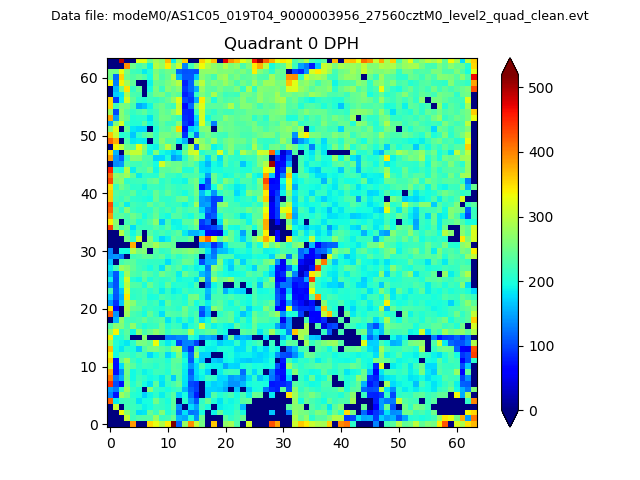 |
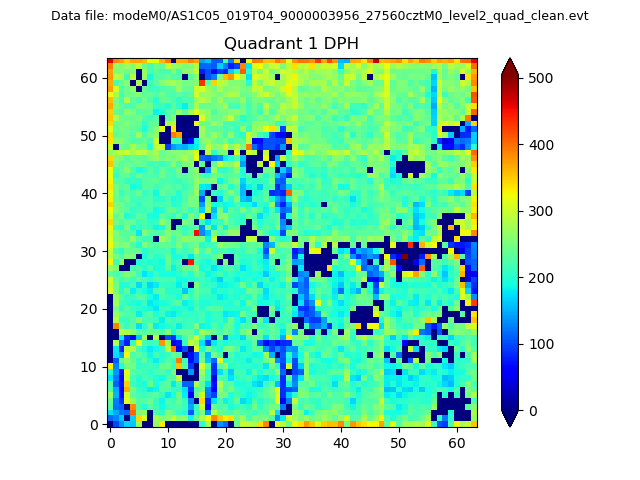 |
Quadrant B |
|---|---|---|---|
| Quadrant D | 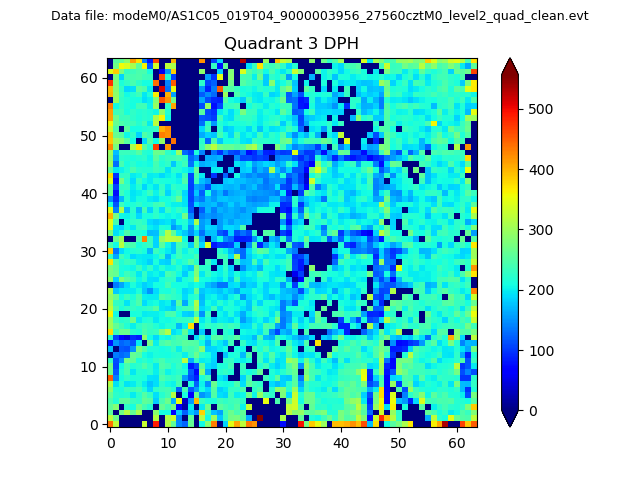 |
 |
Quadrant C |
| Plot type | Count rate plots | Images |
|---|---|---|
| Comparison with Poisson distribution Blue bars denote a histogram of data divided into 1 sec bins. Red curve is a Poisson curve with rate = median count rate of data. |
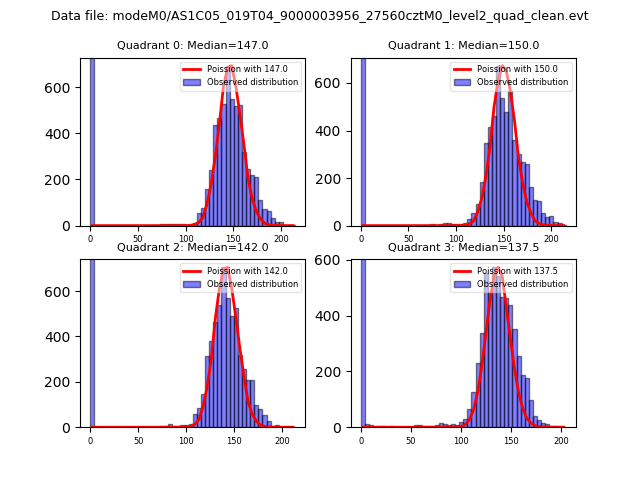 |
 |
| Quadrant-wise count rates Data is divided into 100 sec bins |
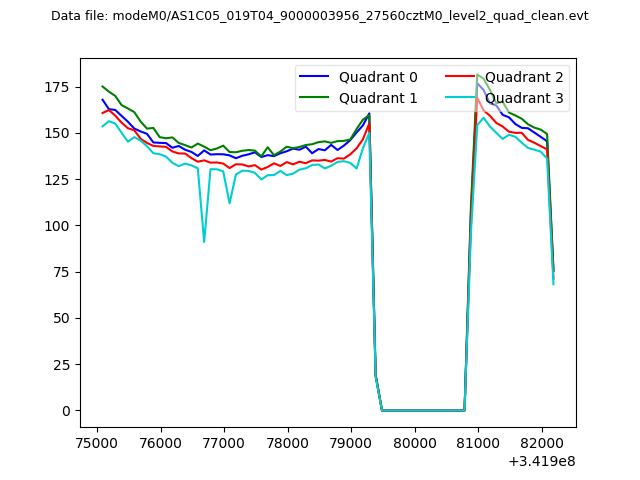 |
|
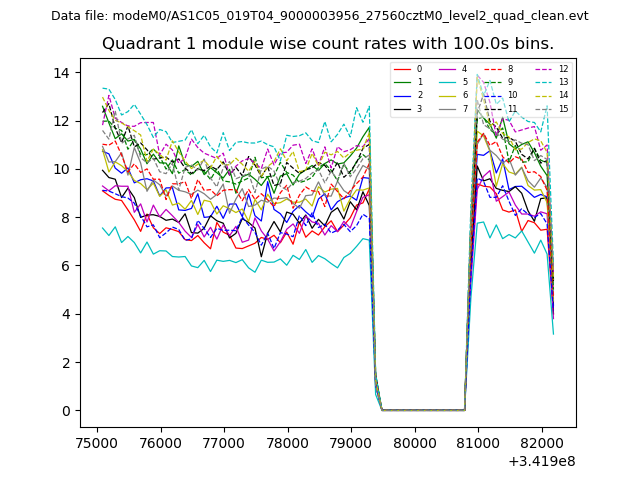
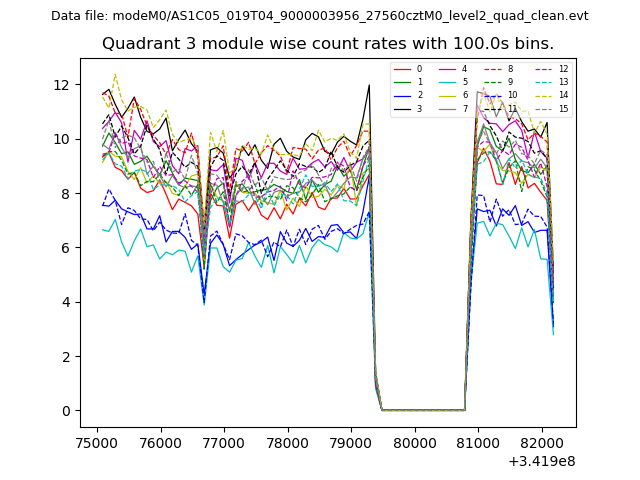
| Module-wise count rates for Quadrant A Data is divided into 100 sec bins |
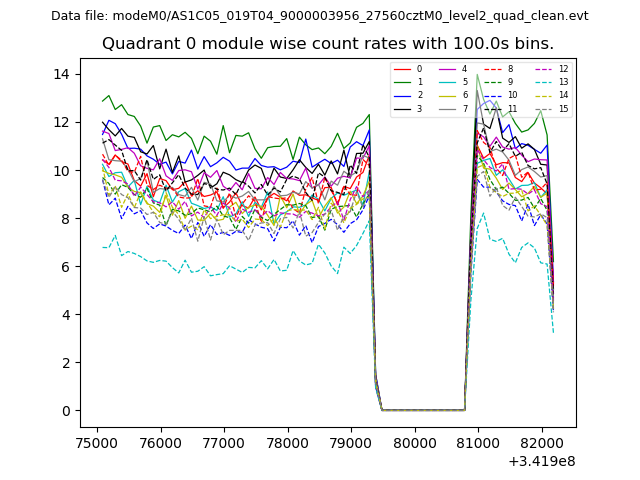 |
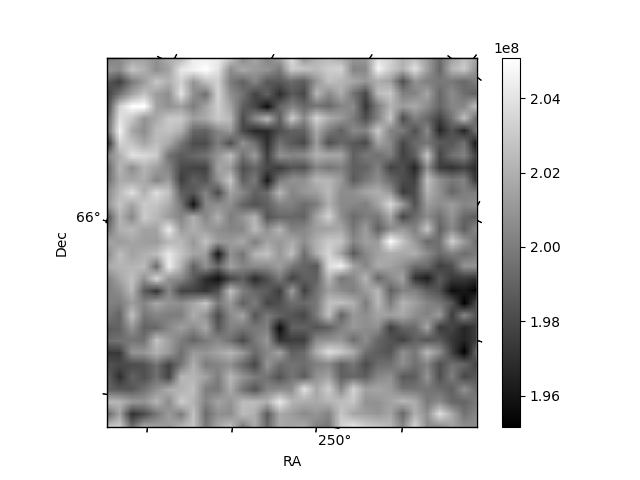 |
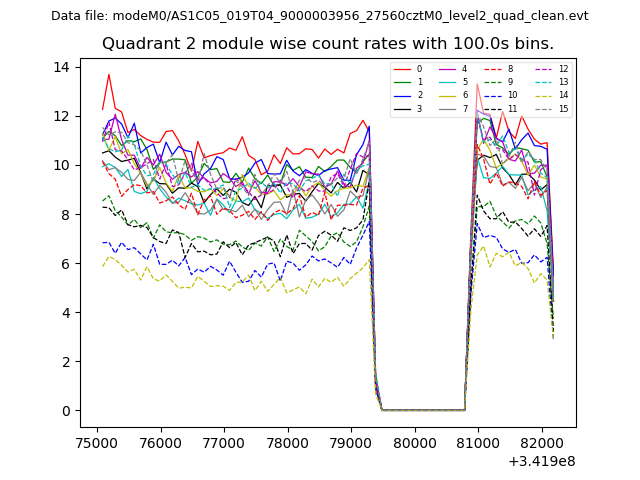
| Module-wise count rates for Quadrant B Data is divided into 100 sec bins |
 |
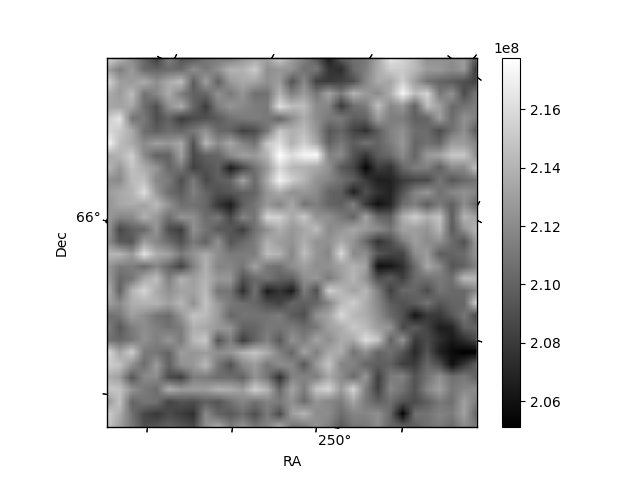 |
| Module-wise count rates for Quadrant C Data is divided into 100 sec bins |
 |
 |
| Module-wise count rates for Quadrant D Data is divided into 100 sec bins |
 |
 |
| Parameter | Plot |
|---|---|
| CZT HV Monitor | 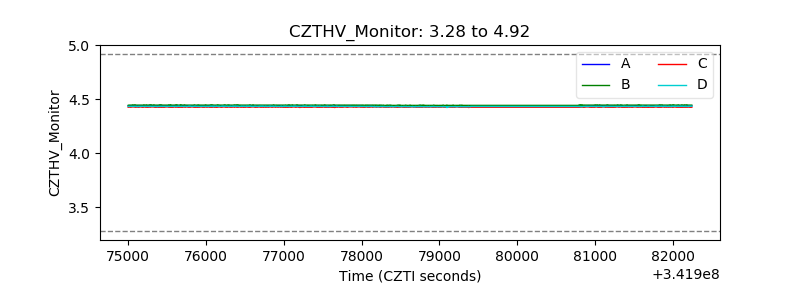 |
| D_VDD | 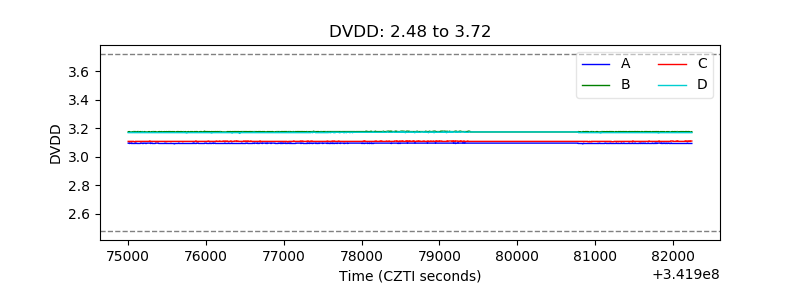 |
| Temperature 1 | 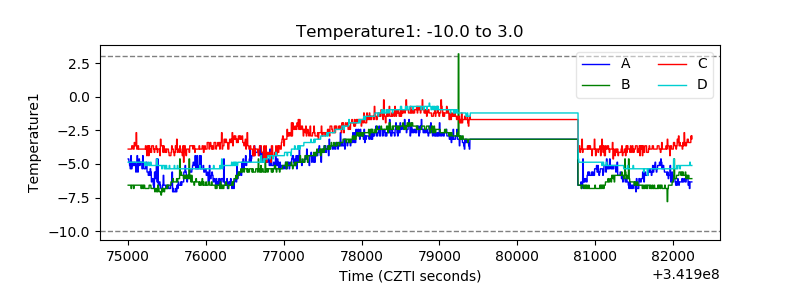 |
| Veto HV Monitor | 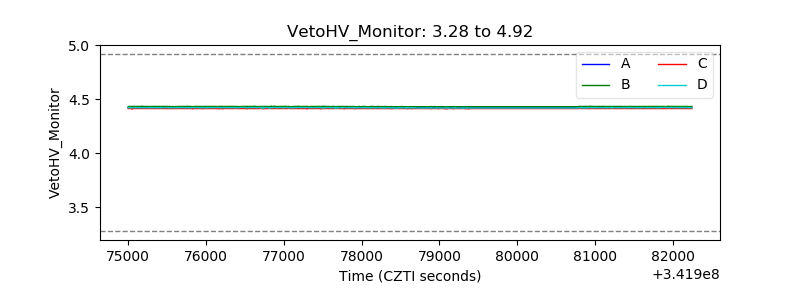 |
| Veto LLD | 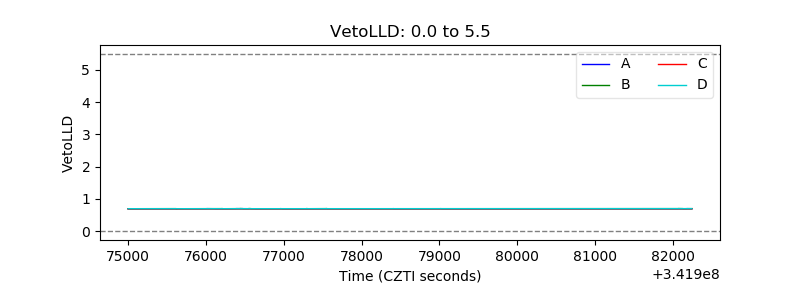 |
| Alpha Counter | 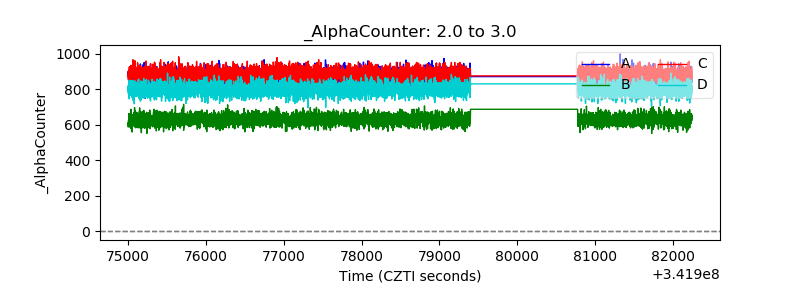 |
| _CPM_Rate | 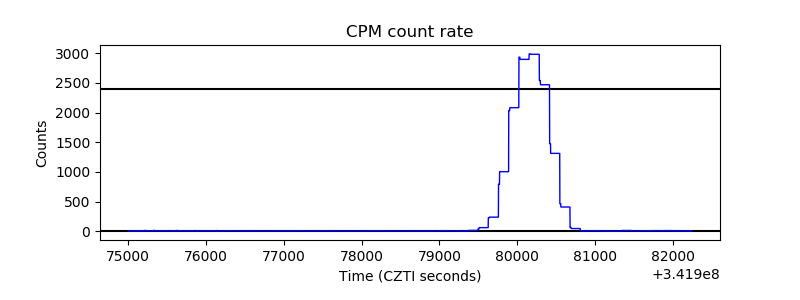 |
| CZT Counter | 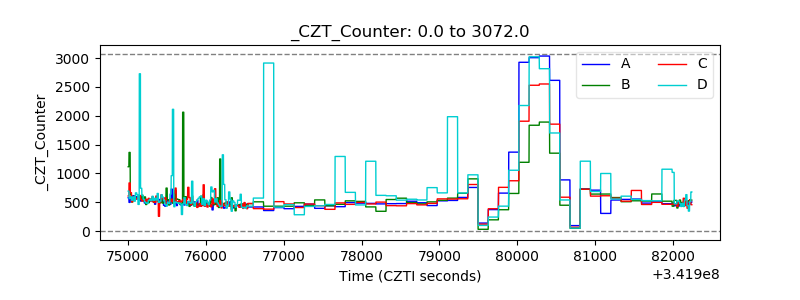 |
| +2.5 Volts monitor | 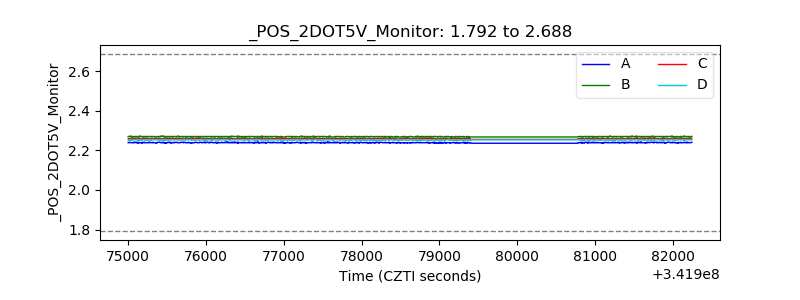 |
| +5 Volts monitor | 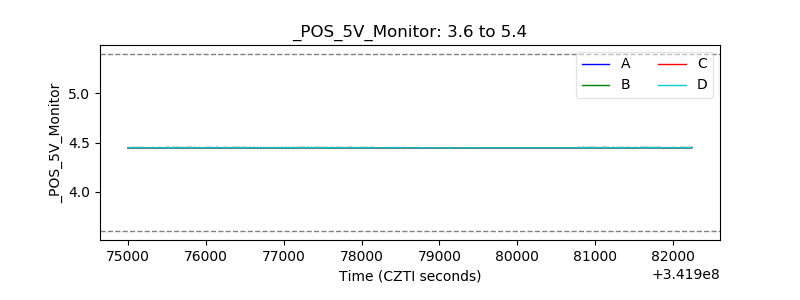 |
| _ROLL_ROT | 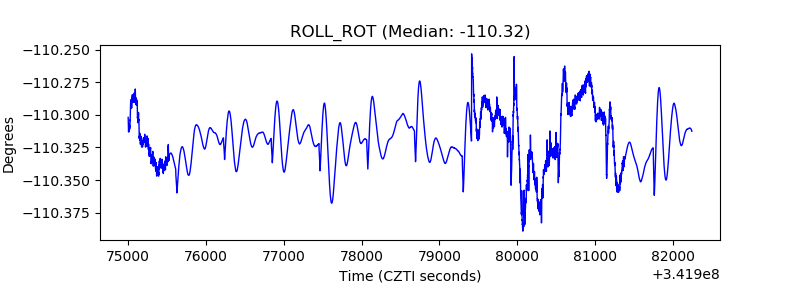 |
| _Roll_DEC | 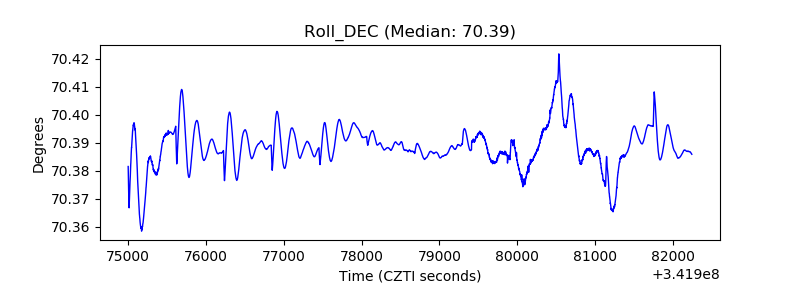 |
| _Roll_RA | 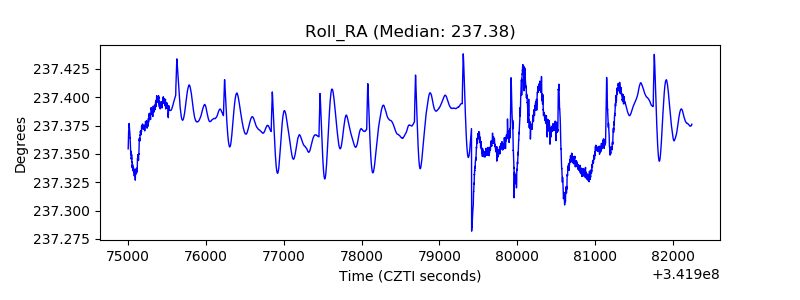 |
| Veto Counter | 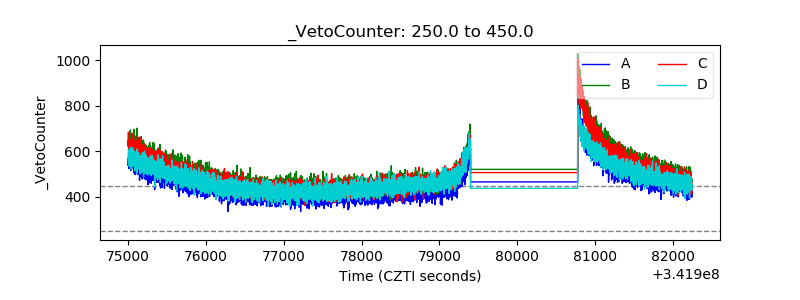 |