| Param | Original file | Final file |
|---|---|---|
| Filename | modeM0/AS1C05_019T04_9000003956_27561cztM0_level2.evt | modeM0/AS1C05_019T04_9000003956_27561cztM0_level2_quad_clean.evt |
| Size (bytes) | 451,169,280 | 120,974,400 |
| Size | 430.3 MB | 115.4 MB |
| Events in quadrant A | 2,839,163 | 837,663 |
| Events in quadrant B | 3,190,603 | 851,403 |
| Events in quadrant C | 2,845,632 | 803,695 |
| Events in quadrant D | 4,394,262 | 765,725 |
| Mode M9 | |||
|---|---|---|---|
| Quadrant | BADHDUFLAG | Total packets | Discarded packets |
| A | 0 | 14 | 0 |
| B | 0 | 14 | 0 |
| C | 0 | 14 | 0 |
| D | 0 | 14 | 0 |
| Mode M0 | |||
|---|---|---|---|
| Quadrant | BADHDUFLAG | Total packets | Discarded packets |
| A | 0 | 11994 | 0 |
| B | 0 | 13060 | 0 |
| C | 0 | 12108 | 0 |
| D | 0 | 17004 | 0 |
| Quadrant | Total seconds | Saturated seconds | Saturation percentage |
|---|---|---|---|
| A | 5807 | 39 | 0.671603% |
| B | 5808 | 127 | 2.186639% |
| C | 5808 | 45 | 0.774793% |
| D | 5808 | 258 | 4.442149% |
Noise dominated data is calculated using 1-second bins in cleaned event files. If a bin has >2000 counts, and if more than 50% of those come from <1% of pixels, then it is considered to be noise-dominated and hence unusable.
| Quadrant | # 1 sec bins | Bins with >0 counts | Bins with >2000 counts | High rate bins dominated by noise | Noise dominated (total time) | Noise dominated (detector-on time) | Marked lightcurve |
|---|---|---|---|---|---|---|---|
| A | 7152 | 5807 | 1 | 1 | 0.01% | 0.02% | 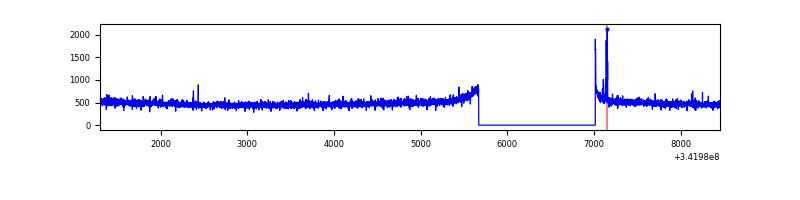 |
| B | 7152 | 5807 | 47 | 47 | 0.66% | 0.81% | 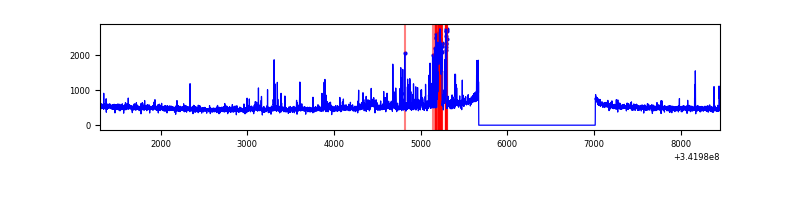 |
| C | 7152 | 5807 | 5 | 5 | 0.07% | 0.09% | 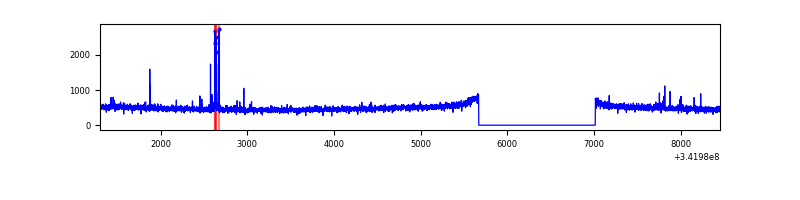 |
| D | 7152 | 5807 | 185 | 185 | 2.59% | 3.19% | 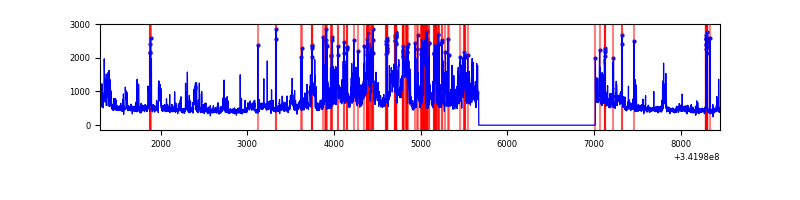 |
Top three noisy pixels from each quadrant. If the there are fewer than three noisy pixels in the level2.evt file, extra rows are filled as -1
| Pixel properties | Quadrant properties | ||||||
|---|---|---|---|---|---|---|---|
| Quadrant | DetID | PixID | Counts | Sigma | Mean | Median | Sigma |
| A | 15 | 174 | 15674 | 102.82 | 730 | 717 | 145.5 |
| A | 13 | 254 | 9502 | 60.39 | 730 | 717 | 145.5 |
| A | 3 | 137 | 6578 | 40.29 | 730 | 717 | 145.5 |
| B | 10 | 245 | 190133 | 1400.62 | 722 | 705 | 135.2 |
| B | 3 | 64 | 132182 | 972.13 | 722 | 705 | 135.2 |
| B | 15 | 32 | 38187 | 277.14 | 722 | 705 | 135.2 |
| C | 14 | 238 | 113824 | 704.78 | 688 | 691 | 160.5 |
| C | 2 | 16 | 37326 | 228.22 | 688 | 691 | 160.5 |
| C | 7 | 221 | 6378 | 35.43 | 688 | 691 | 160.5 |
| D | 1 | 52 | 985453 | 6181.64 | 683 | 665 | 159.3 |
| D | 7 | 80 | 423846 | 2656.36 | 683 | 665 | 159.3 |
| D | 12 | 227 | 251822 | 1576.54 | 683 | 665 | 159.3 |
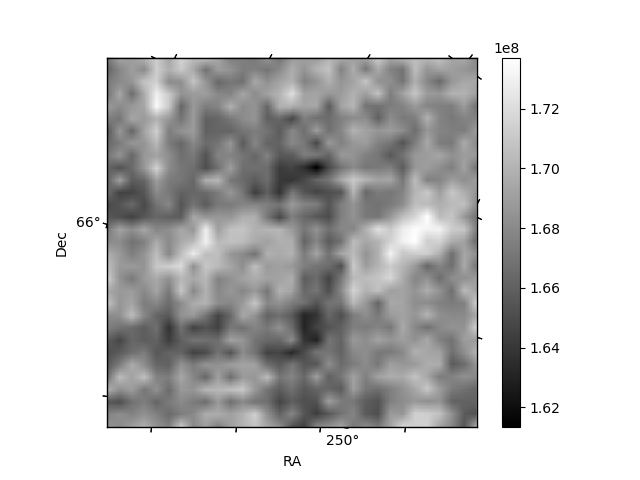
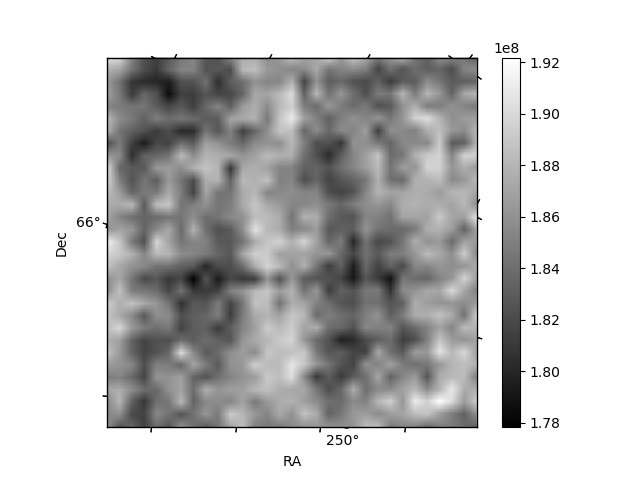
Histogram calculated using DETX and DETY for each event in the final _common_clean file
| Quadrant A | 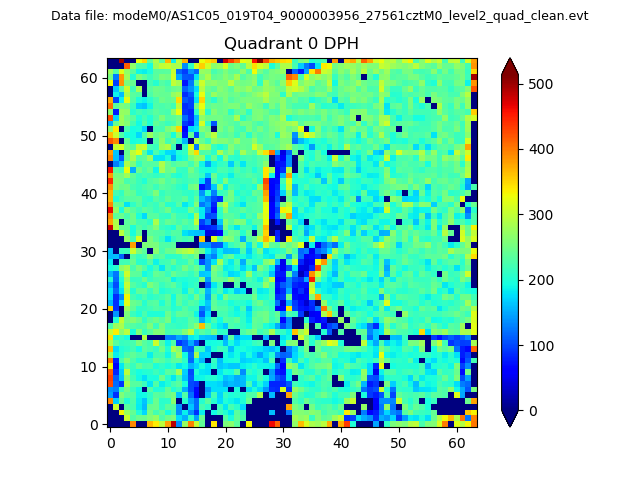 |
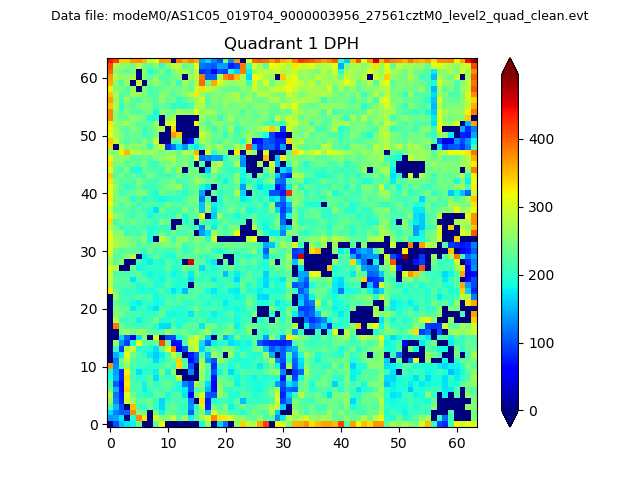 |
Quadrant B |
|---|---|---|---|
| Quadrant D | 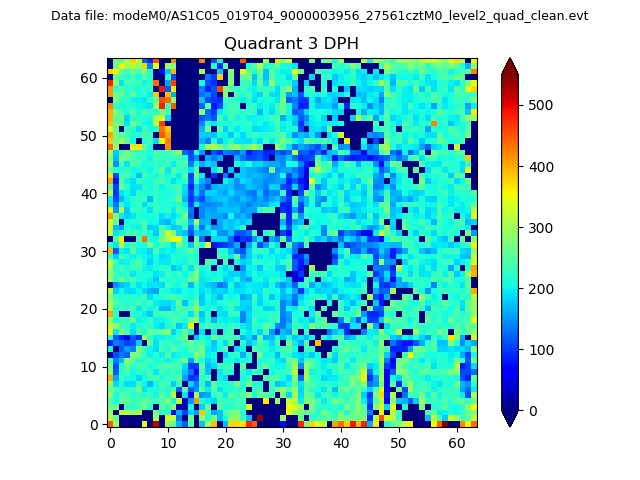 |
 |
Quadrant C |
| Plot type | Count rate plots | Images |
|---|---|---|
| Comparison with Poisson distribution Blue bars denote a histogram of data divided into 1 sec bins. Red curve is a Poisson curve with rate = median count rate of data. |
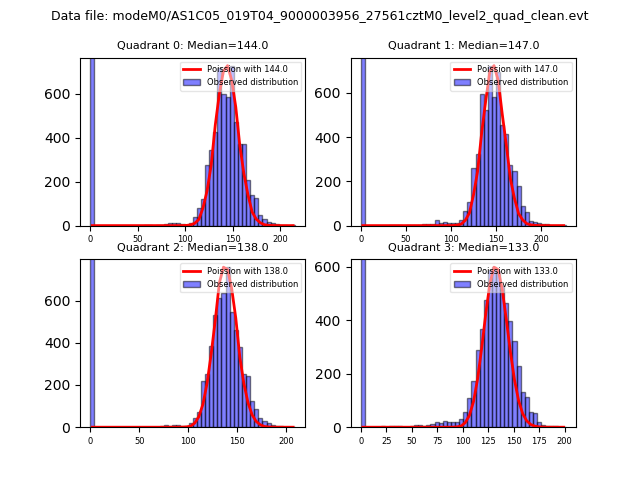 |
 |
| Quadrant-wise count rates Data is divided into 100 sec bins |
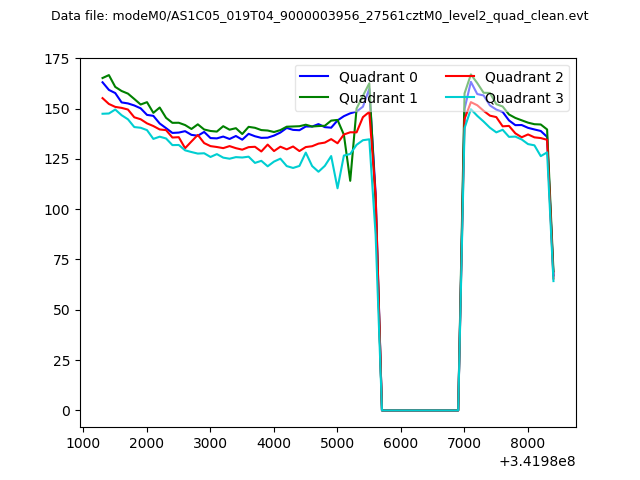 |
|
| Module-wise count rates for Quadrant A Data is divided into 100 sec bins |
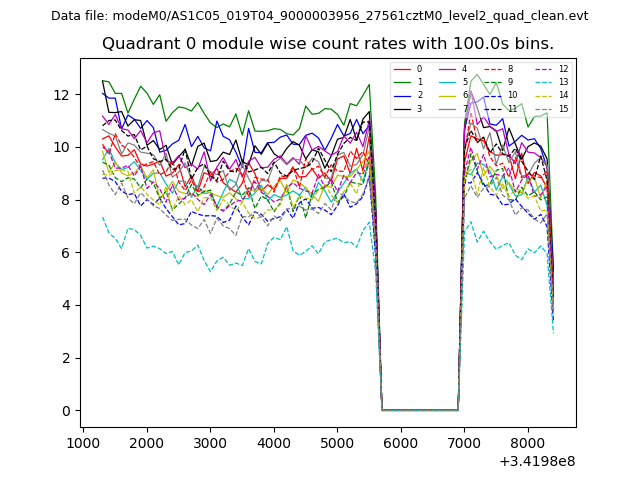 |
 |
| Module-wise count rates for Quadrant B Data is divided into 100 sec bins |
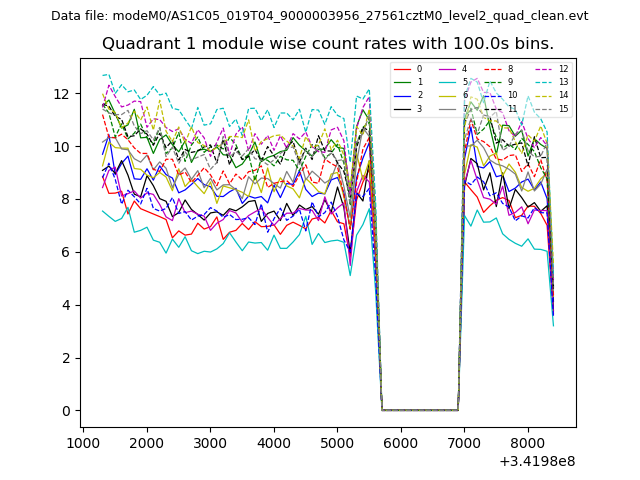 |
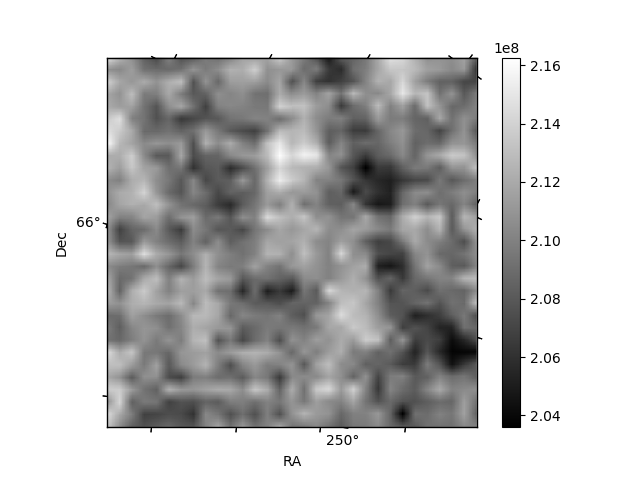 |
| Module-wise count rates for Quadrant C Data is divided into 100 sec bins |
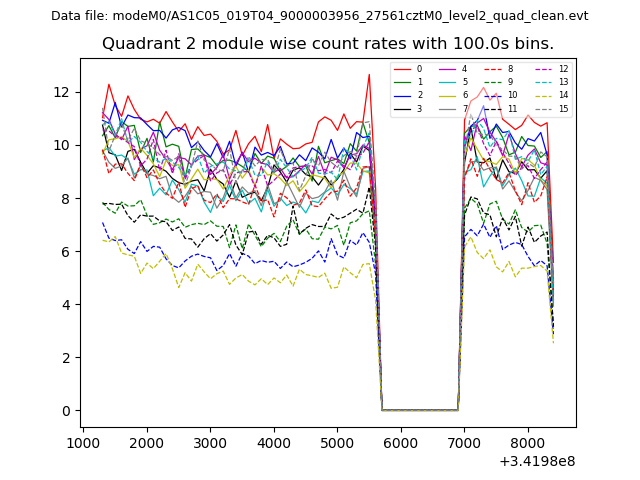 |
 |
| Module-wise count rates for Quadrant D Data is divided into 100 sec bins |
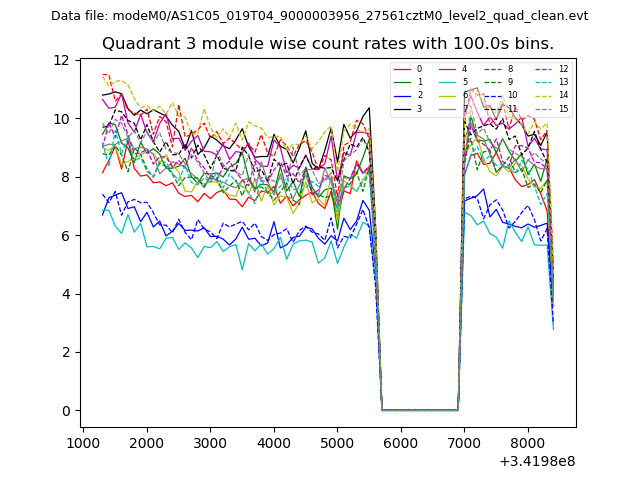 |
 |
| Parameter | Plot |
|---|---|
| CZT HV Monitor | 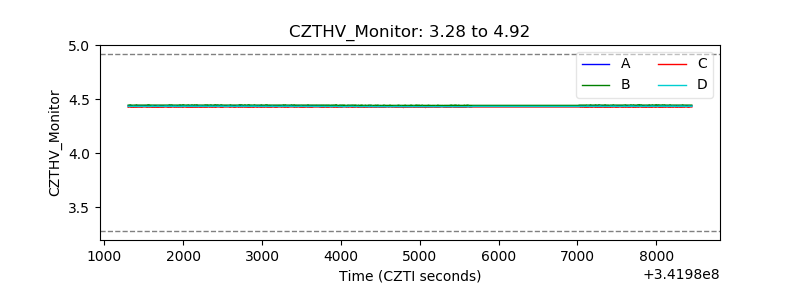 |
| D_VDD | 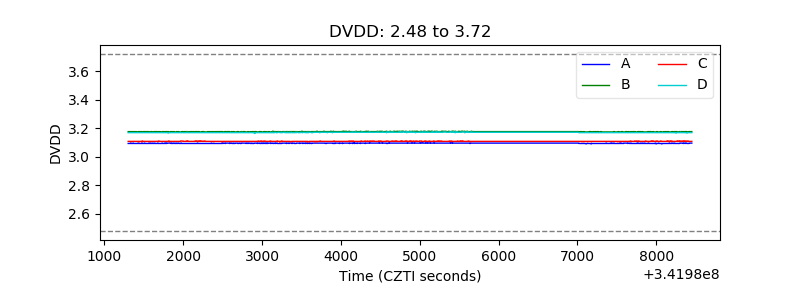 |
| Temperature 1 | 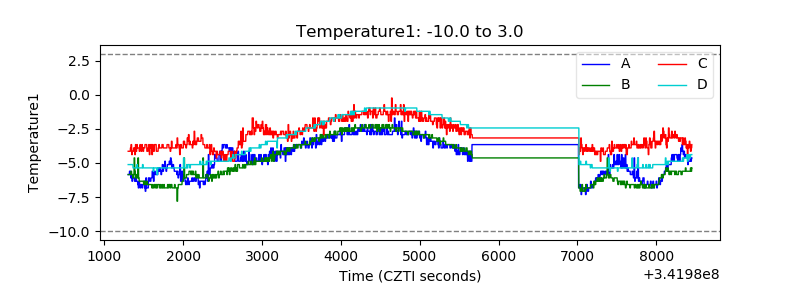 |
| Veto HV Monitor | 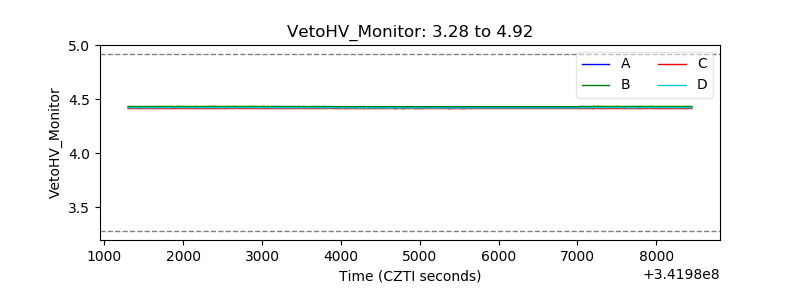 |
| Veto LLD | 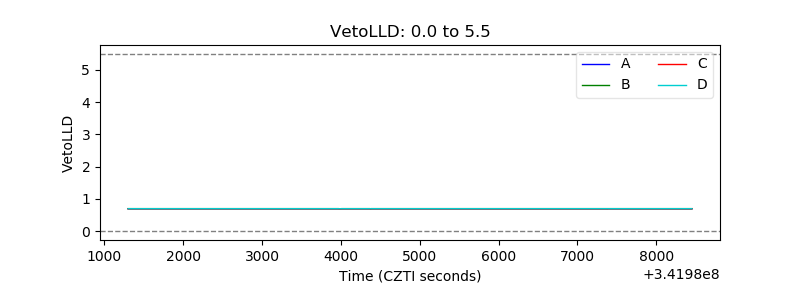 |
| Alpha Counter | 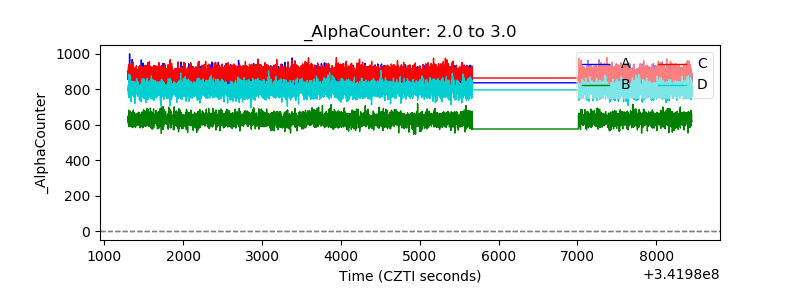 |
| _CPM_Rate | 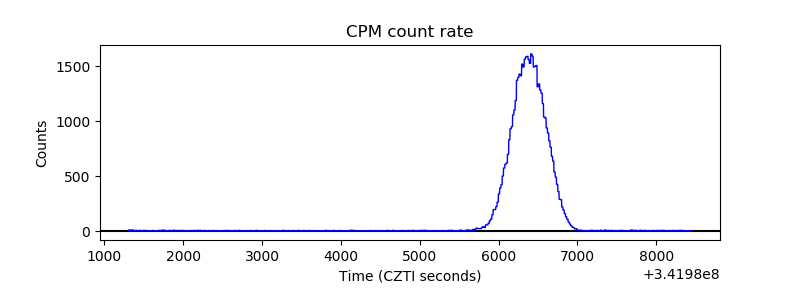 |
| CZT Counter |  |
| +2.5 Volts monitor |  |
| +5 Volts monitor |  |
| _ROLL_ROT | 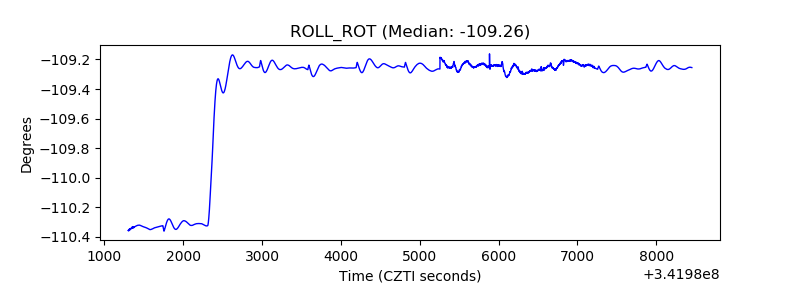 |
| _Roll_DEC | 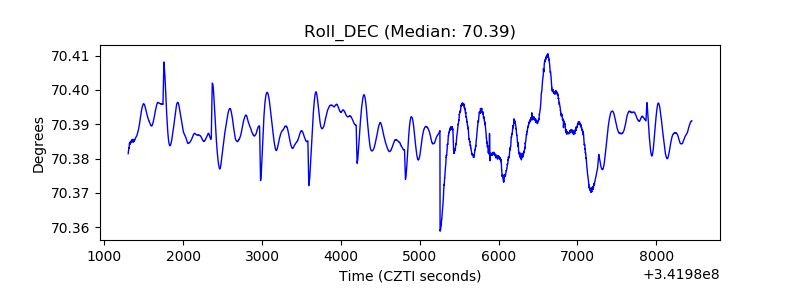 |
| _Roll_RA | 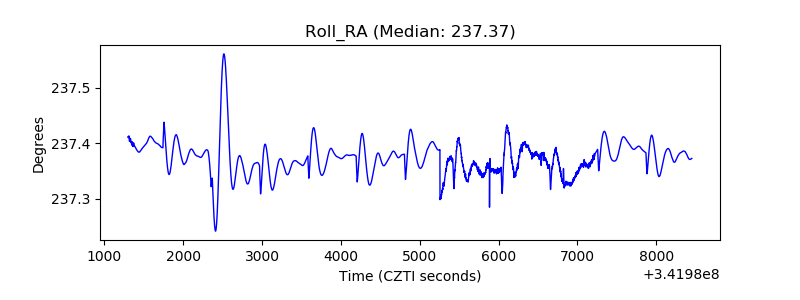 |
| Veto Counter | 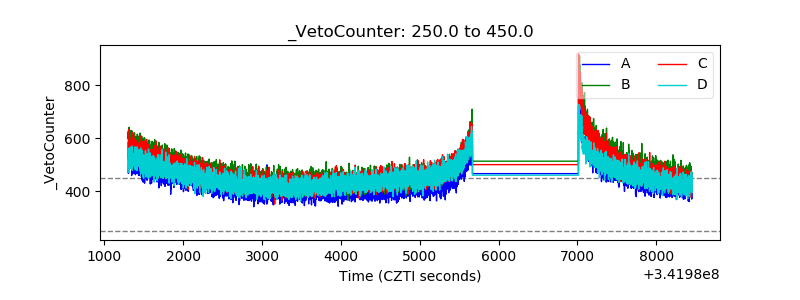 |