| Param | Original file | Final file |
|---|---|---|
| Filename | modeM0/AS1C05_019T04_9000003956_27562cztM0_level2.evt | modeM0/AS1C05_019T04_9000003956_27562cztM0_level2_quad_clean.evt |
| Size (bytes) | 436,282,560 | 112,982,400 |
| Size | 416.1 MB | 107.7 MB |
| Events in quadrant A | 2,910,338 | 767,878 |
| Events in quadrant B | 3,277,053 | 778,423 |
| Events in quadrant C | 2,938,567 | 733,746 |
| Events in quadrant D | 3,668,465 | 712,243 |
| Mode M9 | |||
|---|---|---|---|
| Quadrant | BADHDUFLAG | Total packets | Discarded packets |
| A | 0 | 10 | 0 |
| B | 0 | 10 | 0 |
| C | 0 | 10 | 0 |
| D | 0 | 10 | 0 |
| Mode M0 | |||
|---|---|---|---|
| Quadrant | BADHDUFLAG | Total packets | Discarded packets |
| A | 0 | 12592 | 0 |
| B | 0 | 13592 | 0 |
| C | 0 | 12740 | 0 |
| D | 0 | 14986 | 0 |
| Quadrant | Total seconds | Saturated seconds | Saturation percentage |
|---|---|---|---|
| A | 6150 | 69 | 1.121951% |
| B | 6150 | 152 | 2.471545% |
| C | 6150 | 97 | 1.577236% |
| D | 6150 | 219 | 3.560976% |
Noise dominated data is calculated using 1-second bins in cleaned event files. If a bin has >2000 counts, and if more than 50% of those come from <1% of pixels, then it is considered to be noise-dominated and hence unusable.
| Quadrant | # 1 sec bins | Bins with >0 counts | Bins with >2000 counts | High rate bins dominated by noise | Noise dominated (total time) | Noise dominated (detector-on time) | Marked lightcurve |
|---|---|---|---|---|---|---|---|
| A | 7220 | 6150 | 0 | 0 | 0.00% | 0.00% | 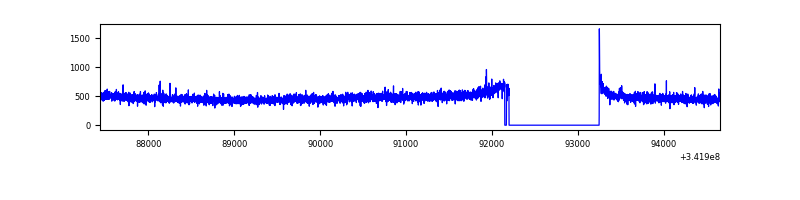 |
| B | 7219 | 6149 | 57 | 57 | 0.79% | 0.93% | 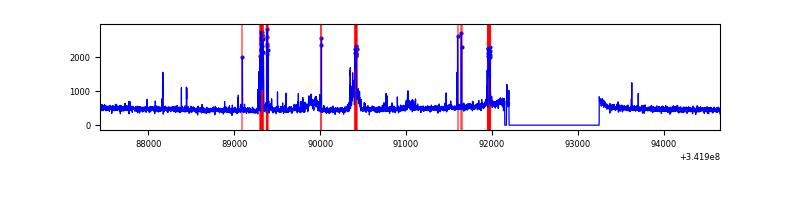 |
| C | 7220 | 6150 | 0 | 0 | 0.00% | 0.00% | 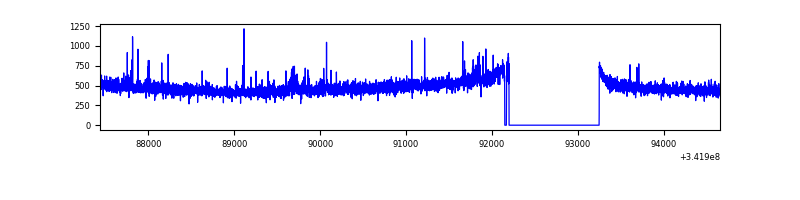 |
| D | 7220 | 6150 | 145 | 145 | 2.01% | 2.36% | 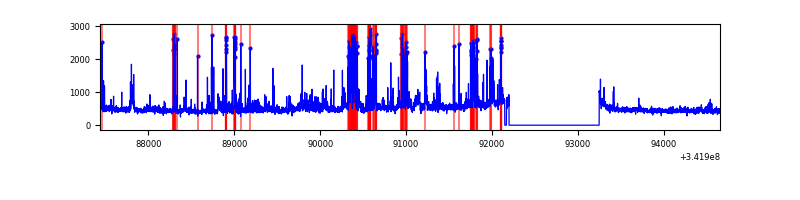 |
Top three noisy pixels from each quadrant. If the there are fewer than three noisy pixels in the level2.evt file, extra rows are filled as -1
| Pixel properties | Quadrant properties | ||||||
|---|---|---|---|---|---|---|---|
| Quadrant | DetID | PixID | Counts | Sigma | Mean | Median | Sigma |
| A | 13 | 254 | 9852 | 61.26 | 751 | 734 | 148.8 |
| A | 3 | 137 | 6982 | 41.98 | 751 | 734 | 148.8 |
| A | 0 | 226 | 6456 | 38.45 | 751 | 734 | 148.8 |
| B | 3 | 64 | 176498 | 1250.51 | 741 | 723 | 140.6 |
| B | 15 | 32 | 99763 | 704.6 | 741 | 723 | 140.6 |
| B | 10 | 245 | 97072 | 685.45 | 741 | 723 | 140.6 |
| C | 14 | 238 | 118326 | 714.42 | 710 | 713 | 164.6 |
| C | 10 | 22 | 30121 | 178.63 | 710 | 713 | 164.6 |
| C | 2 | 16 | 17075 | 99.39 | 710 | 713 | 164.6 |
| D | 1 | 52 | 570964 | 3428.15 | 712 | 693 | 166.3 |
| D | 2 | 250 | 242395 | 1452.98 | 712 | 693 | 166.3 |
| D | 7 | 80 | 95971 | 572.76 | 712 | 693 | 166.3 |
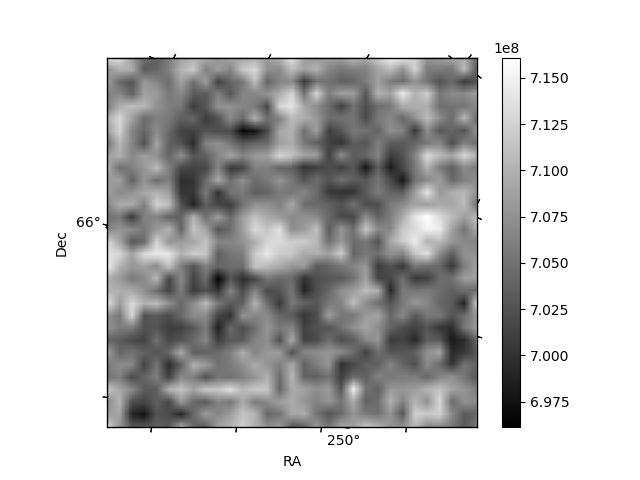
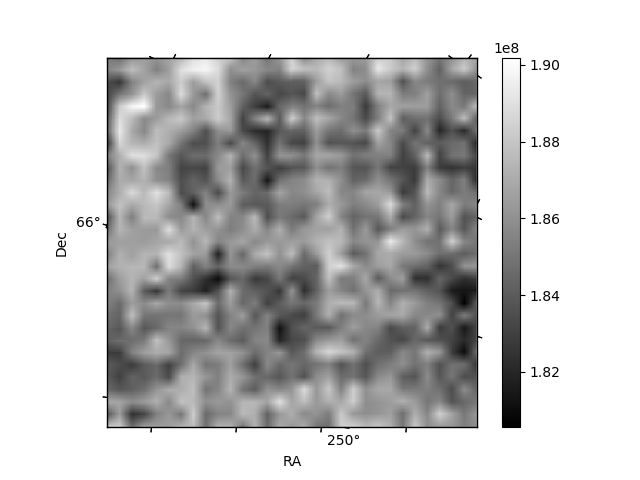
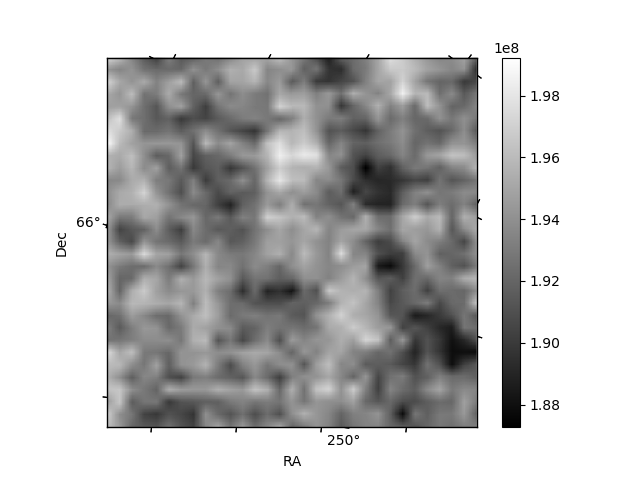
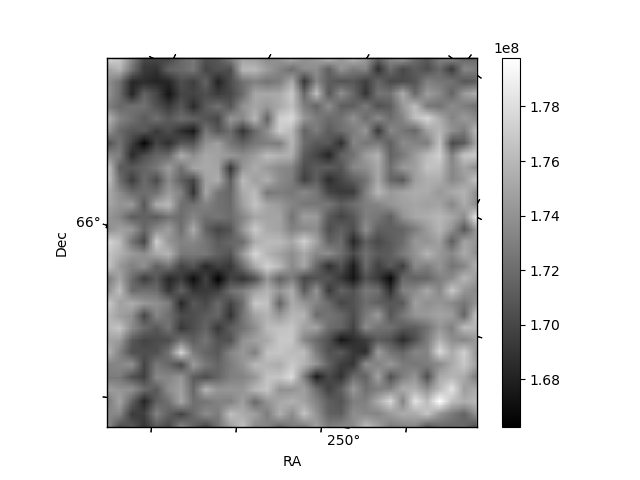
Histogram calculated using DETX and DETY for each event in the final _common_clean file
| Quadrant A | 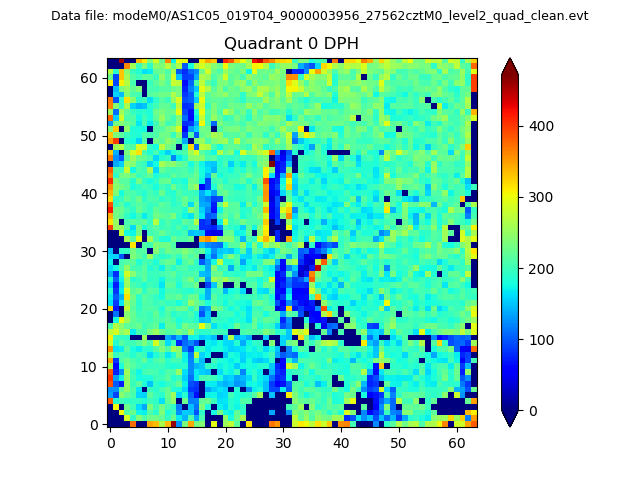 |
 |
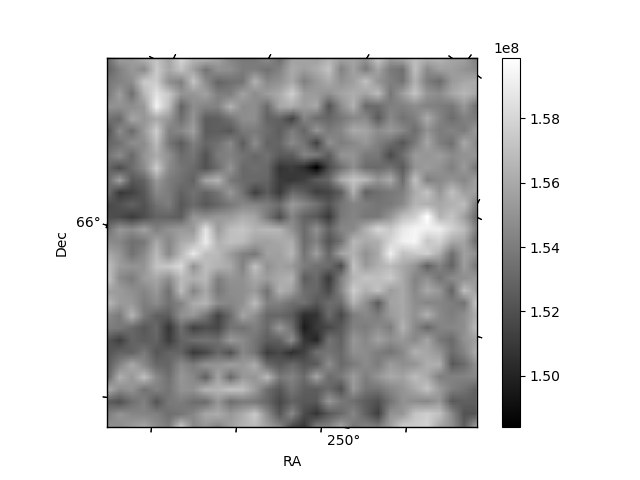
Quadrant B |
|---|---|---|---|
| Quadrant D | 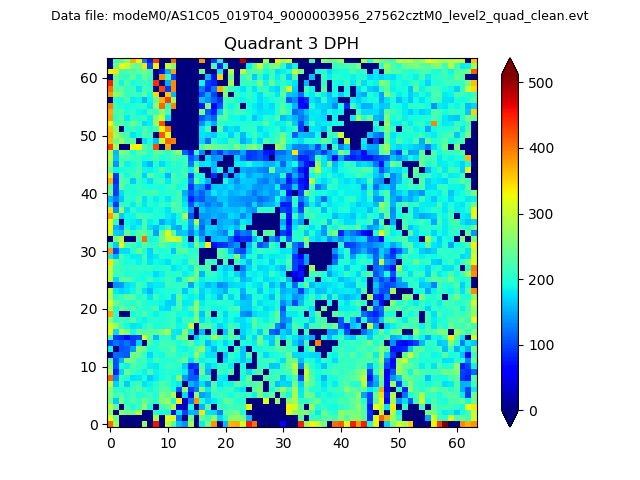 |
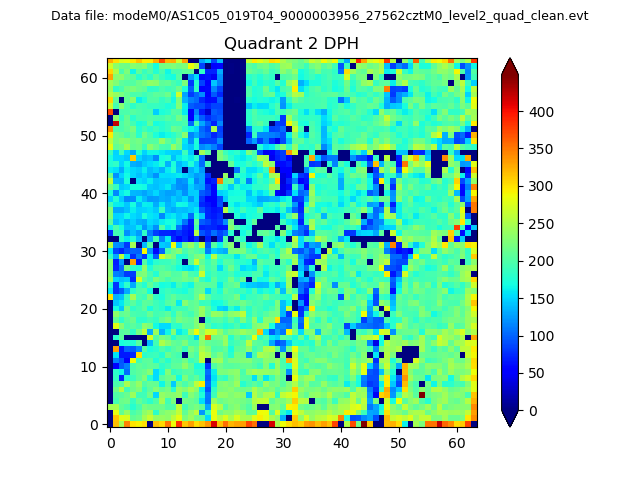 |
Quadrant C |
| Plot type | Count rate plots | Images |
|---|---|---|
| Comparison with Poisson distribution Blue bars denote a histogram of data divided into 1 sec bins. Red curve is a Poisson curve with rate = median count rate of data. |
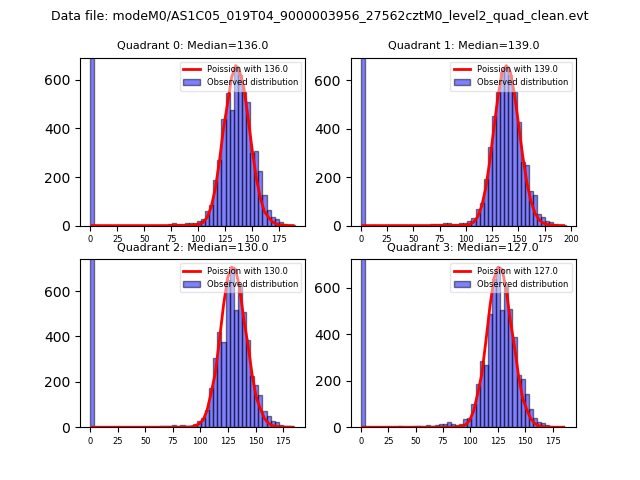 |
 |
| Quadrant-wise count rates Data is divided into 100 sec bins |
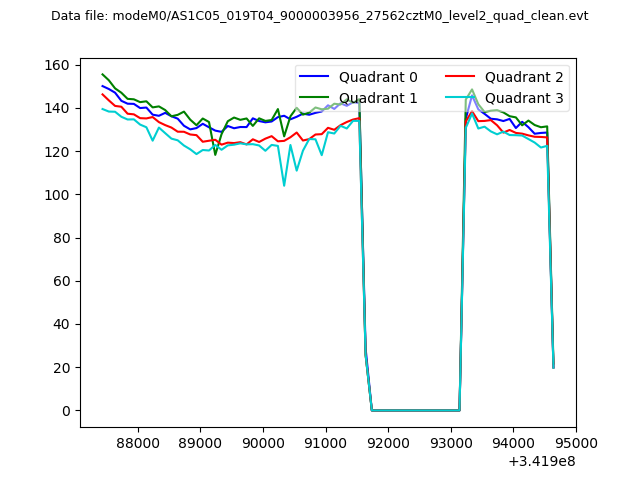 |
|
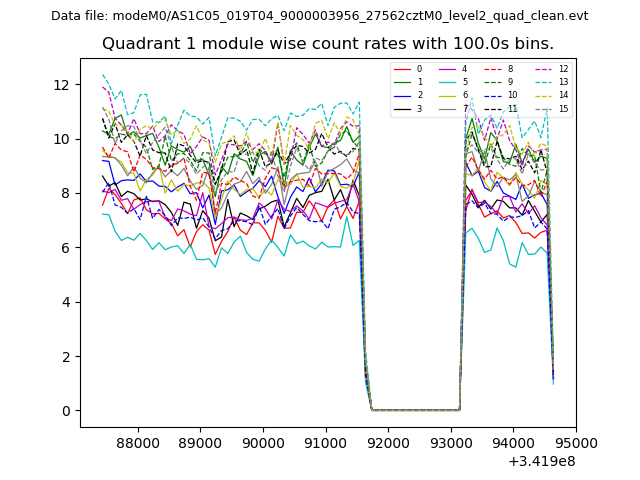
| Module-wise count rates for Quadrant A Data is divided into 100 sec bins |
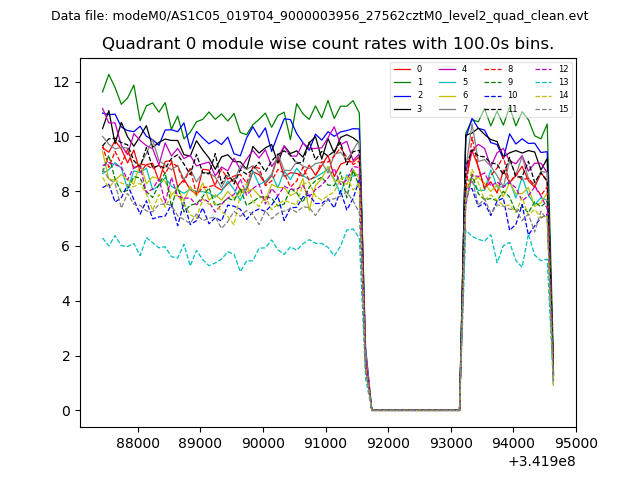 |
 |
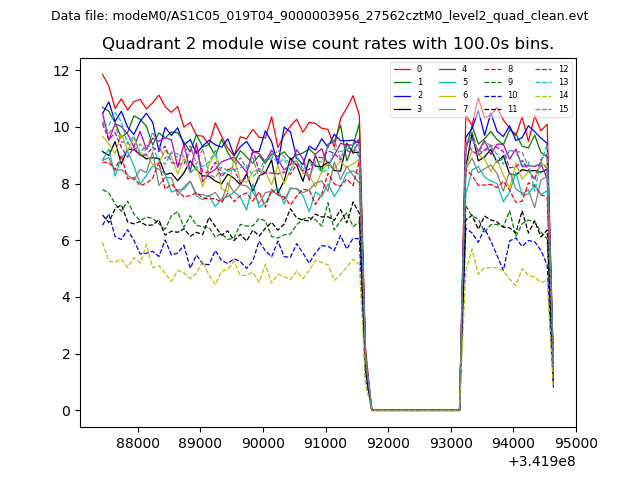
| Module-wise count rates for Quadrant B Data is divided into 100 sec bins |
 |
 |
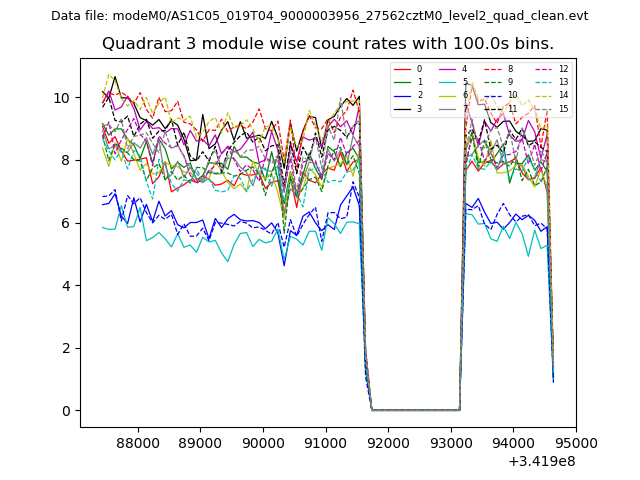
| Module-wise count rates for Quadrant C Data is divided into 100 sec bins |
 |
 |
| Module-wise count rates for Quadrant D Data is divided into 100 sec bins |
 |
 |
| Parameter | Plot |
|---|---|
| CZT HV Monitor |  |
| D_VDD | 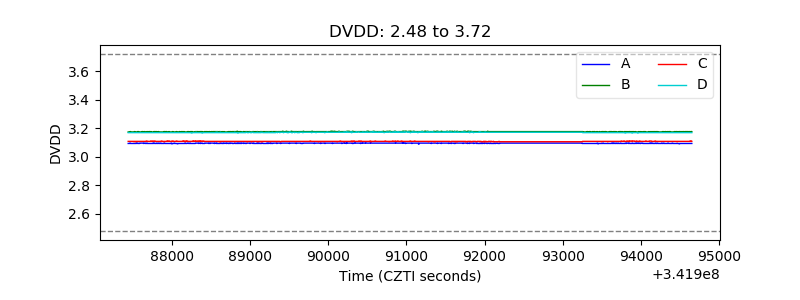 |
| Temperature 1 | 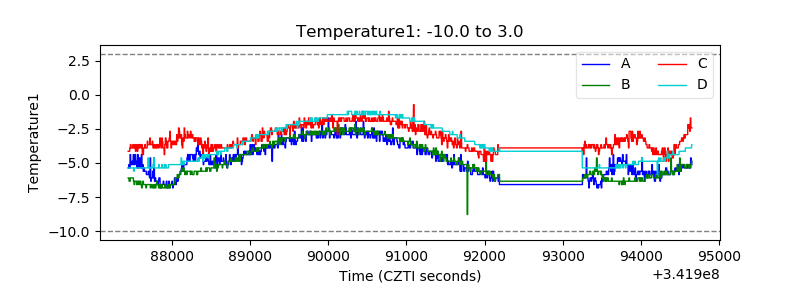 |
| Veto HV Monitor | 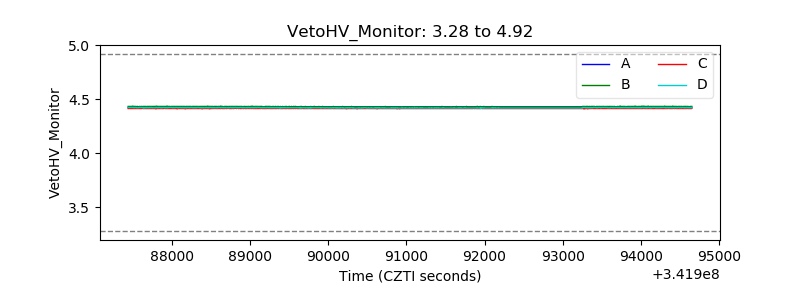 |
| Veto LLD | 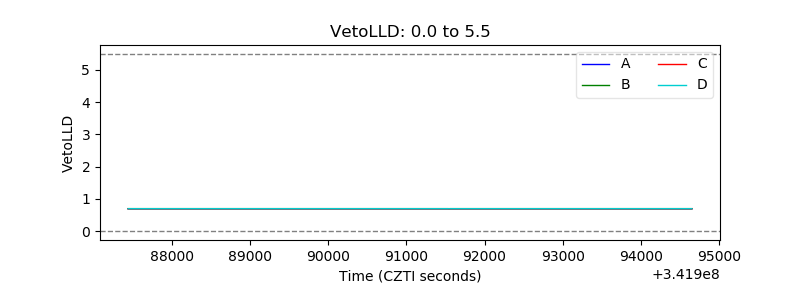 |
| Alpha Counter | 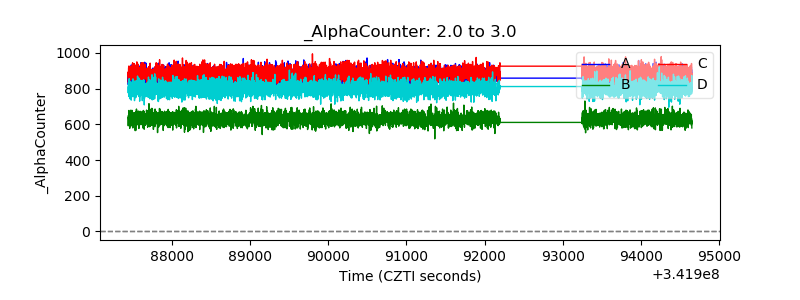 |
| _CPM_Rate | 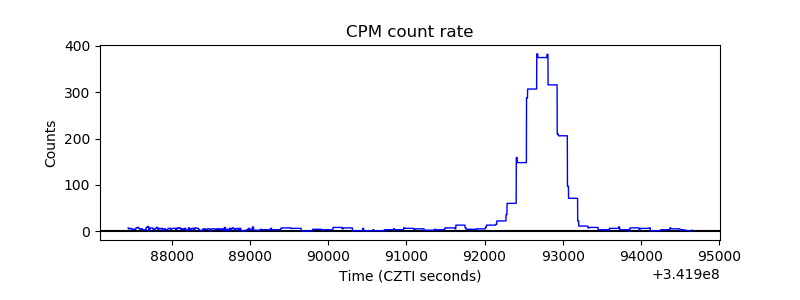 |
| CZT Counter |  |
| +2.5 Volts monitor |  |
| +5 Volts monitor | 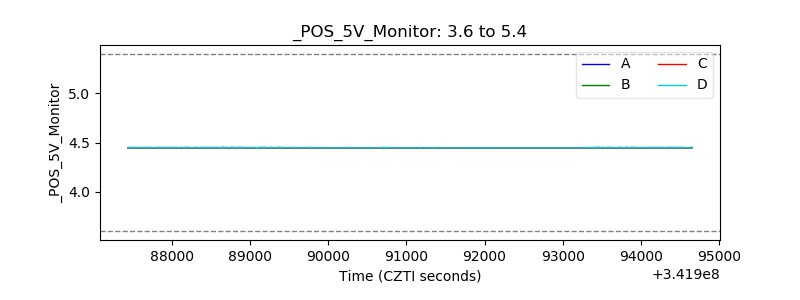 |
| _ROLL_ROT | 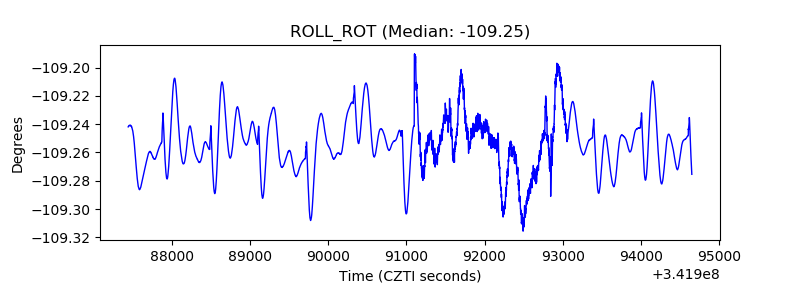 |
| _Roll_DEC | 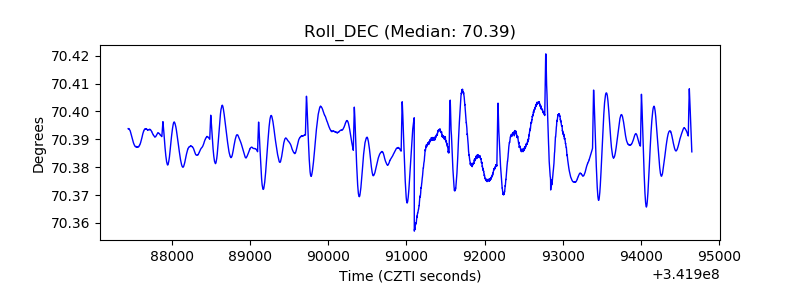 |
| _Roll_RA | 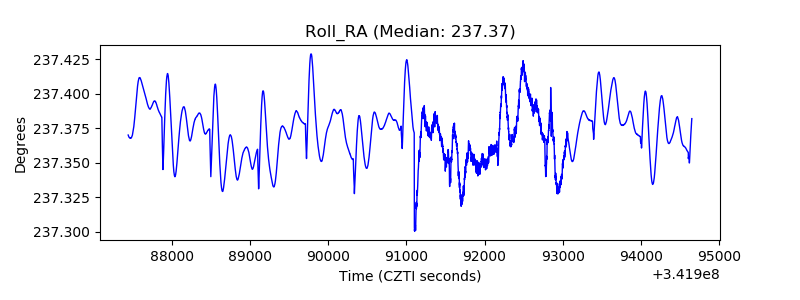 |
| Veto Counter | 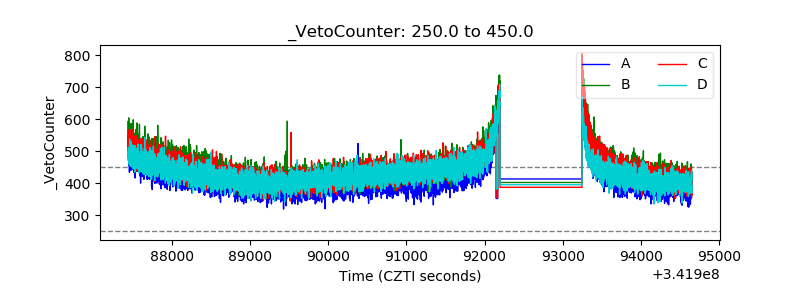 |