| Param | Original file | Final file |
|---|---|---|
| Filename | modeM0/AS1C05_019T04_9000003956_27563cztM0_level2.evt | modeM0/AS1C05_019T04_9000003956_27563cztM0_level2_quad_clean.evt |
| Size (bytes) | 466,424,640 | 106,994,880 |
| Size | 444.8 MB | 102.0 MB |
| Events in quadrant A | 3,511,910 | 710,130 |
| Events in quadrant B | 3,198,292 | 723,859 |
| Events in quadrant C | 3,008,608 | 687,458 |
| Events in quadrant D | 3,966,582 | 666,886 |
| Mode M9 | |||
|---|---|---|---|
| Quadrant | BADHDUFLAG | Total packets | Discarded packets |
| A | 0 | 6 | 0 |
| B | 0 | 6 | 0 |
| C | 0 | 6 | 0 |
| D | 0 | 6 | 0 |
| Mode M0 | |||
|---|---|---|---|
| Quadrant | BADHDUFLAG | Total packets | Discarded packets |
| A | 0 | 14747 | 0 |
| B | 0 | 13701 | 0 |
| C | 0 | 13241 | 0 |
| D | 0 | 16318 | 0 |
| Quadrant | Total seconds | Saturated seconds | Saturation percentage |
|---|---|---|---|
| A | 6470 | 131 | 2.024730% |
| B | 6470 | 112 | 1.731066% |
| C | 6471 | 80 | 1.236285% |
| D | 6471 | 188 | 2.905270% |
Noise dominated data is calculated using 1-second bins in cleaned event files. If a bin has >2000 counts, and if more than 50% of those come from <1% of pixels, then it is considered to be noise-dominated and hence unusable.
| Quadrant | # 1 sec bins | Bins with >0 counts | Bins with >2000 counts | High rate bins dominated by noise | Noise dominated (total time) | Noise dominated (detector-on time) | Marked lightcurve |
|---|---|---|---|---|---|---|---|
| A | 7155 | 6470 | 17 | 17 | 0.24% | 0.26% |  |
| B | 7155 | 6471 | 9 | 9 | 0.13% | 0.14% |  |
| C | 7156 | 6472 | 1 | 1 | 0.01% | 0.02% |  |
| D | 7156 | 6472 | 124 | 124 | 1.73% | 1.92% | 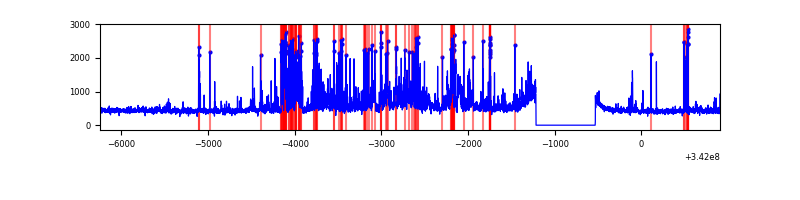 |
Top three noisy pixels from each quadrant. If the there are fewer than three noisy pixels in the level2.evt file, extra rows are filled as -1
| Pixel properties | Quadrant properties | ||||||
|---|---|---|---|---|---|---|---|
| Quadrant | DetID | PixID | Counts | Sigma | Mean | Median | Sigma |
| A | 15 | 174 | 527072 | 3401.98 | 769 | 753 | 154.7 |
| A | 6 | 16 | 11652 | 70.45 | 769 | 753 | 154.7 |
| A | 13 | 254 | 10233 | 61.28 | 769 | 753 | 154.7 |
| B | 10 | 245 | 95524 | 654.41 | 763 | 744 | 144.8 |
| B | 15 | 32 | 78845 | 539.25 | 763 | 744 | 144.8 |
| B | 3 | 64 | 33009 | 222.77 | 763 | 744 | 144.8 |
| C | 14 | 238 | 121150 | 702.57 | 733 | 736 | 171.4 |
| C | 10 | 22 | 9969 | 53.87 | 733 | 736 | 171.4 |
| C | 2 | 16 | 9078 | 48.67 | 733 | 736 | 171.4 |
| D | 1 | 52 | 974593 | 5539.8 | 737 | 717 | 175.8 |
| D | 2 | 250 | 76565 | 431.45 | 737 | 717 | 175.8 |
| D | 7 | 80 | 54038 | 303.31 | 737 | 717 | 175.8 |
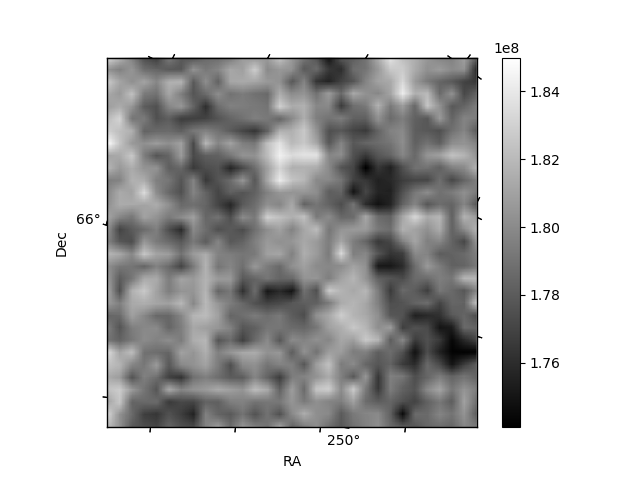
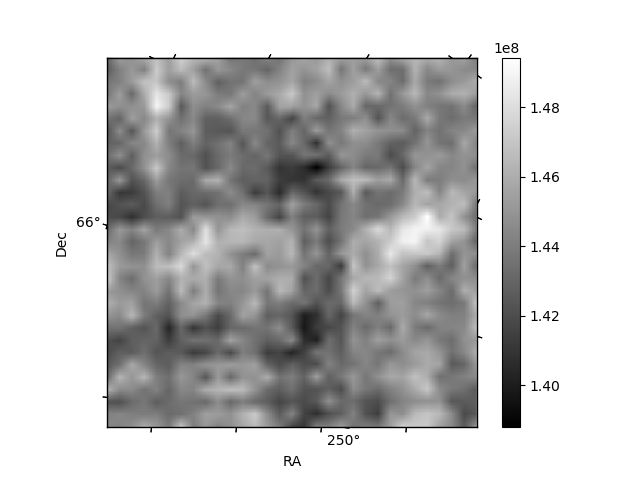
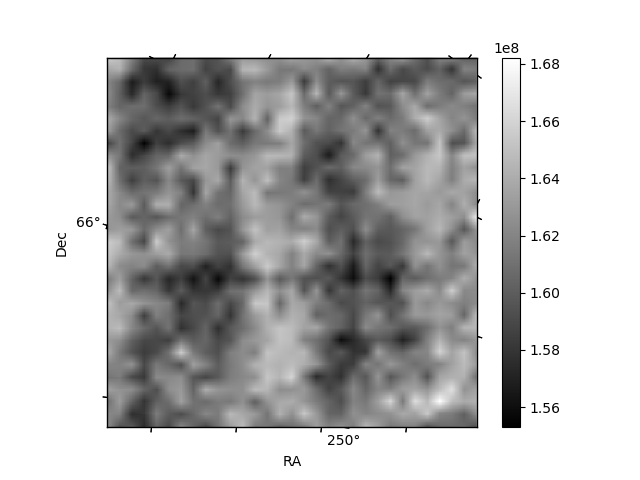
Histogram calculated using DETX and DETY for each event in the final _common_clean file
| Quadrant A | 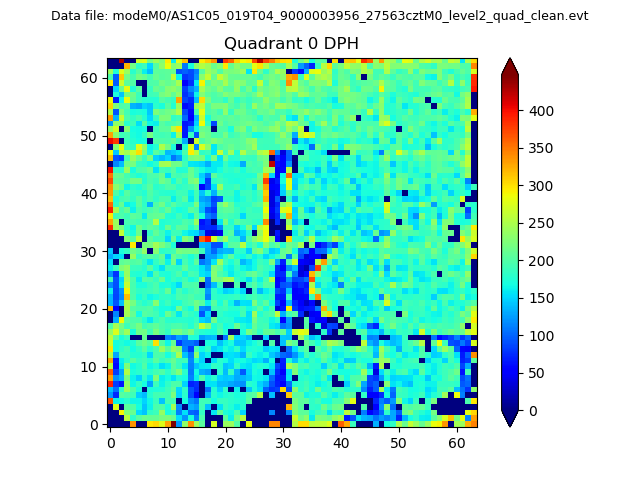 |
 |
Quadrant B |
|---|---|---|---|
| Quadrant D | 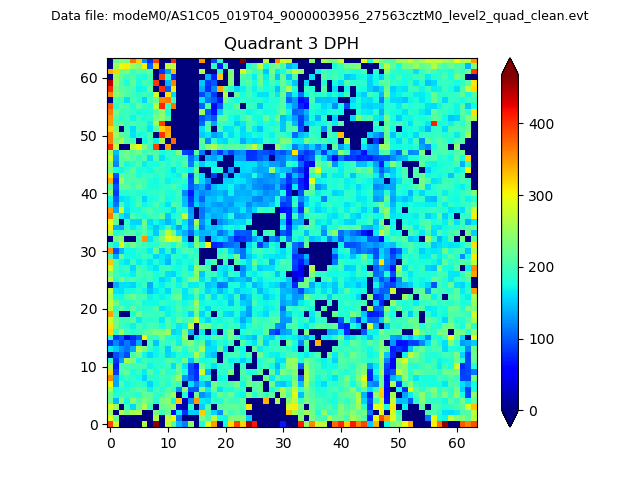 |
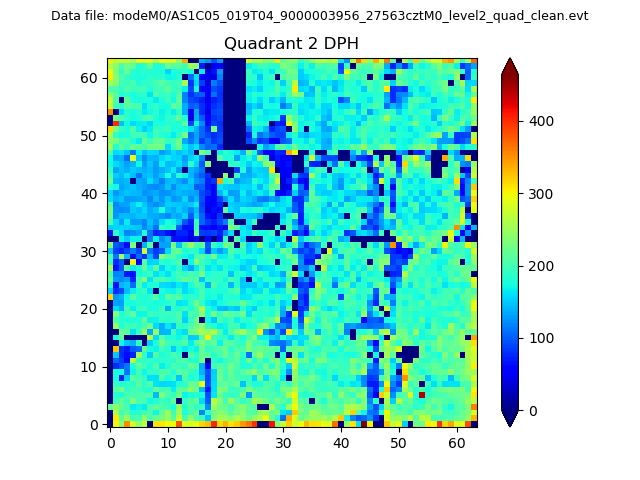 |
Quadrant C |
| Plot type | Count rate plots | Images |
|---|---|---|
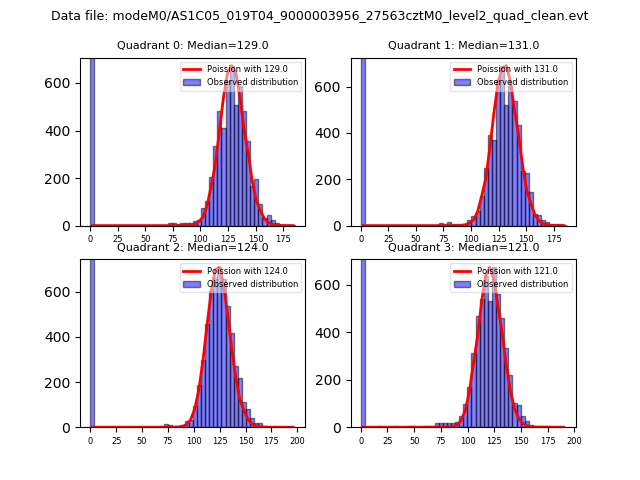
| Comparison with Poisson distribution Blue bars denote a histogram of data divided into 1 sec bins. Red curve is a Poisson curve with rate = median count rate of data. |
 |
 |
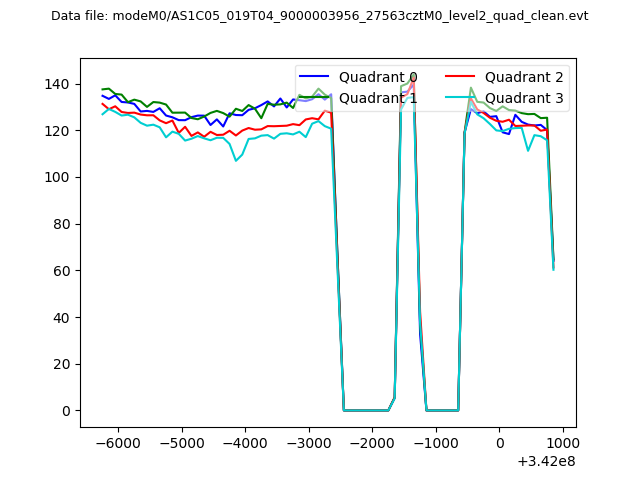
| Quadrant-wise count rates Data is divided into 100 sec bins |
 |
|
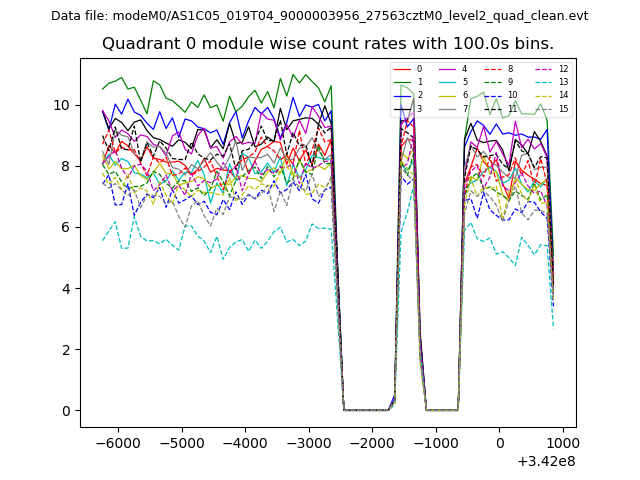
| Module-wise count rates for Quadrant A Data is divided into 100 sec bins |
 |
 |
| Module-wise count rates for Quadrant B Data is divided into 100 sec bins |
 |
 |
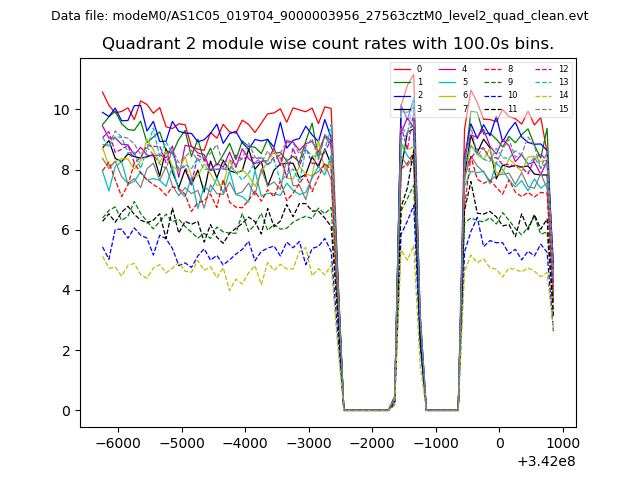
| Module-wise count rates for Quadrant C Data is divided into 100 sec bins |
 |
 |
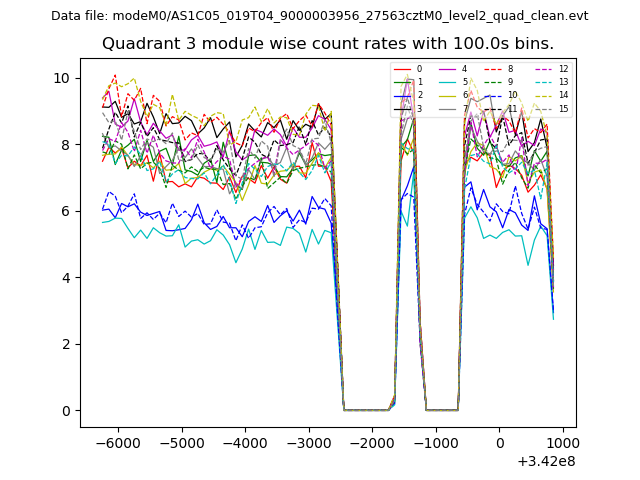
| Module-wise count rates for Quadrant D Data is divided into 100 sec bins |
 |
 |
| Parameter | Plot |
|---|---|
| CZT HV Monitor | 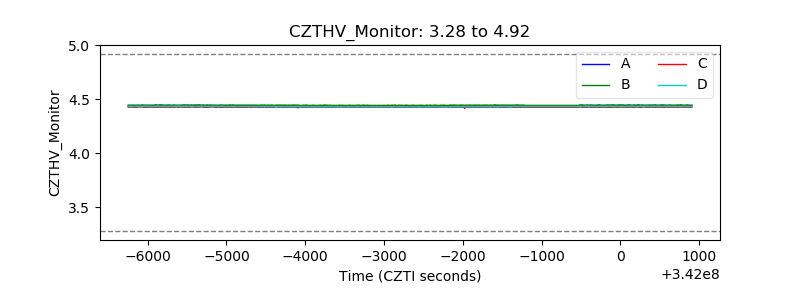 |
| D_VDD | 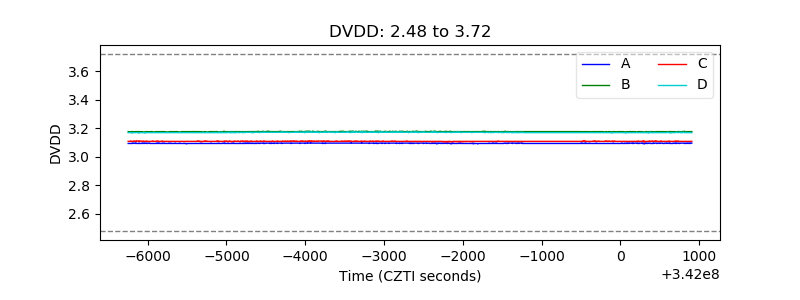 |
| Temperature 1 | 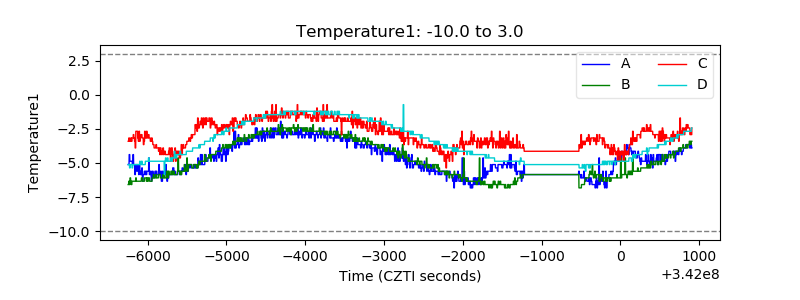 |
| Veto HV Monitor | 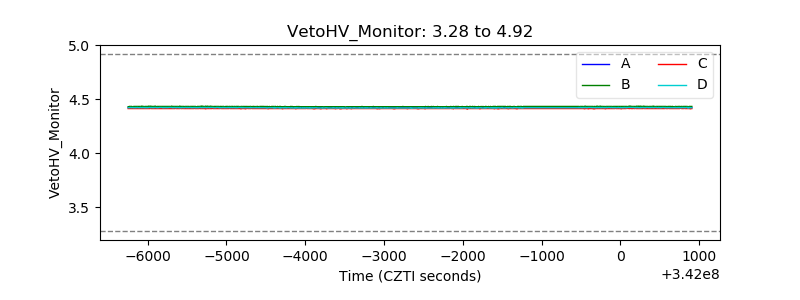 |
| Veto LLD | 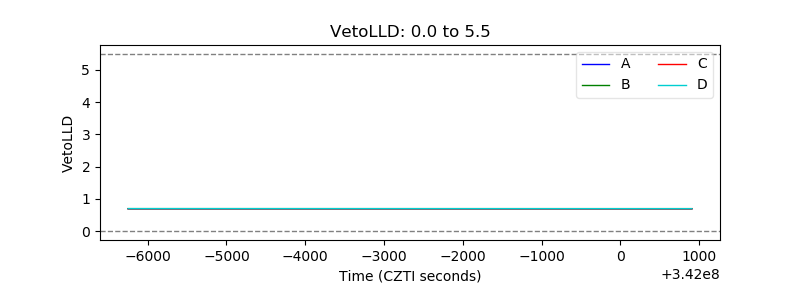 |
| Alpha Counter |  |
| _CPM_Rate | 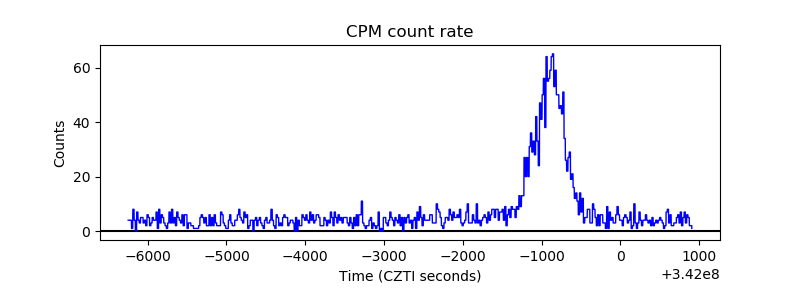 |
| CZT Counter |  |
| +2.5 Volts monitor |  |
| +5 Volts monitor |  |
| _ROLL_ROT | 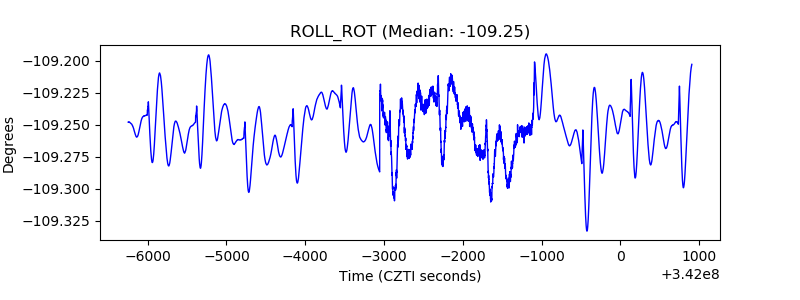 |
| _Roll_DEC | 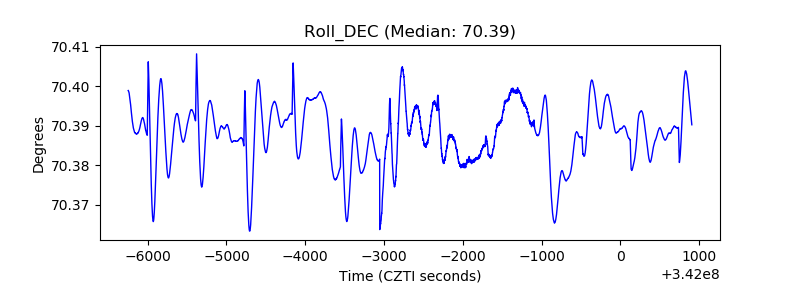 |
| _Roll_RA | 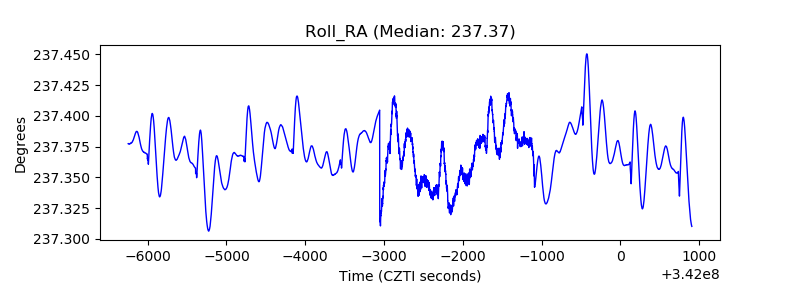 |
| Veto Counter |  |