| Param | Original file | Final file |
|---|---|---|
| Filename | modeM0/AS1C05_019T04_9000003956_27564cztM0_level2.evt | modeM0/AS1C05_019T04_9000003956_27564cztM0_level2_quad_clean.evt |
| Size (bytes) | 523,048,320 | 118,411,200 |
| Size | 498.8 MB | 112.9 MB |
| Events in quadrant A | 4,180,024 | 781,609 |
| Events in quadrant B | 3,728,730 | 802,857 |
| Events in quadrant C | 3,360,788 | 762,407 |
| Events in quadrant D | 4,084,319 | 740,327 |
| Mode M9 | |||
|---|---|---|---|
| Quadrant | BADHDUFLAG | Total packets | Discarded packets |
| A | 0 | 1 | 0 |
| B | 0 | 1 | 0 |
| C | 0 | 1 | 0 |
| D | 0 | 1 | 0 |
| Mode M0 | |||
|---|---|---|---|
| Quadrant | BADHDUFLAG | Total packets | Discarded packets |
| A | 0 | 17270 | 0 |
| B | 0 | 15689 | 0 |
| C | 0 | 14811 | 0 |
| D | 0 | 17017 | 0 |
| Quadrant | Total seconds | Saturated seconds | Saturation percentage |
|---|---|---|---|
| A | 7160 | 343 | 4.790503% |
| B | 7161 | 244 | 3.407345% |
| C | 7161 | 212 | 2.960480% |
| D | 7161 | 275 | 3.840246% |
Noise dominated data is calculated using 1-second bins in cleaned event files. If a bin has >2000 counts, and if more than 50% of those come from <1% of pixels, then it is considered to be noise-dominated and hence unusable.
| Quadrant | # 1 sec bins | Bins with >0 counts | Bins with >2000 counts | High rate bins dominated by noise | Noise dominated (total time) | Noise dominated (detector-on time) | Marked lightcurve |
|---|---|---|---|---|---|---|---|
| A | 7255 | 7161 | 123 | 123 | 1.70% | 1.72% | 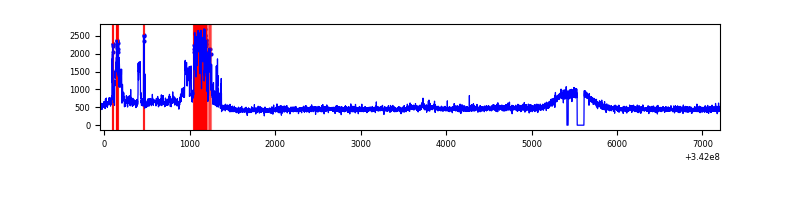 |
| B | 7256 | 7161 | 24 | 24 | 0.33% | 0.34% | 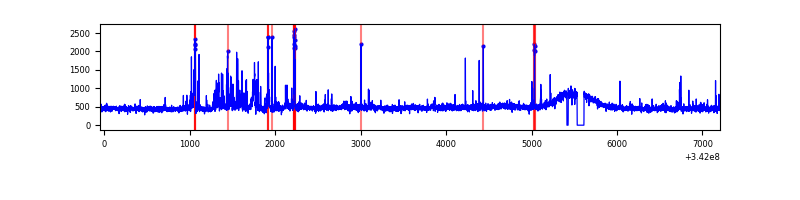 |
| C | 7256 | 7162 | 0 | 0 | 0.00% | 0.00% | 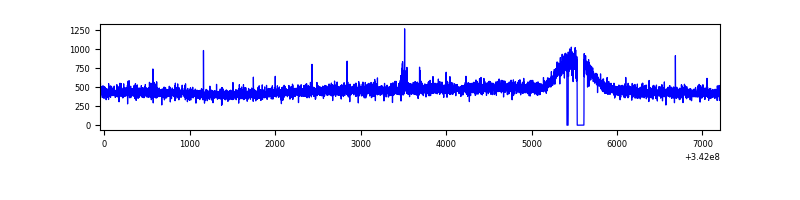 |
| D | 7256 | 7162 | 79 | 79 | 1.09% | 1.10% | 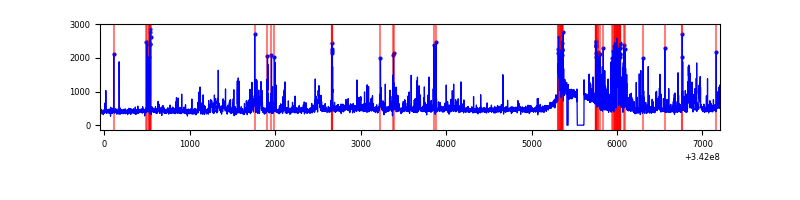 |
Top three noisy pixels from each quadrant. If the there are fewer than three noisy pixels in the level2.evt file, extra rows are filled as -1
| Pixel properties | Quadrant properties | ||||||
|---|---|---|---|---|---|---|---|
| Quadrant | DetID | PixID | Counts | Sigma | Mean | Median | Sigma |
| A | 15 | 174 | 828844 | 4725.53 | 865 | 845 | 175.2 |
| A | 6 | 16 | 14150 | 75.93 | 865 | 845 | 175.2 |
| A | 13 | 254 | 11690 | 61.89 | 865 | 845 | 175.2 |
| B | 10 | 245 | 302466 | 1828.17 | 856 | 835 | 165.0 |
| B | 3 | 64 | 38967 | 231.12 | 856 | 835 | 165.0 |
| B | 12 | 111 | 20522 | 119.32 | 856 | 835 | 165.0 |
| C | 14 | 238 | 134206 | 679.4 | 825 | 824 | 196.3 |
| C | 10 | 22 | 9754 | 45.49 | 825 | 824 | 196.3 |
| C | 13 | 61 | 5739 | 25.04 | 825 | 824 | 196.3 |
| D | 1 | 52 | 562394 | 2842.45 | 831 | 807 | 197.6 |
| D | 7 | 80 | 160864 | 810.12 | 831 | 807 | 197.6 |
| D | 12 | 227 | 90065 | 451.78 | 831 | 807 | 197.6 |
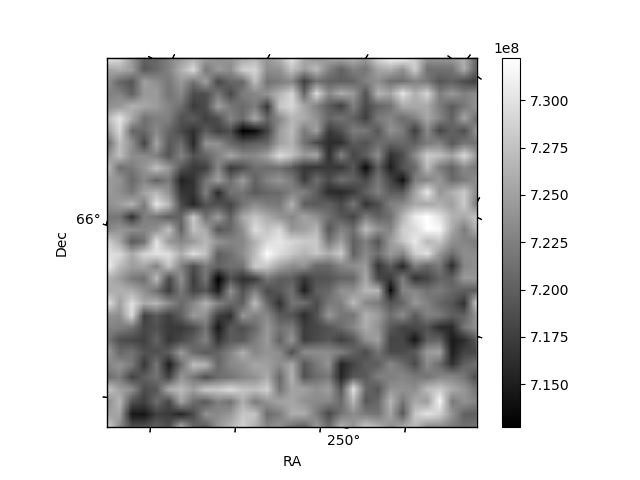
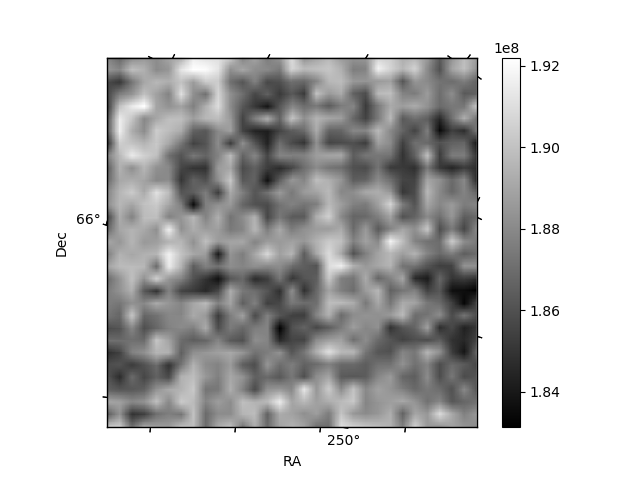
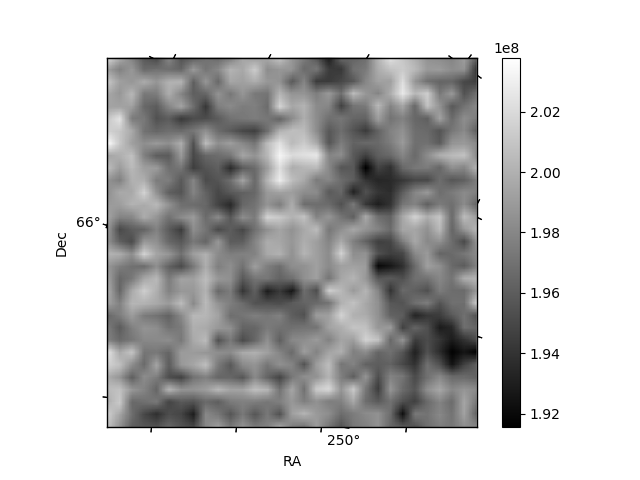
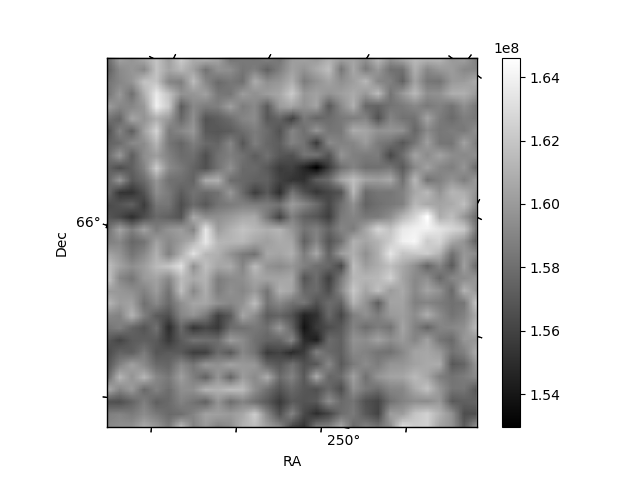
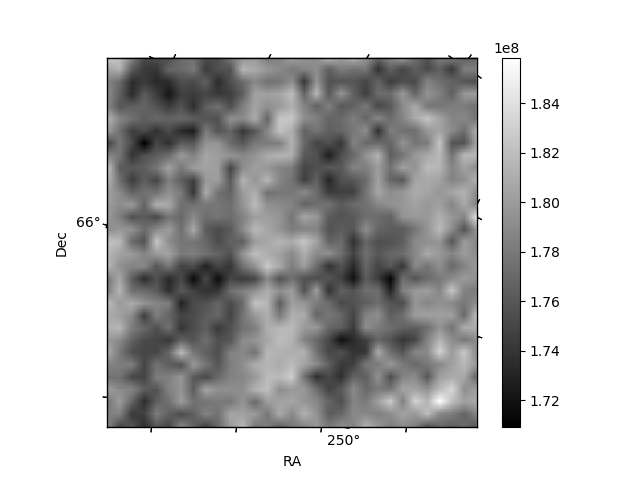
Histogram calculated using DETX and DETY for each event in the final _common_clean file
| Quadrant A | 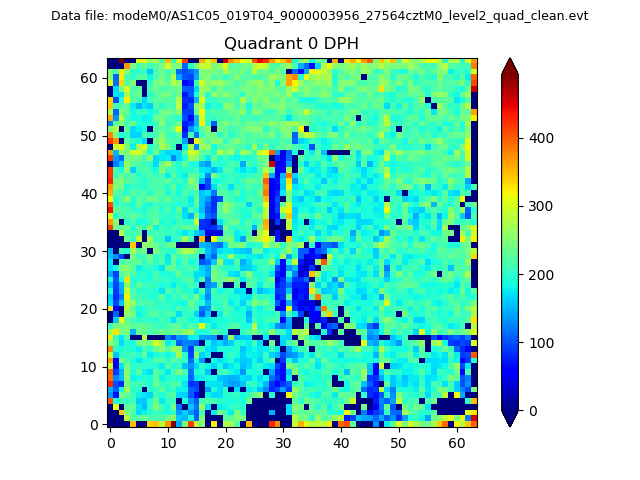 |
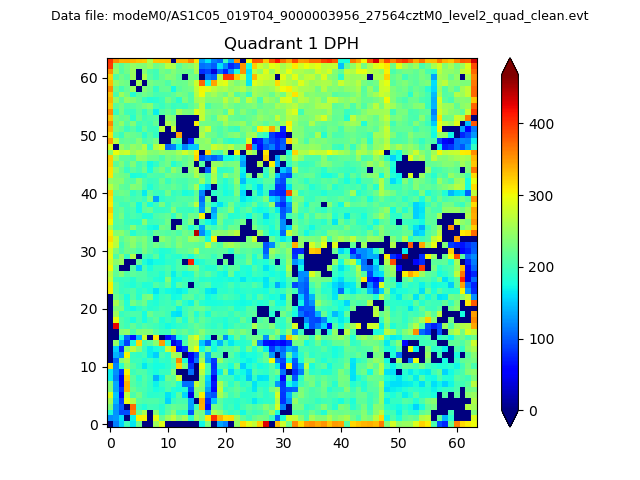 |
Quadrant B |
|---|---|---|---|
| Quadrant D |  |
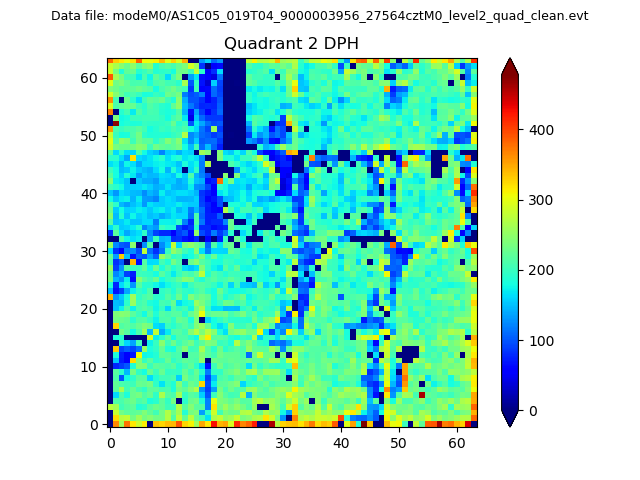 |
Quadrant C |
| Plot type | Count rate plots | Images |
|---|---|---|
| Comparison with Poisson distribution Blue bars denote a histogram of data divided into 1 sec bins. Red curve is a Poisson curve with rate = median count rate of data. |
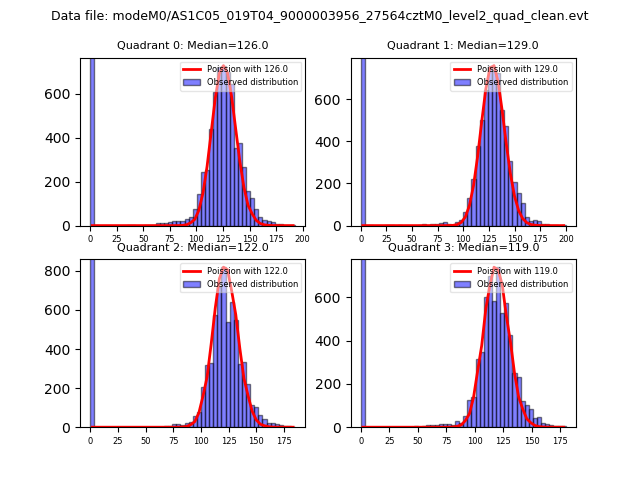 |
 |
| Quadrant-wise count rates Data is divided into 100 sec bins |
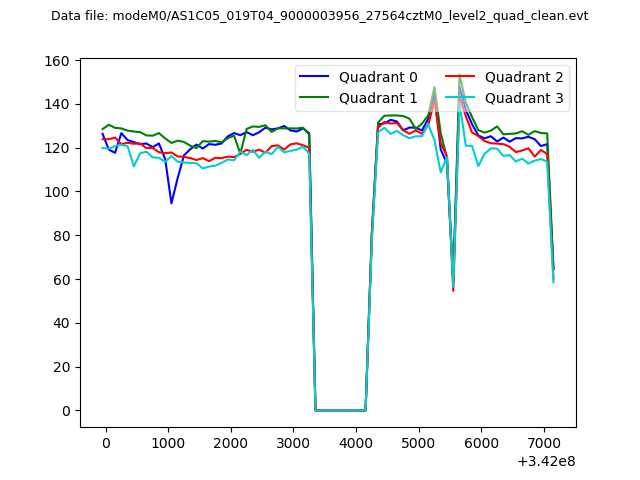 |
|
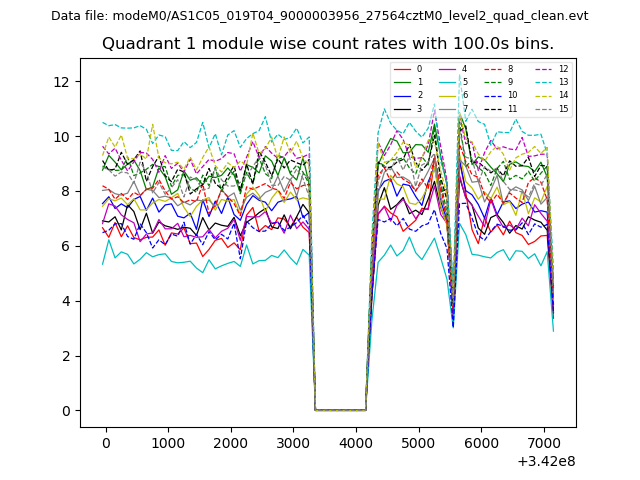
| Module-wise count rates for Quadrant A Data is divided into 100 sec bins |
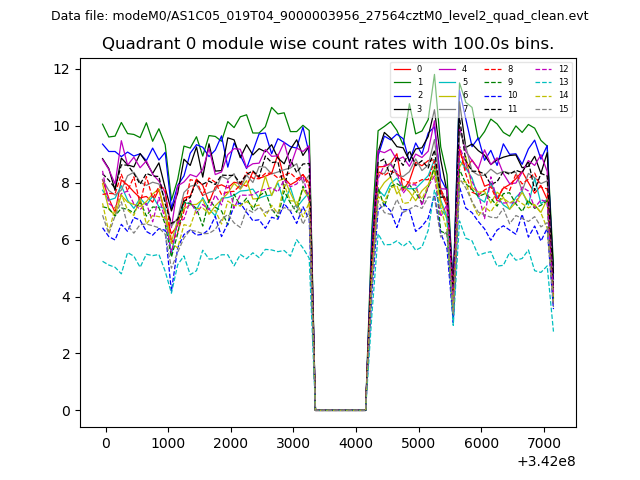 |
 |
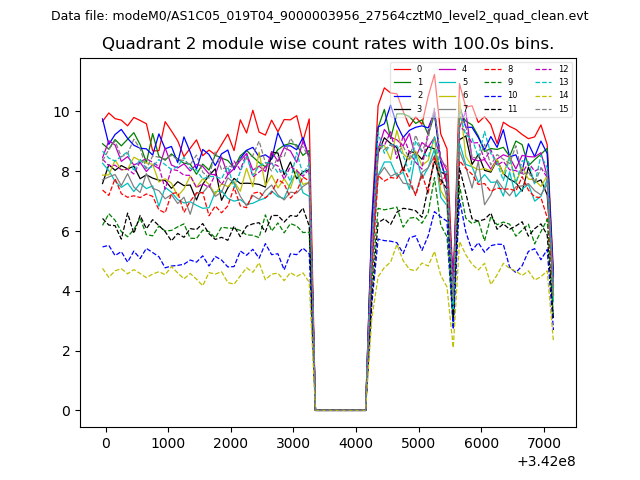
| Module-wise count rates for Quadrant B Data is divided into 100 sec bins |
 |
 |
| Module-wise count rates for Quadrant C Data is divided into 100 sec bins |
 |
 |
| Module-wise count rates for Quadrant D Data is divided into 100 sec bins |
 |
 |
| Parameter | Plot |
|---|---|
| CZT HV Monitor | 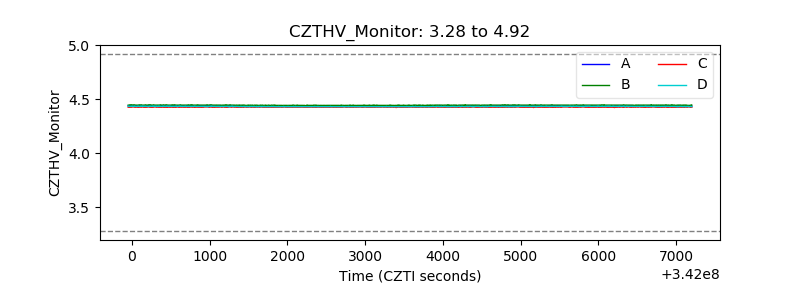 |
| D_VDD | 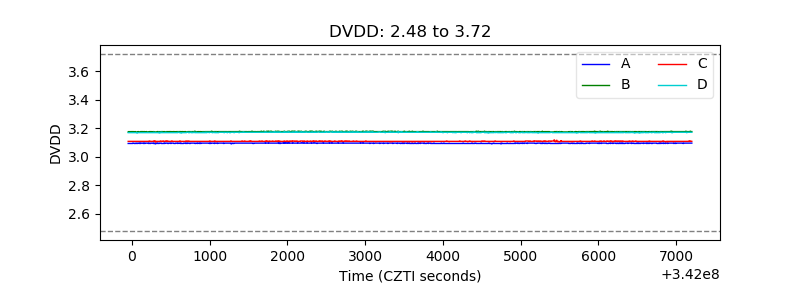 |
| Temperature 1 | 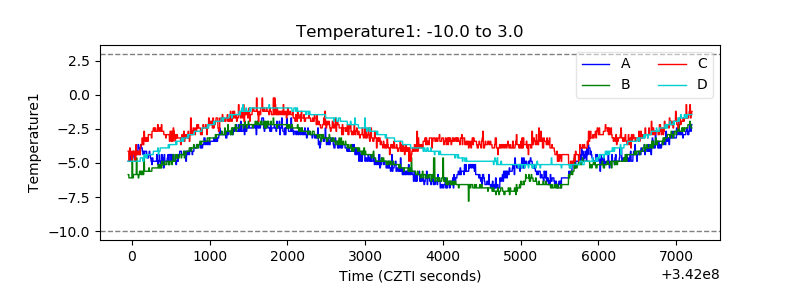 |
| Veto HV Monitor | 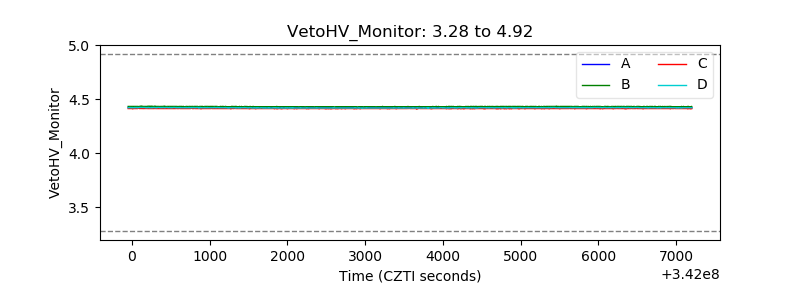 |
| Veto LLD | 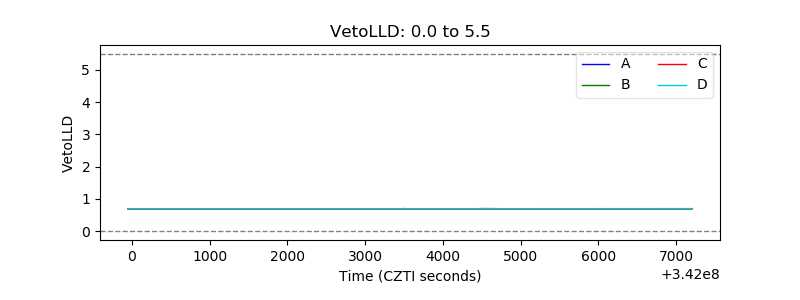 |
| Alpha Counter |  |
| _CPM_Rate | 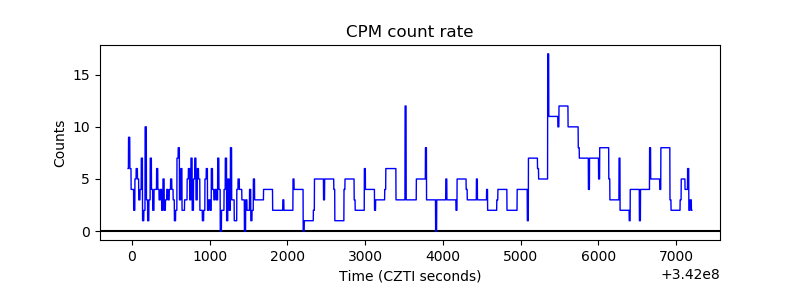 |
| CZT Counter | 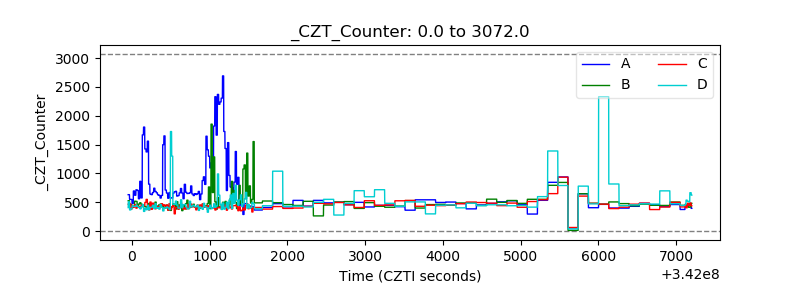 |
| +2.5 Volts monitor |  |
| +5 Volts monitor |  |
| _ROLL_ROT | 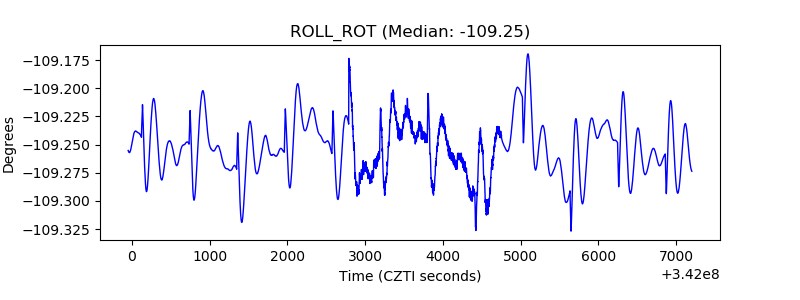 |
| _Roll_DEC | 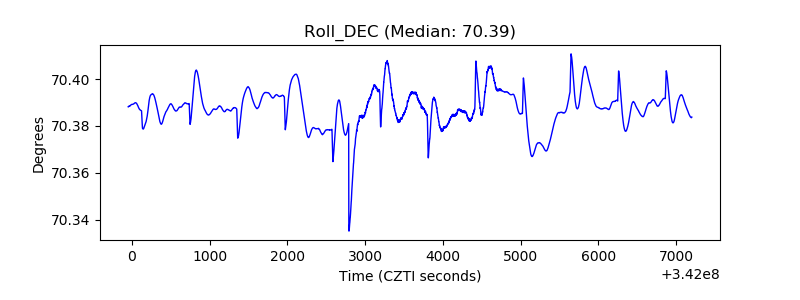 |
| _Roll_RA | 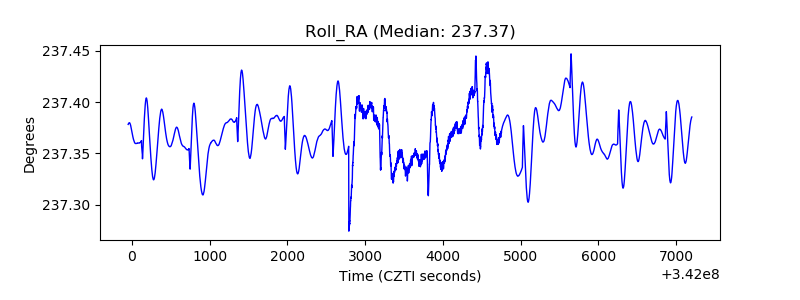 |
| Veto Counter | 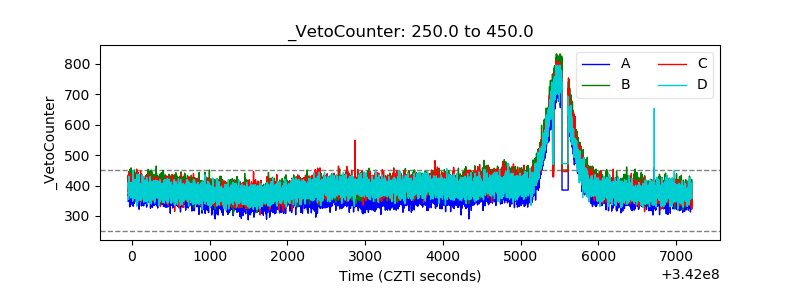 |