| Param | Original file | Final file |
|---|---|---|
| Filename | modeM0/AS1C05_019T04_9000003956_27565cztM0_level2.evt | modeM0/AS1C05_019T04_9000003956_27565cztM0_level2_quad_clean.evt |
| Size (bytes) | 606,159,360 | 125,254,080 |
| Size | 578.1 MB | 119.5 MB |
| Events in quadrant A | 3,546,356 | 840,464 |
| Events in quadrant B | 3,915,184 | 850,128 |
| Events in quadrant C | 3,552,456 | 808,018 |
| Events in quadrant D | 6,829,044 | 766,690 |
| Mode M0 | |||
|---|---|---|---|
| Quadrant | BADHDUFLAG | Total packets | Discarded packets |
| A | 0 | 15658 | 0 |
| B | 0 | 16624 | 0 |
| C | 0 | 15662 | 0 |
| D | 0 | 25465 | 0 |
| Quadrant | Total seconds | Saturated seconds | Saturation percentage |
|---|---|---|---|
| A | 7587 | 134 | 1.766179% |
| B | 7588 | 249 | 3.281497% |
| C | 7588 | 201 | 2.648919% |
| D | 7588 | 715 | 9.422773% |
Noise dominated data is calculated using 1-second bins in cleaned event files. If a bin has >2000 counts, and if more than 50% of those come from <1% of pixels, then it is considered to be noise-dominated and hence unusable.
| Quadrant | # 1 sec bins | Bins with >0 counts | Bins with >2000 counts | High rate bins dominated by noise | Noise dominated (total time) | Noise dominated (detector-on time) | Marked lightcurve |
|---|---|---|---|---|---|---|---|
| A | 7587 | 7587 | 0 | 0 | 0.00% | 0.00% | 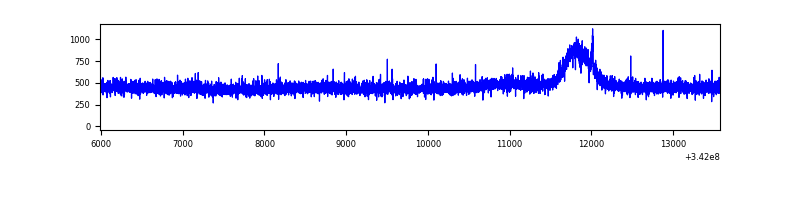 |
| B | 7588 | 7588 | 67 | 67 | 0.88% | 0.88% | 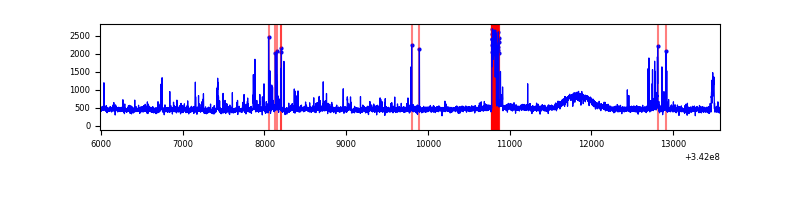 |
| C | 7588 | 7588 | 0 | 0 | 0.00% | 0.00% | 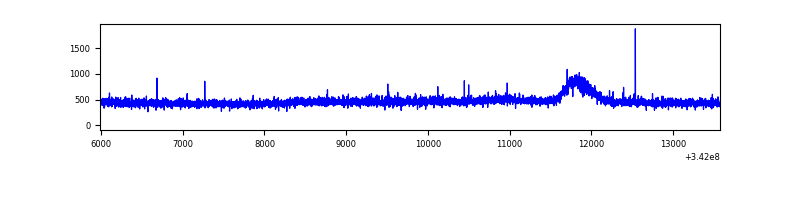 |
| D | 7588 | 7588 | 526 | 526 | 6.93% | 6.93% | 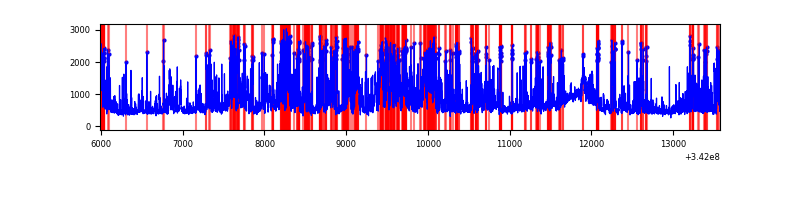 |
Top three noisy pixels from each quadrant. If the there are fewer than three noisy pixels in the level2.evt file, extra rows are filled as -1
| Pixel properties | Quadrant properties | ||||||
|---|---|---|---|---|---|---|---|
| Quadrant | DetID | PixID | Counts | Sigma | Mean | Median | Sigma |
| A | 15 | 174 | 12981 | 65.63 | 916 | 896 | 184.2 |
| A | 13 | 254 | 12494 | 62.98 | 916 | 896 | 184.2 |
| A | 3 | 137 | 9097 | 44.53 | 916 | 896 | 184.2 |
| B | 10 | 245 | 267658 | 1548.68 | 899 | 875 | 172.3 |
| B | 15 | 32 | 51284 | 292.63 | 899 | 875 | 172.3 |
| B | 12 | 111 | 21719 | 121.0 | 899 | 875 | 172.3 |
| C | 14 | 238 | 141567 | 690.71 | 870 | 871 | 203.7 |
| C | 10 | 22 | 9850 | 44.08 | 870 | 871 | 203.7 |
| C | 13 | 61 | 5989 | 25.13 | 870 | 871 | 203.7 |
| D | 1 | 52 | 2458564 | 12004.79 | 861 | 835 | 204.7 |
| D | 7 | 80 | 578654 | 2822.36 | 861 | 835 | 204.7 |
| D | 12 | 227 | 270651 | 1317.92 | 861 | 835 | 204.7 |
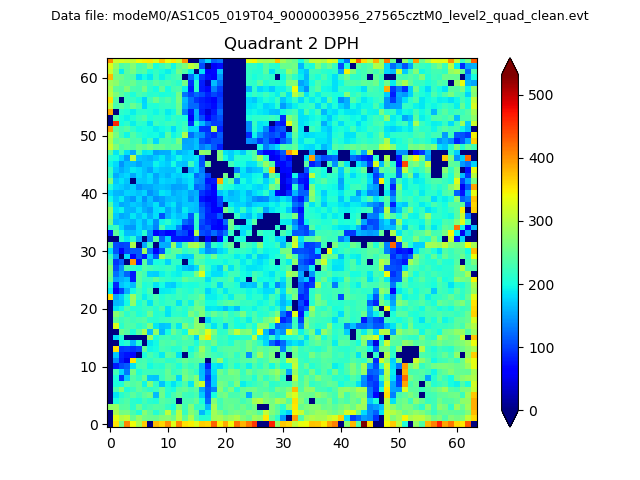
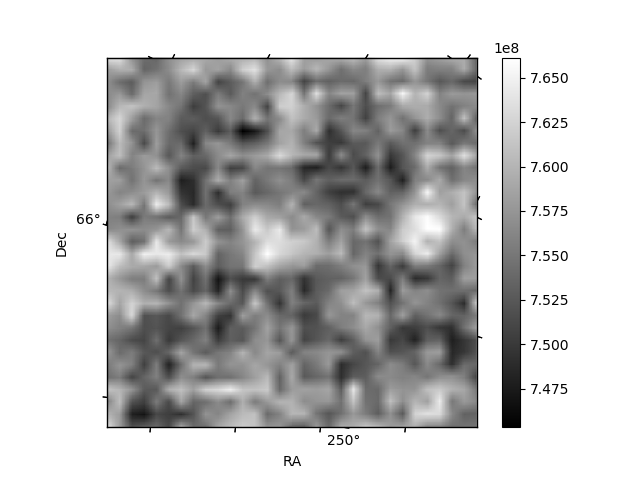
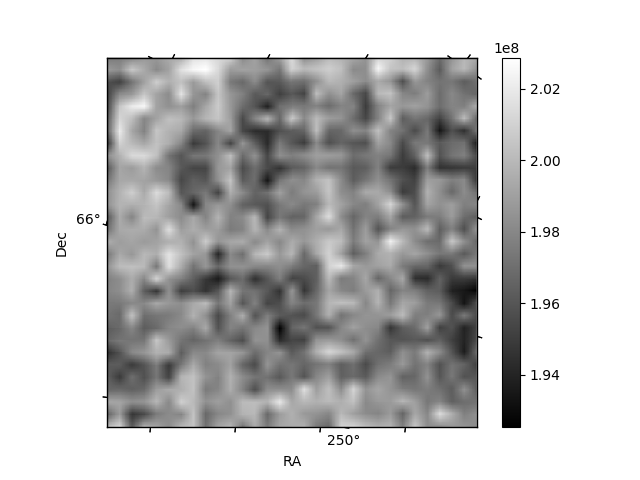
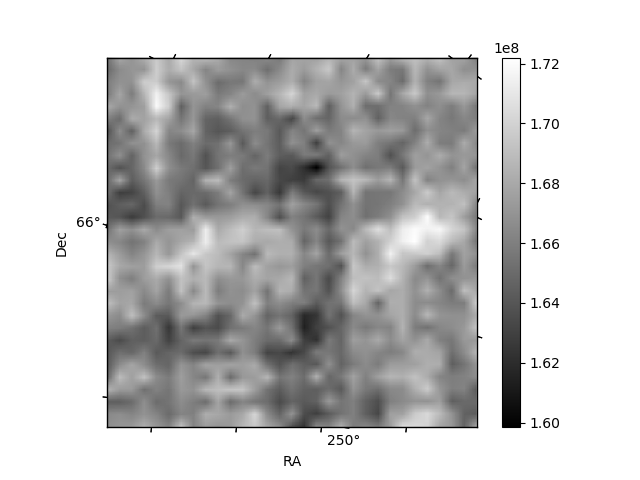
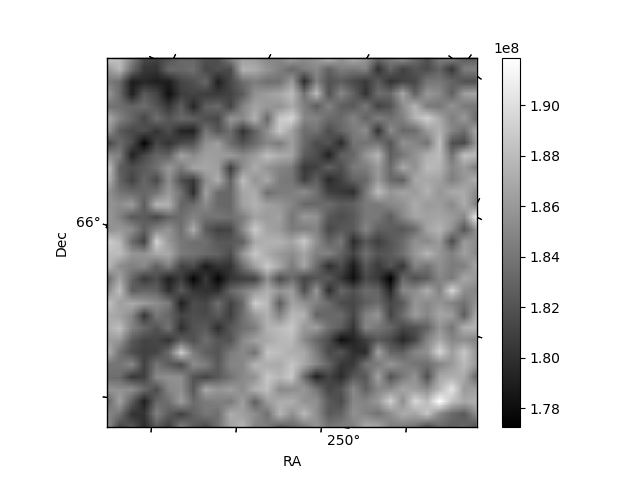
Histogram calculated using DETX and DETY for each event in the final _common_clean file
| Quadrant A | 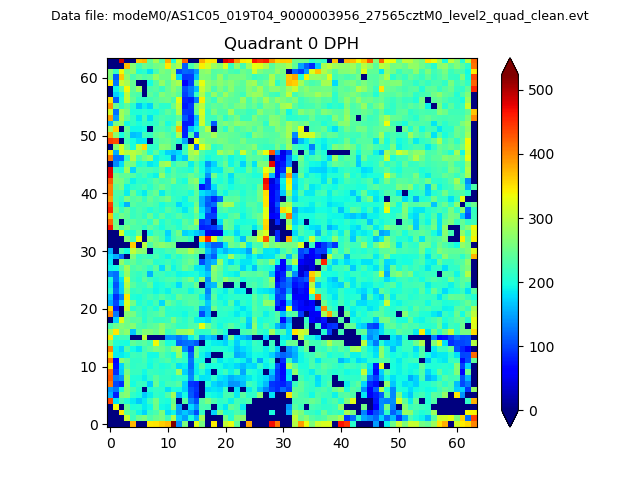 |
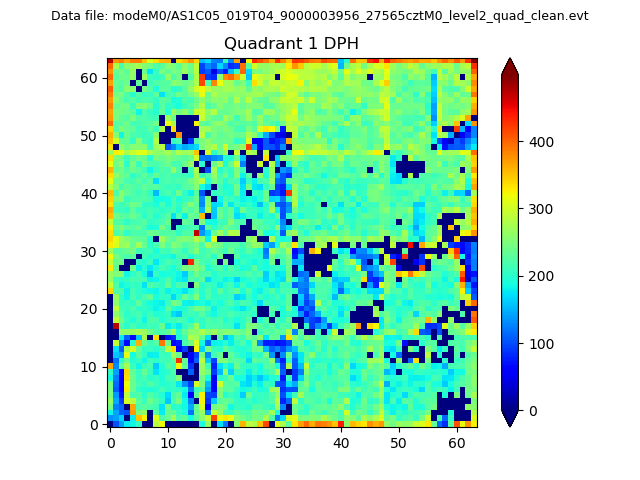 |
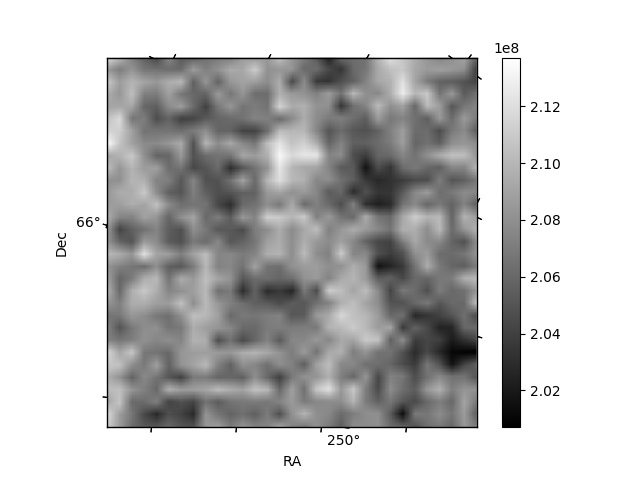
Quadrant B |
|---|---|---|---|
| Quadrant D | 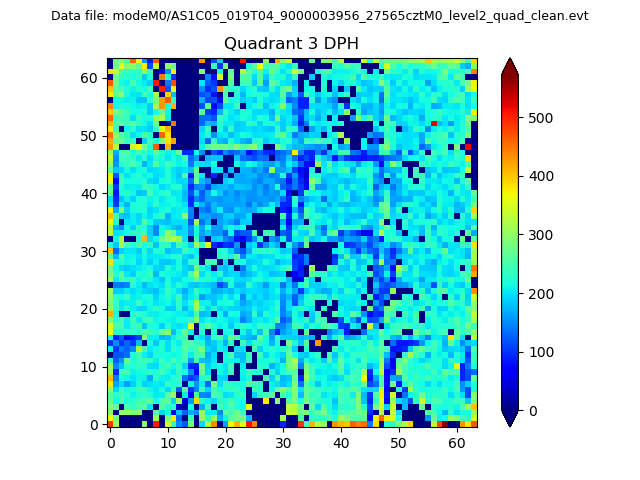 |
 |
Quadrant C |
| Plot type | Count rate plots | Images |
|---|---|---|
| Comparison with Poisson distribution Blue bars denote a histogram of data divided into 1 sec bins. Red curve is a Poisson curve with rate = median count rate of data. |
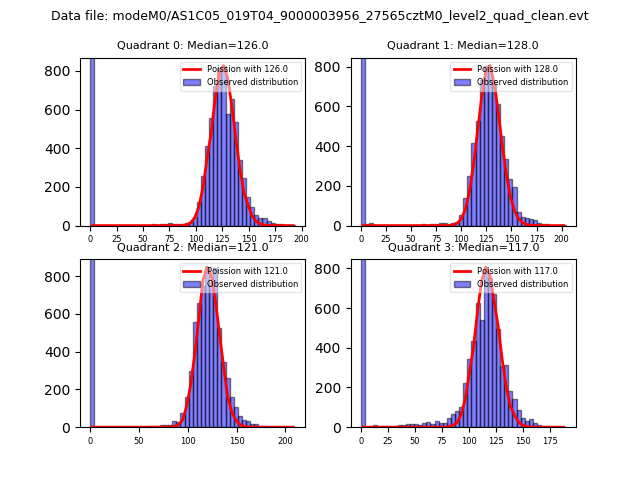 |
 |
| Quadrant-wise count rates Data is divided into 100 sec bins |
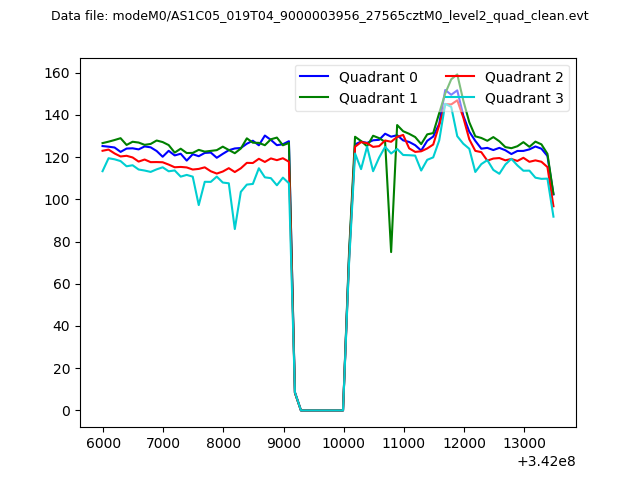 |
|
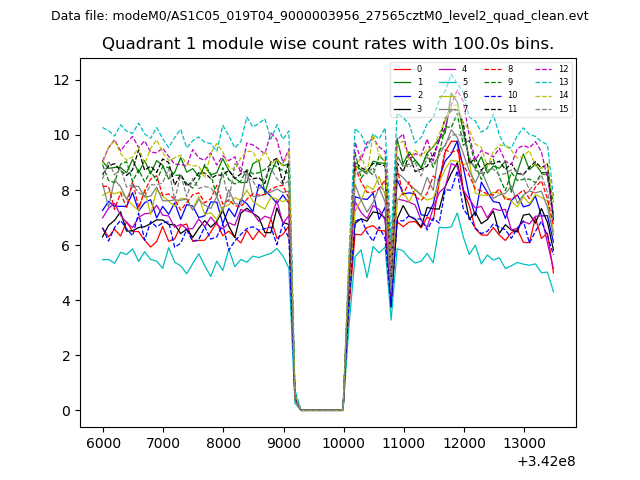
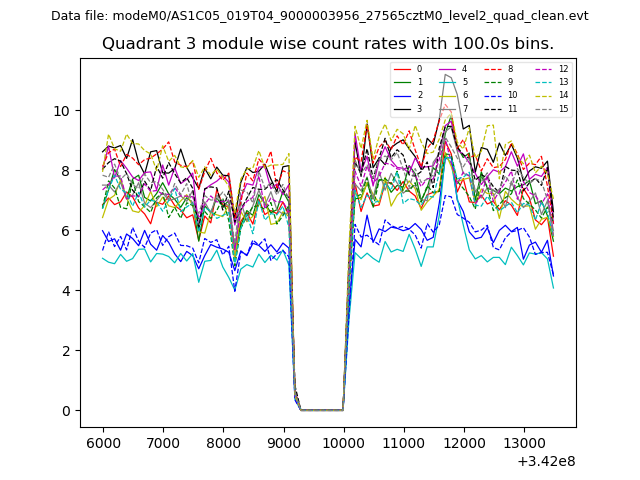
| Module-wise count rates for Quadrant A Data is divided into 100 sec bins |
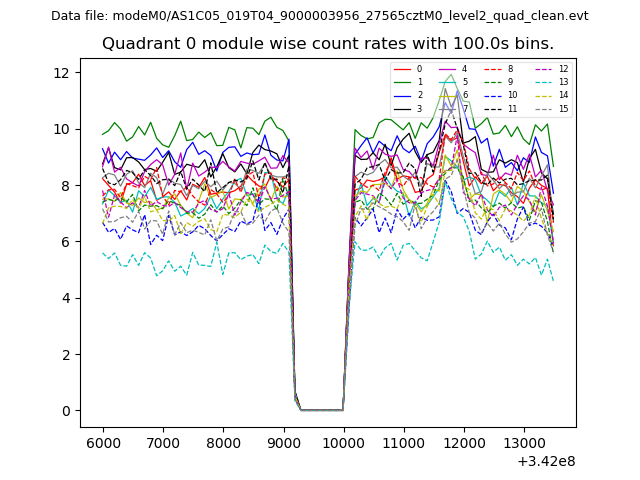 |
 |
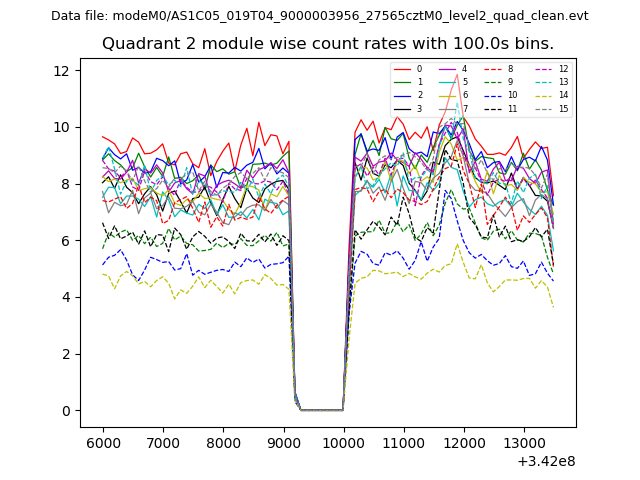
| Module-wise count rates for Quadrant B Data is divided into 100 sec bins |
 |
 |
| Module-wise count rates for Quadrant C Data is divided into 100 sec bins |
 |
 |
| Module-wise count rates for Quadrant D Data is divided into 100 sec bins |
 |
 |
| Parameter | Plot |
|---|---|
| CZT HV Monitor | 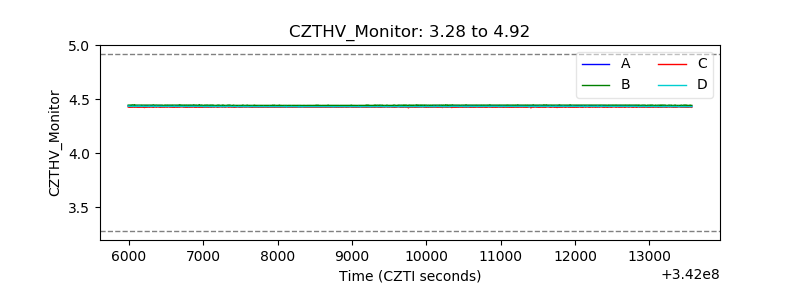 |
| D_VDD | 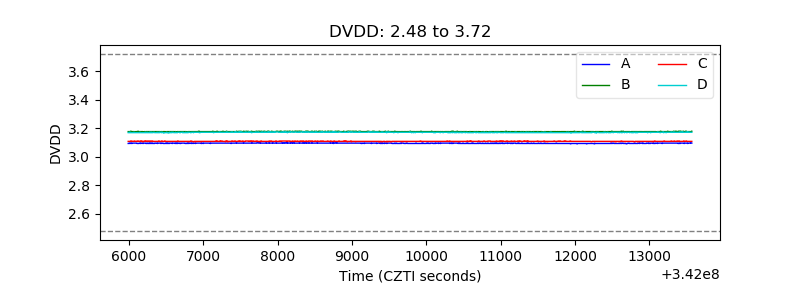 |
| Temperature 1 | 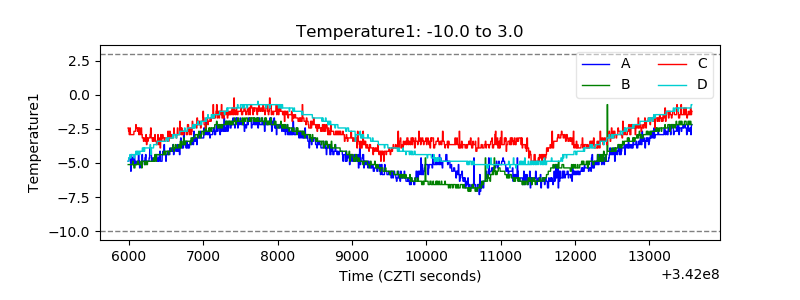 |
| Veto HV Monitor | 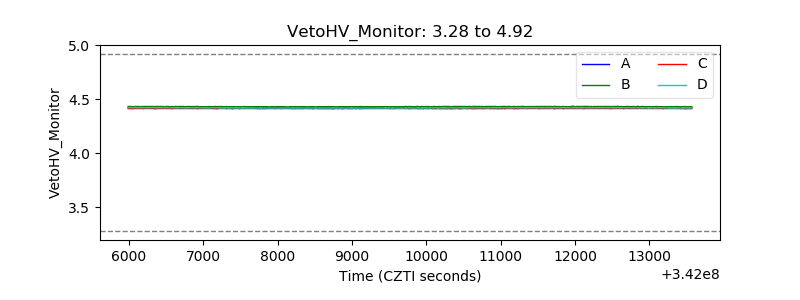 |
| Veto LLD | 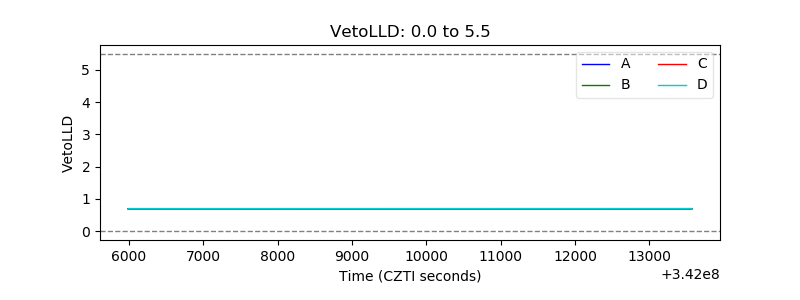 |
| Alpha Counter | 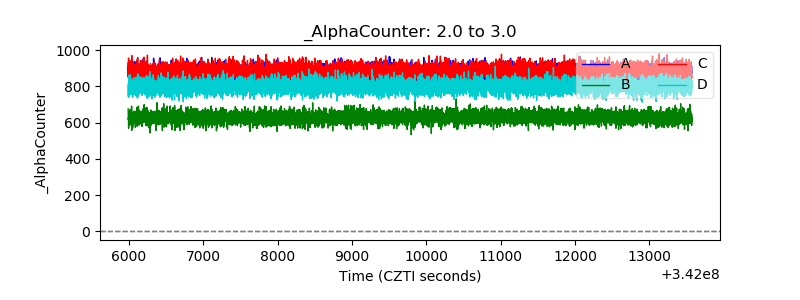 |
| _CPM_Rate | 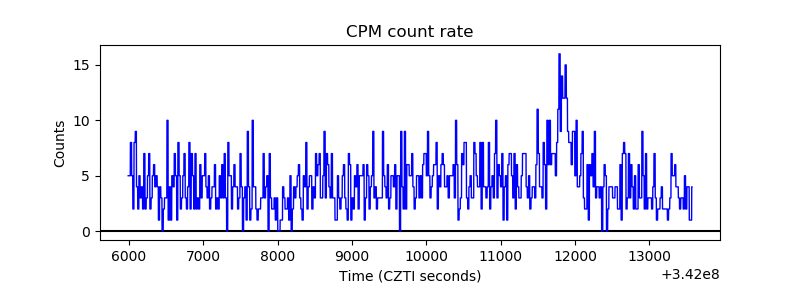 |
| CZT Counter | 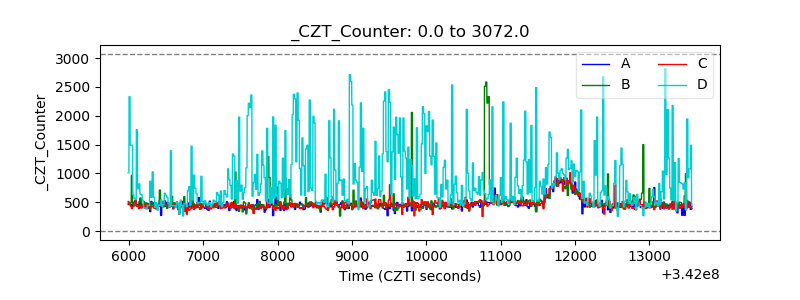 |
| +2.5 Volts monitor |  |
| +5 Volts monitor | 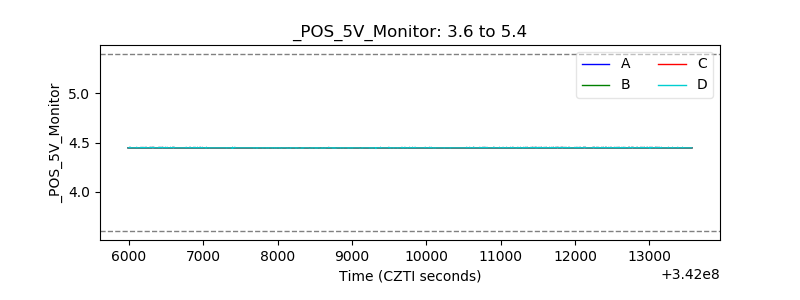 |
| _ROLL_ROT | 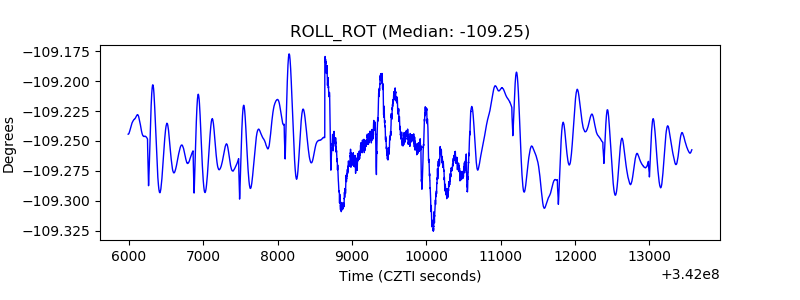 |
| _Roll_DEC | 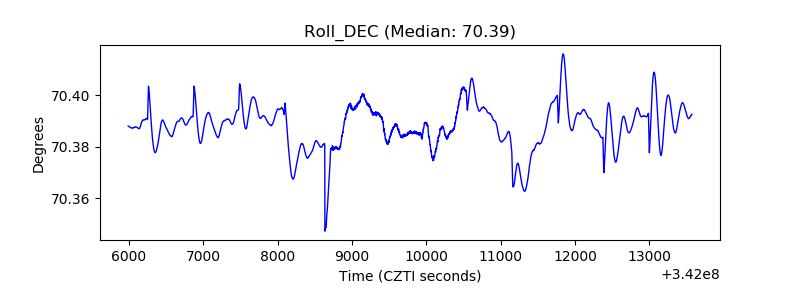 |
| _Roll_RA | 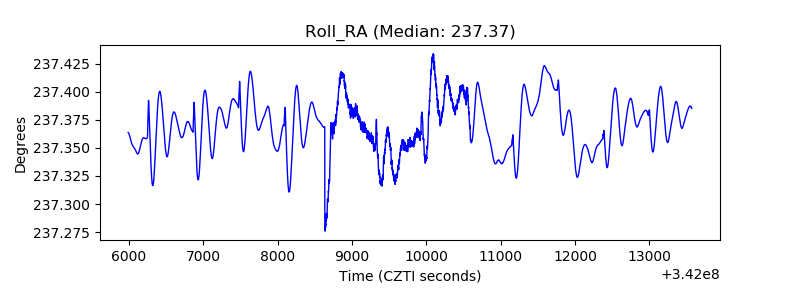 |
| Veto Counter | 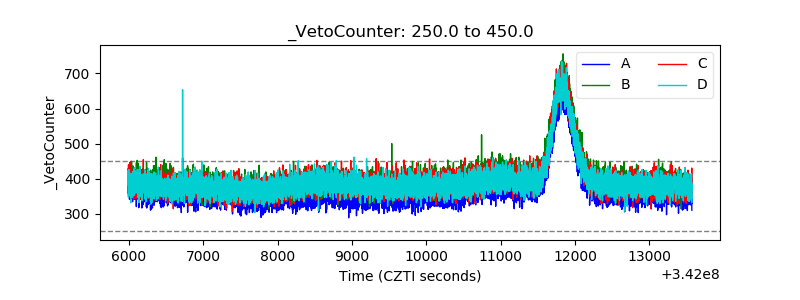 |