| Param | Original file | Final file |
|---|---|---|
| Filename | modeM0/AS1C05_019T04_9000003956_27568cztM0_level2.evt | modeM0/AS1C05_019T04_9000003956_27568cztM0_level2_quad_clean.evt |
| Size (bytes) | 356,722,560 | 70,767,360 |
| Size | 340.2 MB | 67.5 MB |
| Events in quadrant A | 2,114,242 | 466,672 |
| Events in quadrant B | 2,241,517 | 473,458 |
| Events in quadrant C | 2,099,903 | 449,012 |
| Events in quadrant D | 4,028,238 | 424,293 |
| Mode M0 | |||
|---|---|---|---|
| Quadrant | BADHDUFLAG | Total packets | Discarded packets |
| A | 0 | 9459 | 0 |
| B | 0 | 9770 | 0 |
| C | 0 | 9403 | 0 |
| D | 0 | 15126 | 0 |
| Quadrant | Total seconds | Saturated seconds | Saturation percentage |
|---|---|---|---|
| A | 4687 | 8 | 0.170685% |
| B | 4688 | 16 | 0.341297% |
| C | 4688 | 16 | 0.341297% |
| D | 4688 | 338 | 7.209898% |
Noise dominated data is calculated using 1-second bins in cleaned event files. If a bin has >2000 counts, and if more than 50% of those come from <1% of pixels, then it is considered to be noise-dominated and hence unusable.
| Quadrant | # 1 sec bins | Bins with >0 counts | Bins with >2000 counts | High rate bins dominated by noise | Noise dominated (total time) | Noise dominated (detector-on time) | Marked lightcurve |
|---|---|---|---|---|---|---|---|
| A | 4687 | 4687 | 0 | 0 | 0.00% | 0.00% | 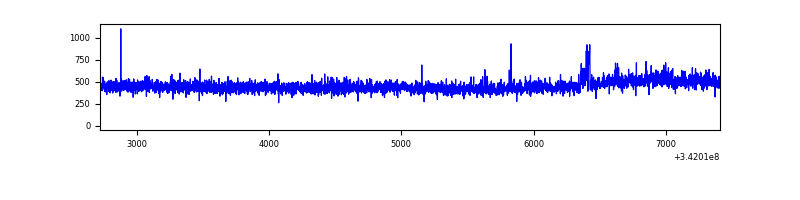 |
| B | 4688 | 4688 | 3 | 3 | 0.06% | 0.06% | 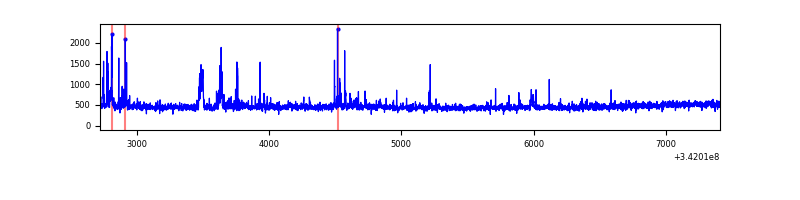 |
| C | 4688 | 4688 | 0 | 0 | 0.00% | 0.00% | 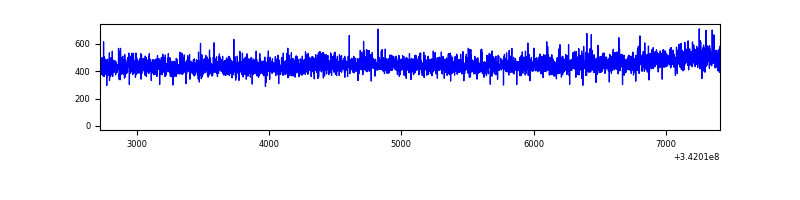 |
| D | 4688 | 4688 | 363 | 363 | 7.74% | 7.74% | 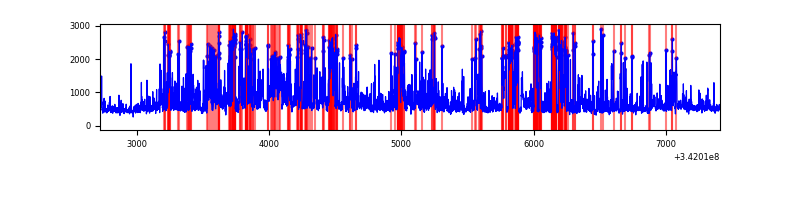 |
Top three noisy pixels from each quadrant. If the there are fewer than three noisy pixels in the level2.evt file, extra rows are filled as -1
| Pixel properties | Quadrant properties | ||||||
|---|---|---|---|---|---|---|---|
| Quadrant | DetID | PixID | Counts | Sigma | Mean | Median | Sigma |
| A | 15 | 174 | 53762 | 494.47 | 533 | 523 | 107.7 |
| A | 13 | 254 | 7390 | 63.78 | 533 | 523 | 107.7 |
| A | 3 | 137 | 5039 | 41.94 | 533 | 523 | 107.7 |
| B | 10 | 245 | 66070 | 645.84 | 531 | 518 | 101.5 |
| B | 15 | 32 | 58957 | 575.76 | 531 | 518 | 101.5 |
| B | 4 | 52 | 18660 | 178.74 | 531 | 518 | 101.5 |
| C | 14 | 238 | 82985 | 673.81 | 515 | 516 | 122.4 |
| C | 13 | 61 | 3569 | 24.94 | 515 | 516 | 122.4 |
| C | 15 | 208 | 3444 | 23.92 | 515 | 516 | 122.4 |
| D | 1 | 52 | 1671960 | 13835.9 | 505 | 490 | 120.8 |
| D | 7 | 80 | 349153 | 2886.12 | 505 | 490 | 120.8 |
| D | 2 | 250 | 64951 | 533.59 | 505 | 490 | 120.8 |
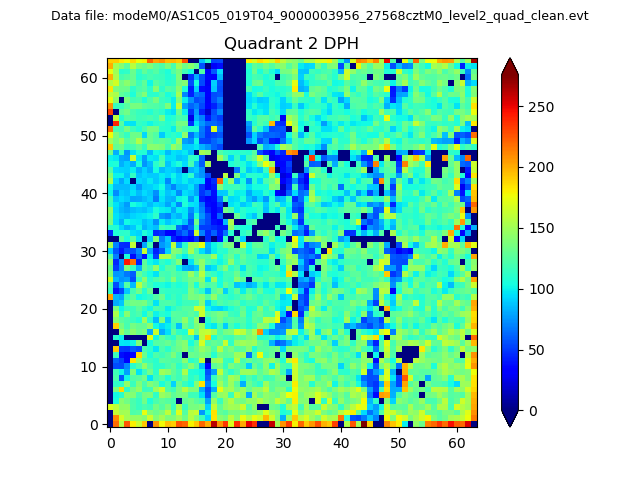
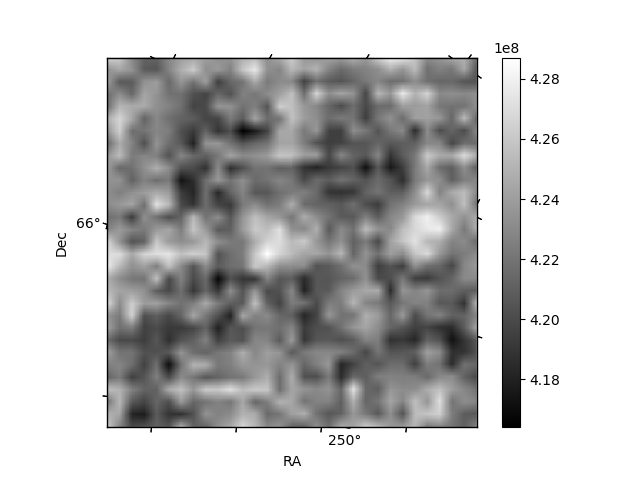
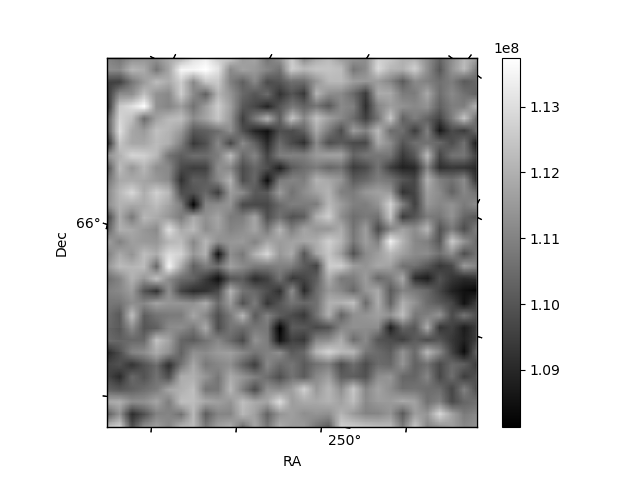
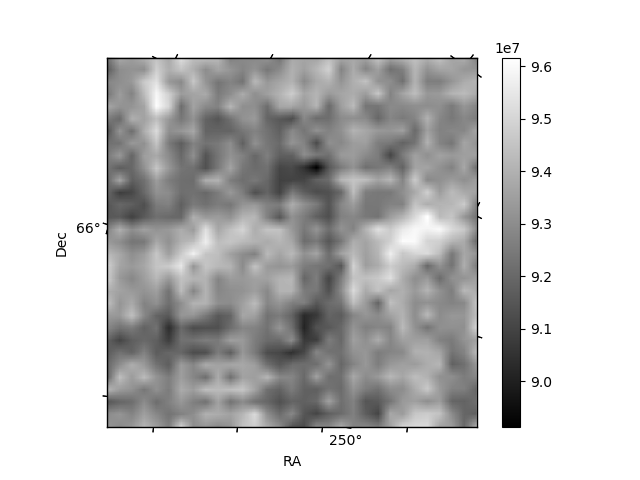
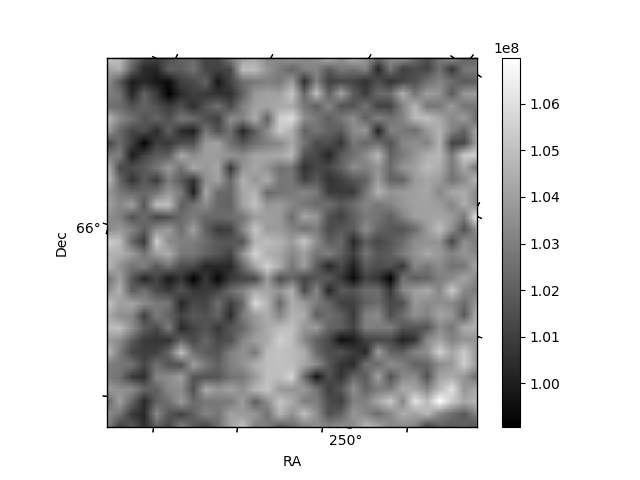
Histogram calculated using DETX and DETY for each event in the final _common_clean file
| Quadrant A | 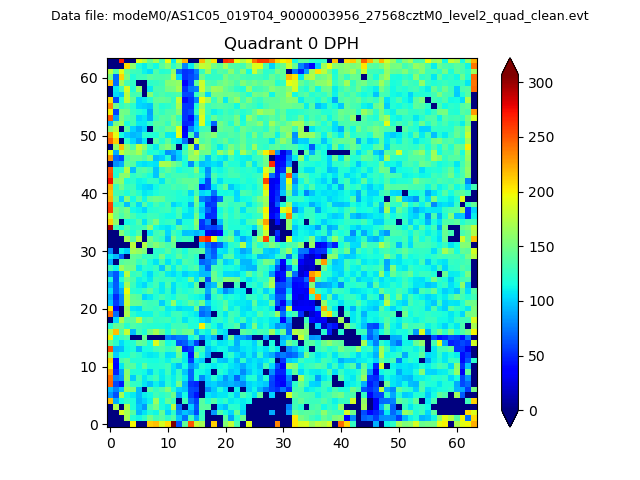 |
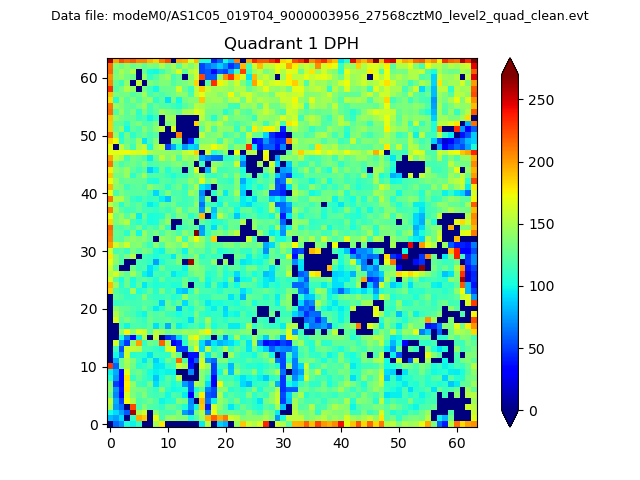 |
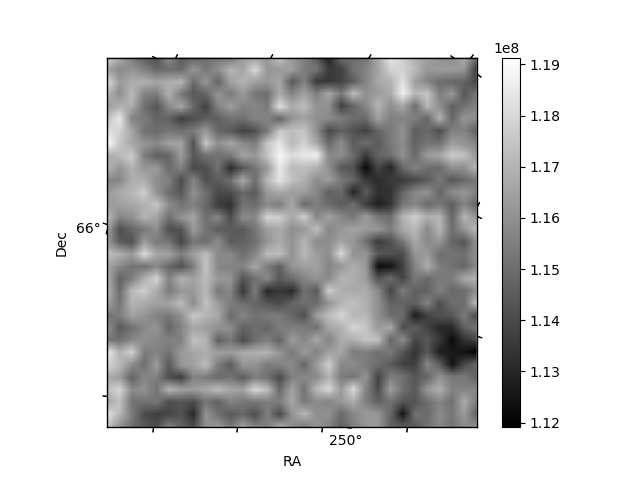
Quadrant B |
|---|---|---|---|
| Quadrant D | 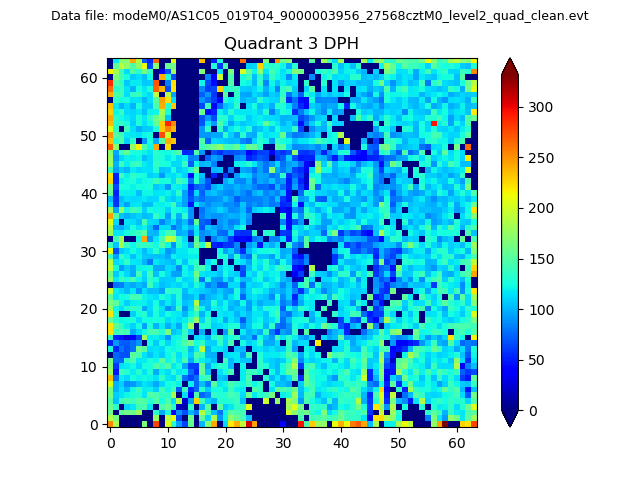 |
 |
Quadrant C |
| Plot type | Count rate plots | Images |
|---|---|---|
| Comparison with Poisson distribution Blue bars denote a histogram of data divided into 1 sec bins. Red curve is a Poisson curve with rate = median count rate of data. |
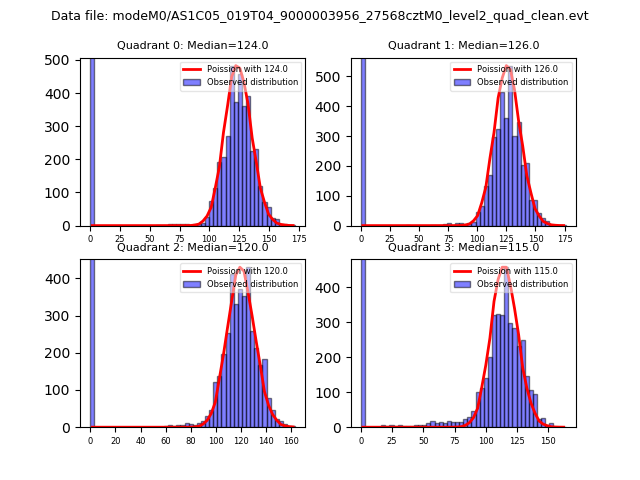 |
 |
| Quadrant-wise count rates Data is divided into 100 sec bins |
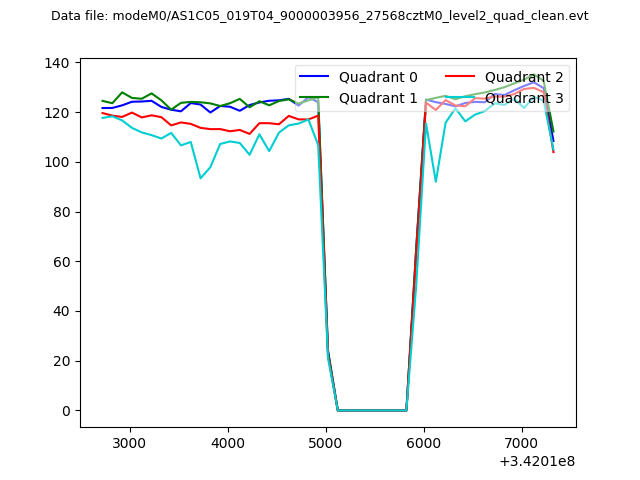 |
|
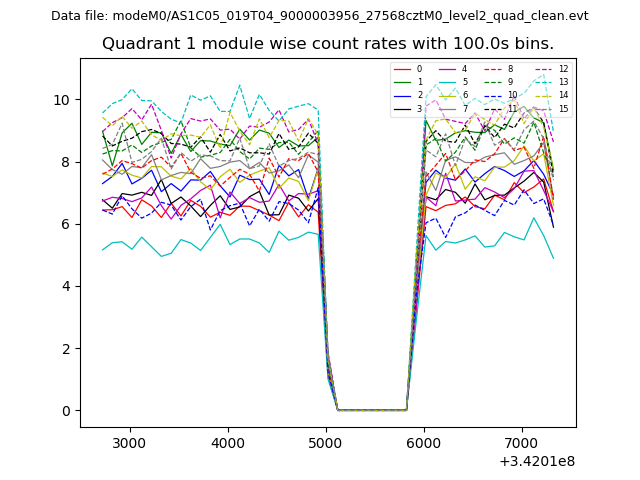
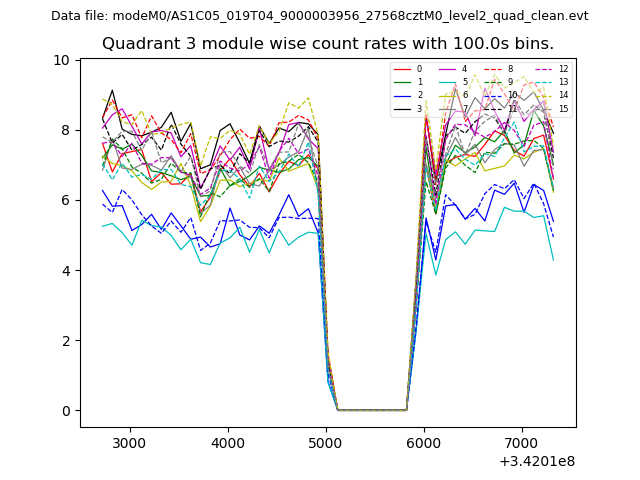
| Module-wise count rates for Quadrant A Data is divided into 100 sec bins |
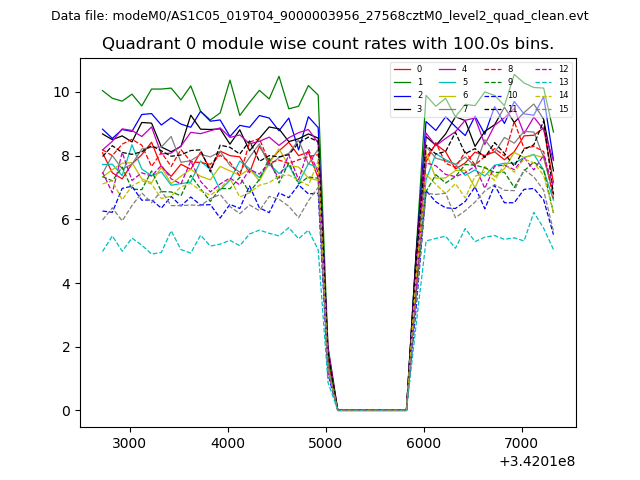 |
 |
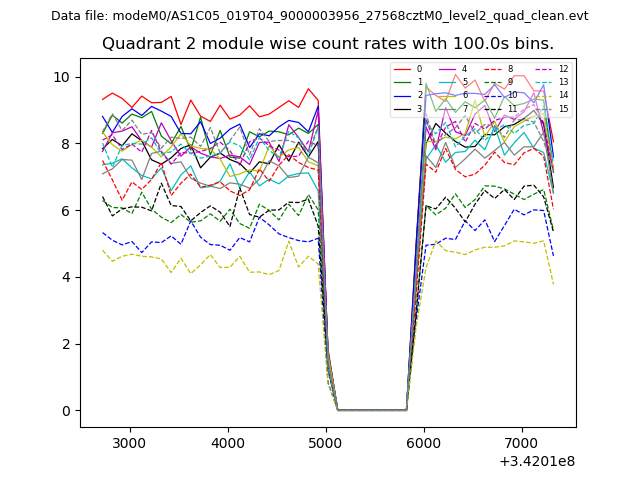
| Module-wise count rates for Quadrant B Data is divided into 100 sec bins |
 |
 |
| Module-wise count rates for Quadrant C Data is divided into 100 sec bins |
 |
 |
| Module-wise count rates for Quadrant D Data is divided into 100 sec bins |
 |
 |
| Parameter | Plot |
|---|---|
| CZT HV Monitor | 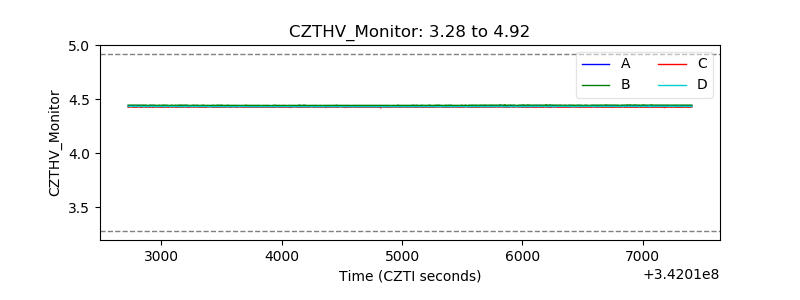 |
| D_VDD | 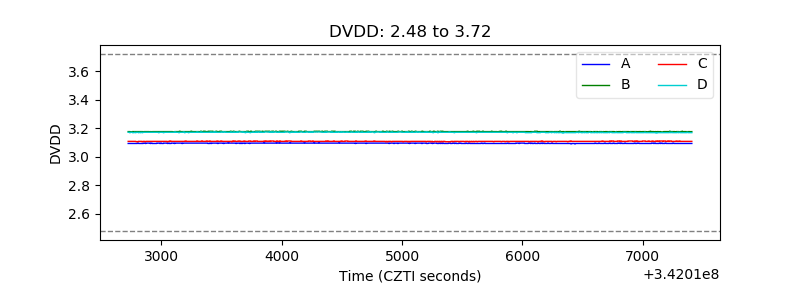 |
| Temperature 1 |  |
| Veto HV Monitor | 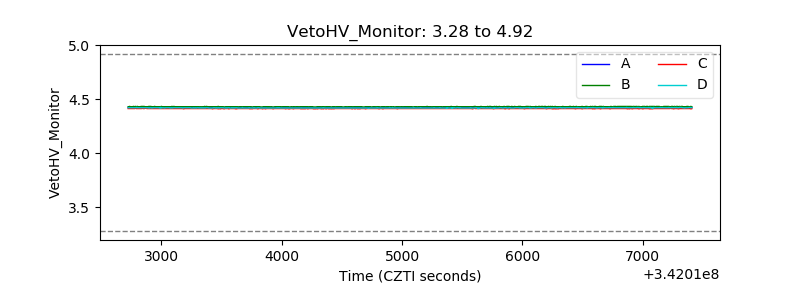 |
| Veto LLD |  |
| Alpha Counter | 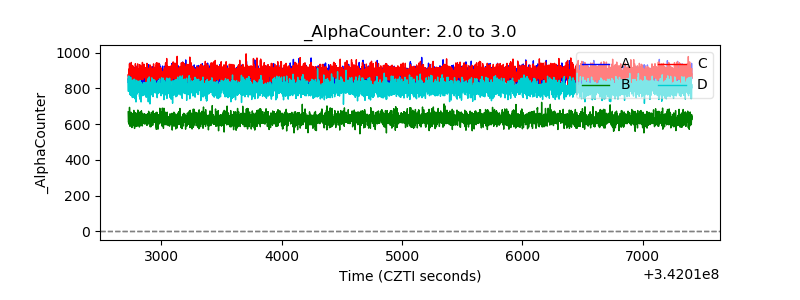 |
| _CPM_Rate | 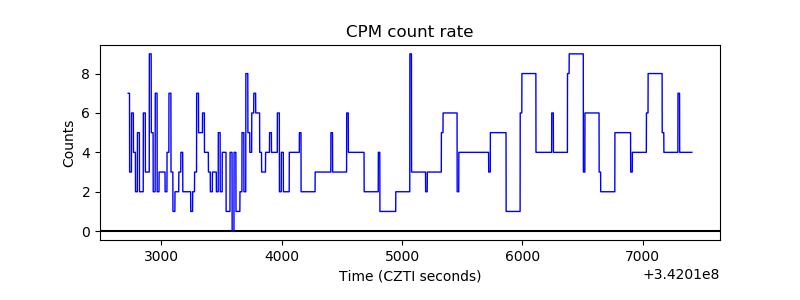 |
| CZT Counter | 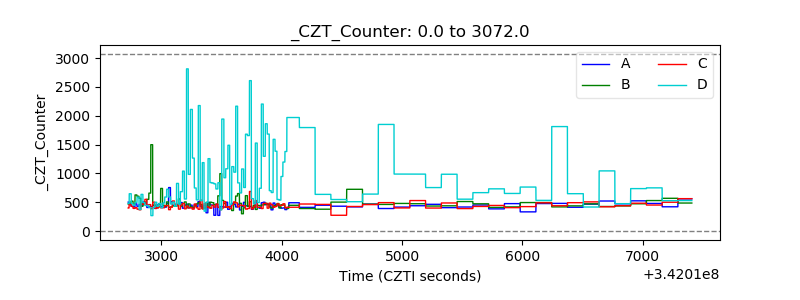 |
| +2.5 Volts monitor |  |
| +5 Volts monitor | 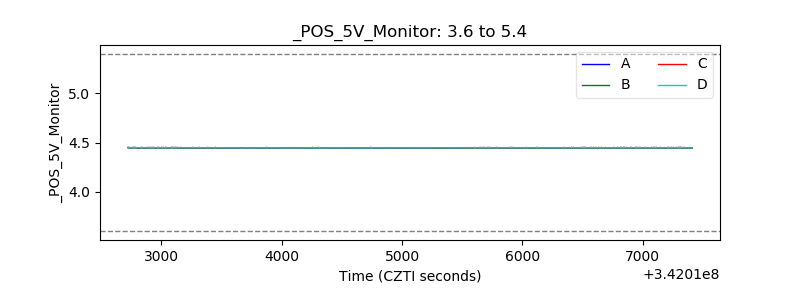 |
| _ROLL_ROT | 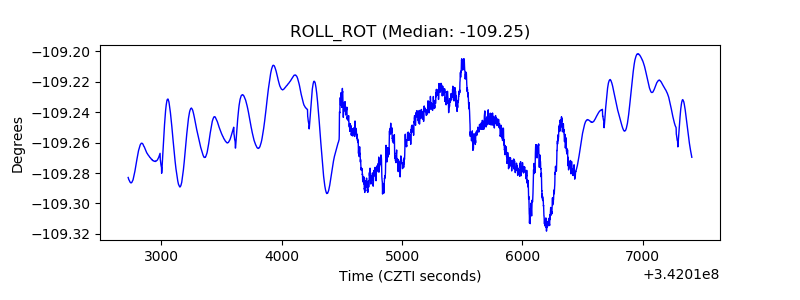 |
| _Roll_DEC | 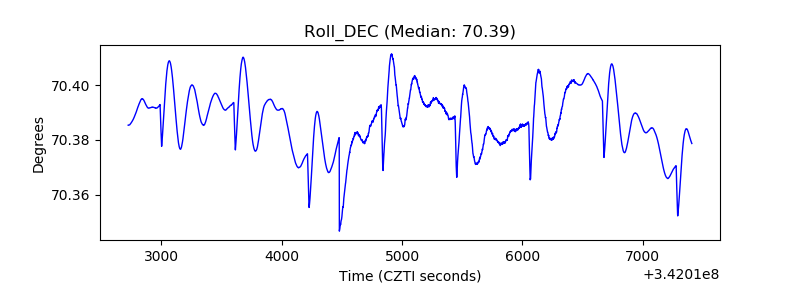 |
| _Roll_RA | 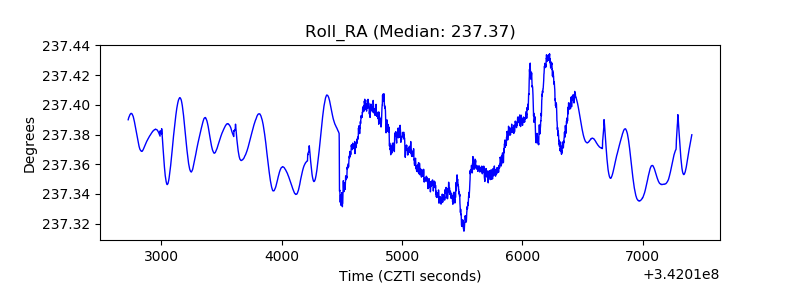 |
| Veto Counter | 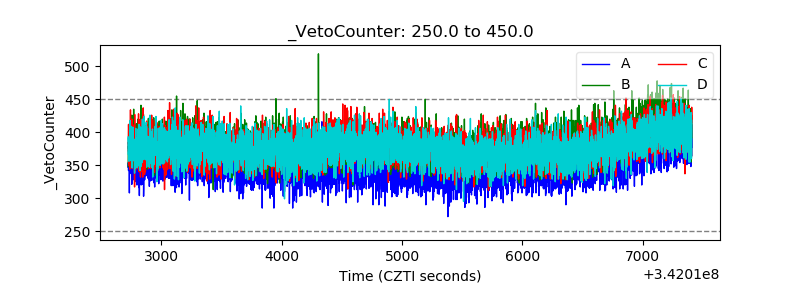 |