| Param | Original file | Final file |
|---|---|---|
| Filename | modeM0/AS1A09_038T13_9000003966cztM0_level2.fits | modeM0/AS1A09_038T13_9000003966cztM0_level2_quad_clean.evt |
| Size (bytes) | 31,305,600 | 16,660,800 |
| Size | 29.9 MB | 15.9 MB |
| Events in quadrant A | 193,520 | 75,288 |
| Events in quadrant B | 186,858 | 76,809 |
| Events in quadrant C | 188,010 | 71,172 |
| Events in quadrant D | 165,030 | 65,235 |
| Mode SS | |||
|---|---|---|---|
| Quadrant | BADHDUFLAG | Total packets | Discarded packets |
| A | 0 | 64 | 0 |
| B | 0 | 64 | 0 |
| C | 0 | 64 | 0 |
| D | 0 | 64 | 0 |
| Mode M9 | |||
|---|---|---|---|
| Quadrant | BADHDUFLAG | Total packets | Discarded packets |
| A | 0 | 10 | 0 |
| B | 0 | 10 | 0 |
| C | 0 | 10 | 0 |
| D | 0 | 10 | 0 |
| Mode M0 | |||
|---|---|---|---|
| Quadrant | BADHDUFLAG | Total packets | Discarded packets |
| A | 0 | 6273 | 0 |
| B | 0 | 6484 | 0 |
| C | 0 | 6277 | 0 |
| D | 0 | 6539 | 0 |
| Quadrant | Total seconds | Saturated seconds | Saturation percentage |
|---|---|---|---|
| A | 3010 | 27 | 0.897010% |
| B | 3010 | 24 | 0.797342% |
| C | 3010 | 41 | 1.362126% |
| D | 3010 | 12 | 0.398671% |
Noise dominated data is calculated using 1-second bins in cleaned event files. If a bin has >2000 counts, and if more than 50% of those come from <1% of pixels, then it is considered to be noise-dominated and hence unusable.
| Quadrant | # 1 sec bins | Bins with >0 counts | Bins with >2000 counts | High rate bins dominated by noise | Noise dominated (total time) | Noise dominated (detector-on time) | Marked lightcurve |
|---|---|---|---|---|---|---|---|
| A | 4089 | 3009 | 0 | 0 | 0.00% | 0.00% | 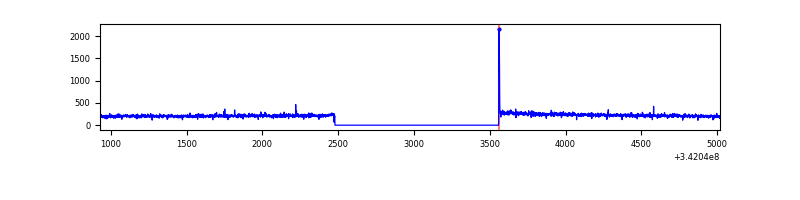 |
| B | 4089 | 3009 | 0 | 0 | 0.00% | 0.00% |  |
| C | 4089 | 3009 | 0 | 0 | 0.00% | 0.00% |  |
| D | 4089 | 3008 | 0 | 0 | 0.00% | 0.00% |  |
Top three noisy pixels from each quadrant. If the there are fewer than three noisy pixels in the level2.evt file, extra rows are filled as -1
| Pixel properties | Quadrant properties | ||||||
|---|---|---|---|---|---|---|---|
| Quadrant | DetID | PixID | Counts | Sigma | Mean | Median | Sigma |
| A | 0 | 29 | 193 | 9.97 | 50 | 47 | 14.6 |
| A | 7 | 110 | 174 | 8.67 | 50 | 47 | 14.6 |
| A | 14 | 79 | 145 | 6.69 | 50 | 47 | 14.6 |
| B | 5 | 128 | 149 | 8.45 | 49 | 47 | 12.1 |
| B | 2 | 9 | 147 | 8.28 | 49 | 47 | 12.1 |
| B | 5 | 225 | 132 | 7.04 | 49 | 47 | 12.1 |
| C | 3 | 202 | 149 | 7.05 | 49 | 46 | 14.6 |
| C | 12 | 241 | 136 | 6.16 | 49 | 46 | 14.6 |
| C | 3 | 126 | 135 | 6.09 | 49 | 46 | 14.6 |
| D | 4 | 246 | 130 | 6.24 | 46 | 42 | 14.1 |
| D | 15 | 46 | 127 | 6.02 | 46 | 42 | 14.1 |
| D | 11 | 66 | 124 | 5.81 | 46 | 42 | 14.1 |
Histogram calculated using DETX and DETY for each event in the final _common_clean file
| Quadrant A |  |
 |
Quadrant B |
|---|---|---|---|
| Quadrant D |  |
 |
Quadrant C |
| Plot type | Count rate plots | Images |
|---|---|---|
| Comparison with Poisson distribution Blue bars denote a histogram of data divided into 1 sec bins. Red curve is a Poisson curve with rate = median count rate of data. |
 |
 |
| Quadrant-wise count rates Data is divided into 100 sec bins |
 |
|
| Module-wise count rates for Quadrant A Data is divided into 100 sec bins |
 |
 |
| Module-wise count rates for Quadrant B Data is divided into 100 sec bins |
 |
 |
| Module-wise count rates for Quadrant C Data is divided into 100 sec bins |
 |
 |
| Module-wise count rates for Quadrant D Data is divided into 100 sec bins |
 |
 |
| Parameter | Plot |
|---|---|
| CZT HV Monitor |  |
| D_VDD | 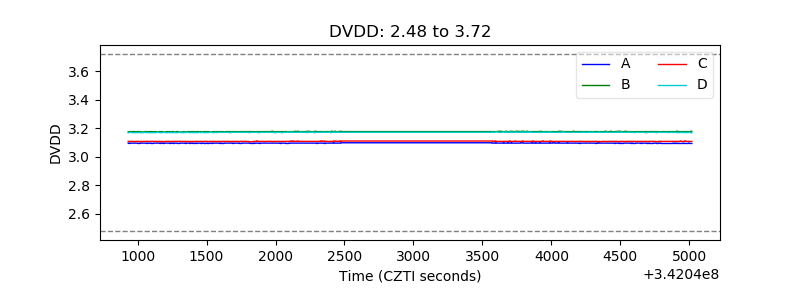 |
| Temperature 1 |  |
| Veto HV Monitor |  |
| Veto LLD |  |
| Alpha Counter |  |
| _CPM_Rate |  |
| CZT Counter |  |
| +2.5 Volts monitor |  |
| +5 Volts monitor |  |
| _ROLL_ROT |  |
| _Roll_DEC |  |
| _Roll_RA |  |
| Veto Counter |  |