| Param | Original file | Final file |
|---|---|---|
| Filename | modeM0/AS1A09_038T13_9000003966_27570cztM0_level2.evt | modeM0/AS1A09_038T13_9000003966_27570cztM0_level2_quad_clean.evt |
| Size (bytes) | 196,254,720 | 43,001,280 |
| Size | 187.2 MB | 41.0 MB |
| Events in quadrant A | 1,407,592 | 278,126 |
| Events in quadrant B | 1,458,560 | 287,412 |
| Events in quadrant C | 1,421,417 | 273,764 |
| Events in quadrant D | 1,466,357 | 265,226 |
| Mode M9 | |||
|---|---|---|---|
| Quadrant | BADHDUFLAG | Total packets | Discarded packets |
| A | 0 | 10 | 0 |
| B | 0 | 10 | 0 |
| C | 0 | 10 | 0 |
| D | 0 | 10 | 0 |
| Mode M0 | |||
|---|---|---|---|
| Quadrant | BADHDUFLAG | Total packets | Discarded packets |
| A | 0 | 5763 | 0 |
| B | 0 | 5974 | 0 |
| C | 0 | 5764 | 0 |
| D | 0 | 6014 | 0 |
| Quadrant | Total seconds | Saturated seconds | Saturation percentage |
|---|---|---|---|
| A | 2755 | 27 | 0.980036% |
| B | 2755 | 24 | 0.871143% |
| C | 2755 | 40 | 1.451906% |
| D | 2755 | 12 | 0.435572% |
Noise dominated data is calculated using 1-second bins in cleaned event files. If a bin has >2000 counts, and if more than 50% of those come from <1% of pixels, then it is considered to be noise-dominated and hence unusable.
| Quadrant | # 1 sec bins | Bins with >0 counts | Bins with >2000 counts | High rate bins dominated by noise | Noise dominated (total time) | Noise dominated (detector-on time) | Marked lightcurve |
|---|---|---|---|---|---|---|---|
| A | 3835 | 2756 | 4 | 4 | 0.10% | 0.15% | 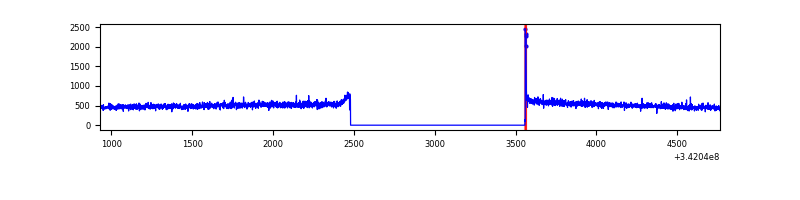 |
| B | 3835 | 2756 | 1 | 1 | 0.03% | 0.04% | 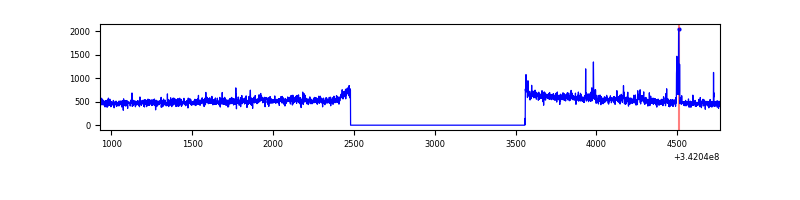 |
| C | 3835 | 2756 | 0 | 0 | 0.00% | 0.00% | 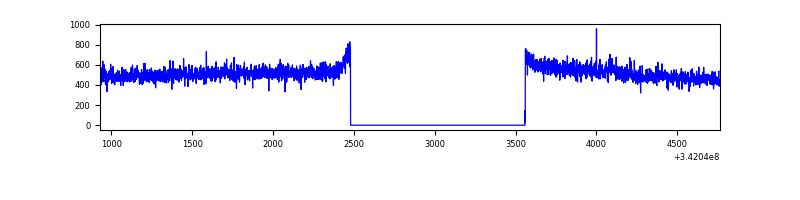 |
| D | 3835 | 2756 | 6 | 6 | 0.16% | 0.22% | 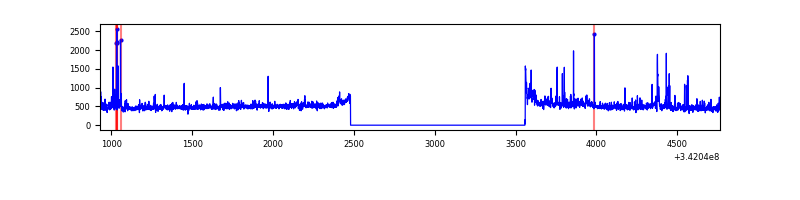 |
Top three noisy pixels from each quadrant. If the there are fewer than three noisy pixels in the level2.evt file, extra rows are filled as -1
| Pixel properties | Quadrant properties | ||||||
|---|---|---|---|---|---|---|---|
| Quadrant | DetID | PixID | Counts | Sigma | Mean | Median | Sigma |
| A | 8 | 192 | 9815 | 127.13 | 362 | 355 | 74.4 |
| A | 13 | 254 | 4661 | 57.87 | 362 | 355 | 74.4 |
| A | 3 | 137 | 3578 | 43.31 | 362 | 355 | 74.4 |
| B | 0 | 183 | 11976 | 167.3 | 360 | 351 | 69.5 |
| B | 0 | 230 | 8824 | 121.94 | 360 | 351 | 69.5 |
| B | 12 | 111 | 8322 | 114.71 | 360 | 351 | 69.5 |
| C | 14 | 238 | 56459 | 683.18 | 346 | 348 | 82.1 |
| C | 4 | 175 | 9008 | 105.44 | 346 | 348 | 82.1 |
| C | 1 | 16 | 2486 | 26.03 | 346 | 348 | 82.1 |
| D | 1 | 52 | 111763 | 1312.2 | 349 | 338 | 84.9 |
| D | 2 | 250 | 19775 | 228.9 | 349 | 338 | 84.9 |
| D | 2 | 234 | 11630 | 132.98 | 349 | 338 | 84.9 |
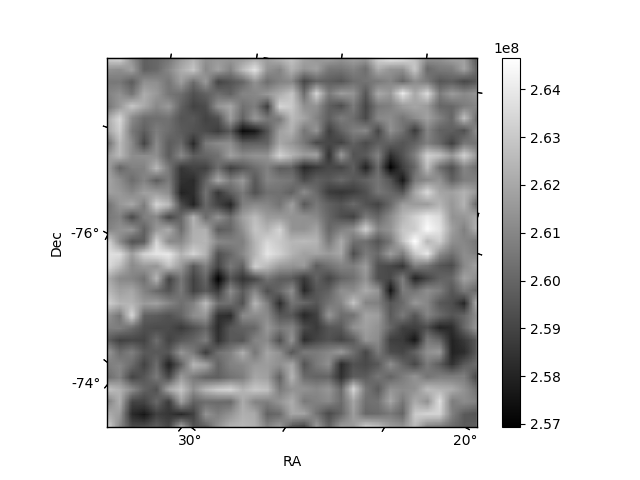
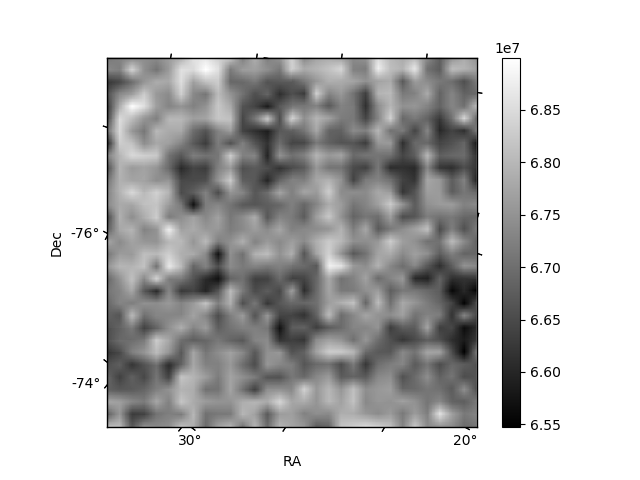
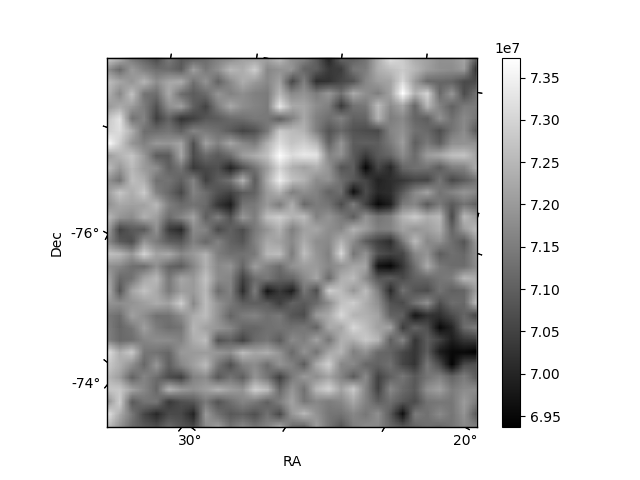
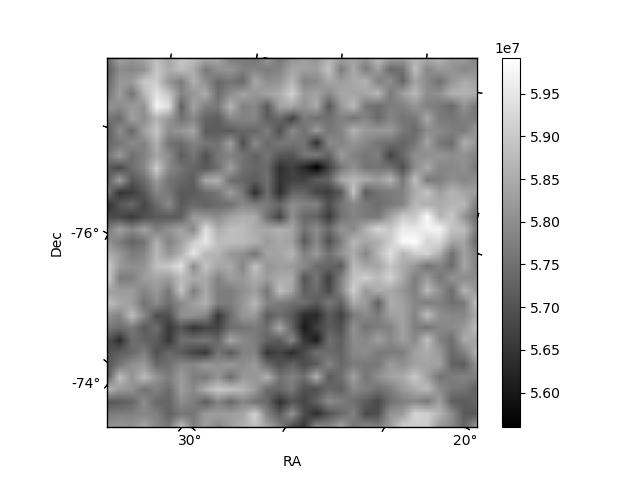
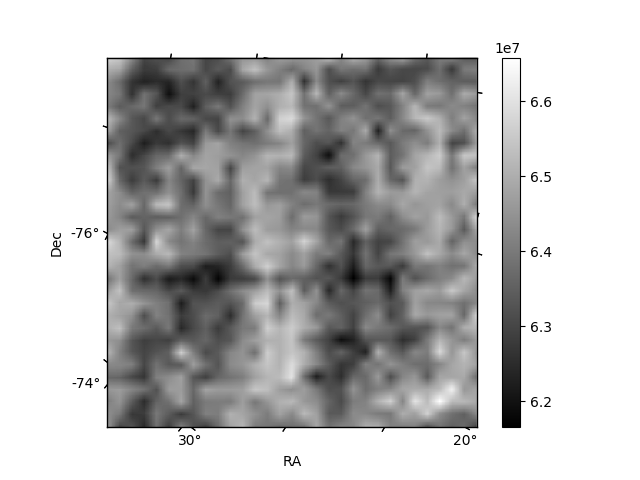
Histogram calculated using DETX and DETY for each event in the final _common_clean file
| Quadrant A | 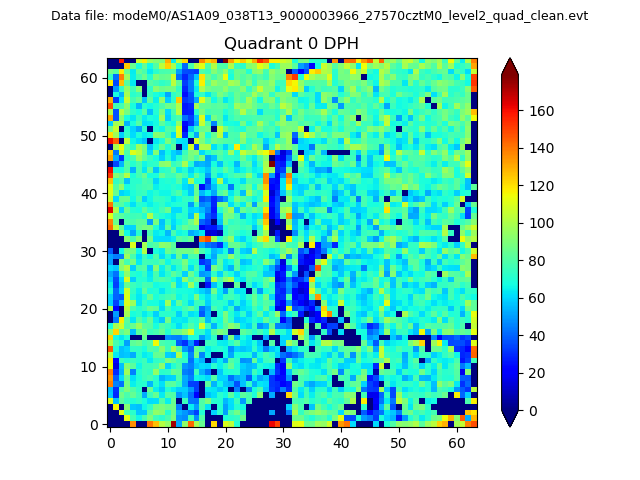 |
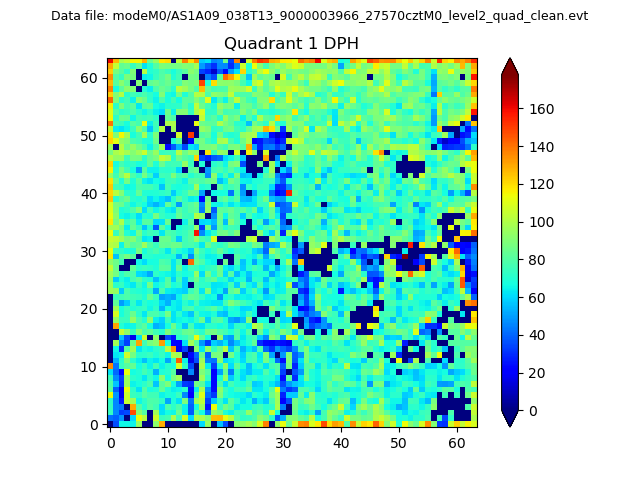 |
Quadrant B |
|---|---|---|---|
| Quadrant D | 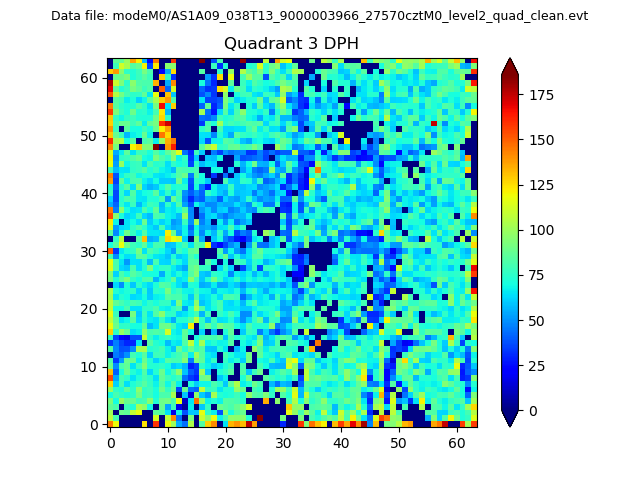 |
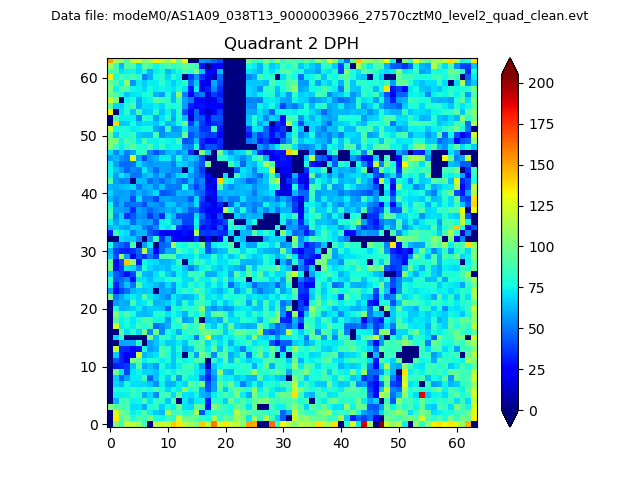 |
Quadrant C |
| Plot type | Count rate plots | Images |
|---|---|---|
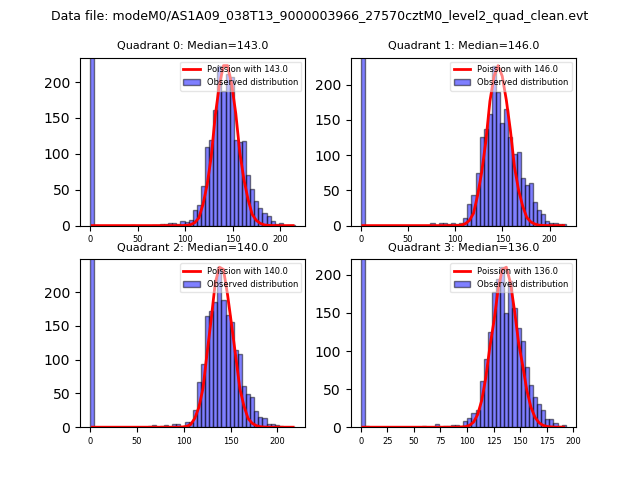
| Comparison with Poisson distribution Blue bars denote a histogram of data divided into 1 sec bins. Red curve is a Poisson curve with rate = median count rate of data. |
 |
 |
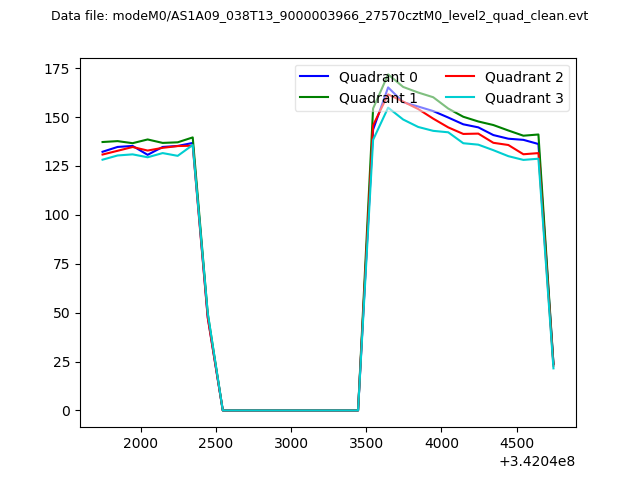
| Quadrant-wise count rates Data is divided into 100 sec bins |
 |
|
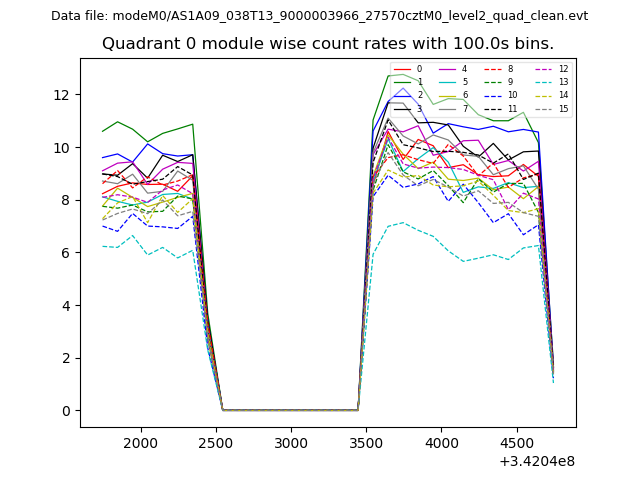
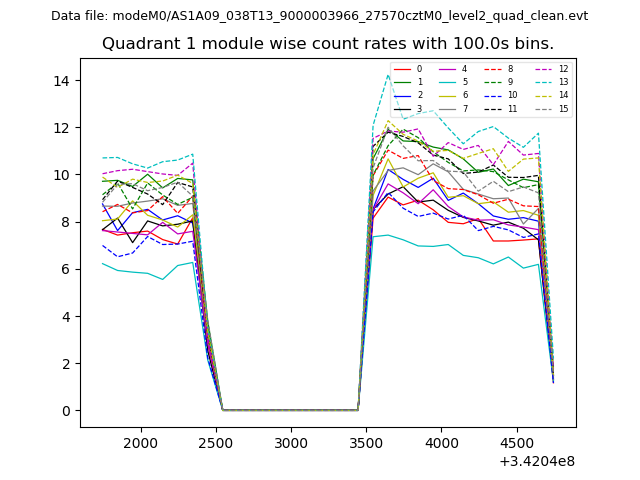
| Module-wise count rates for Quadrant A Data is divided into 100 sec bins |
 |
 |
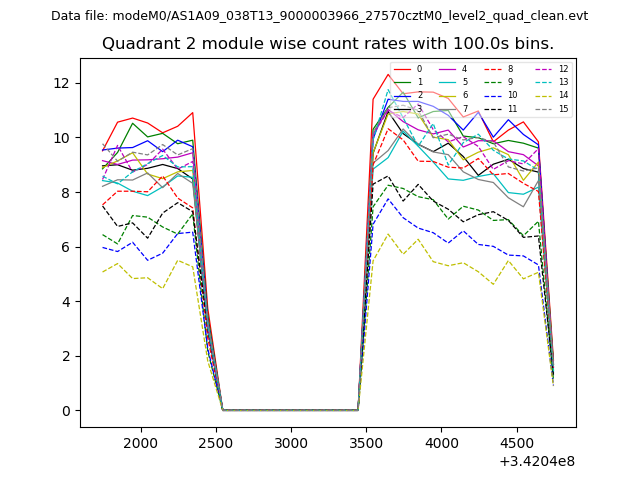
| Module-wise count rates for Quadrant B Data is divided into 100 sec bins |
 |
 |
| Module-wise count rates for Quadrant C Data is divided into 100 sec bins |
 |
 |
| Module-wise count rates for Quadrant D Data is divided into 100 sec bins |
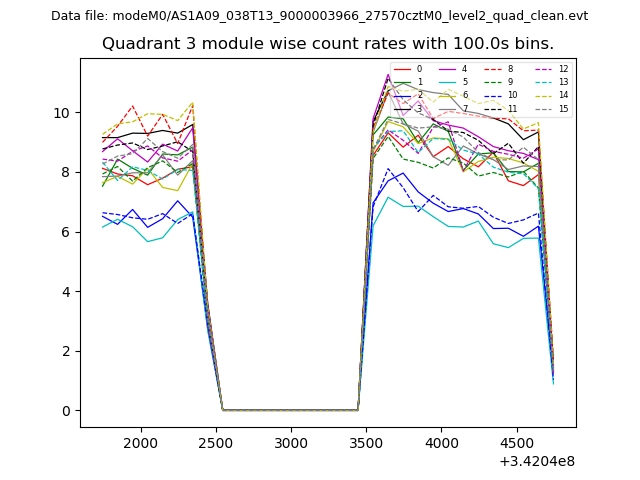 |
 |
| Parameter | Plot |
|---|---|
| CZT HV Monitor | 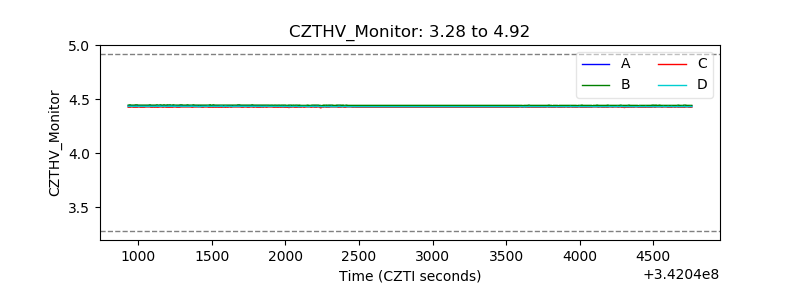 |
| D_VDD | 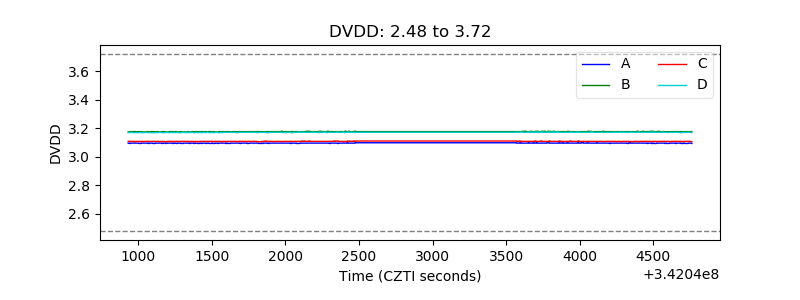 |
| Temperature 1 | 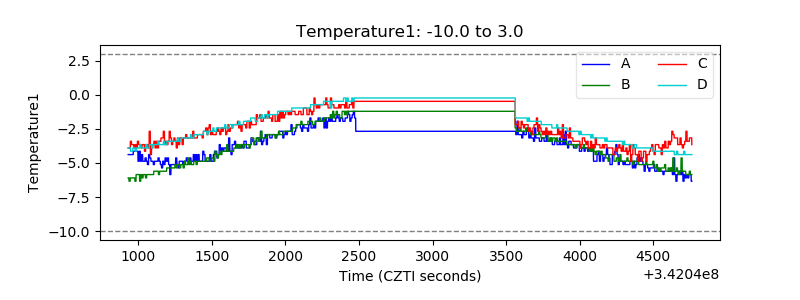 |
| Veto HV Monitor | 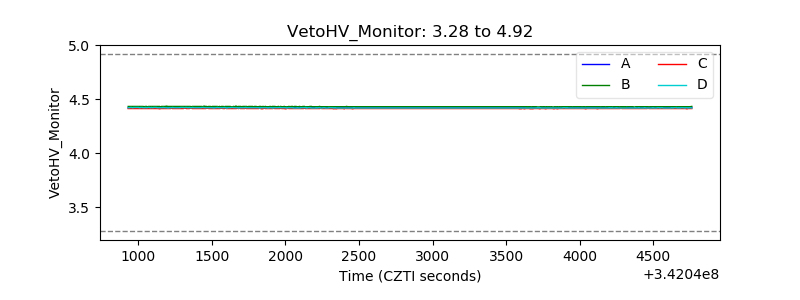 |
| Veto LLD | 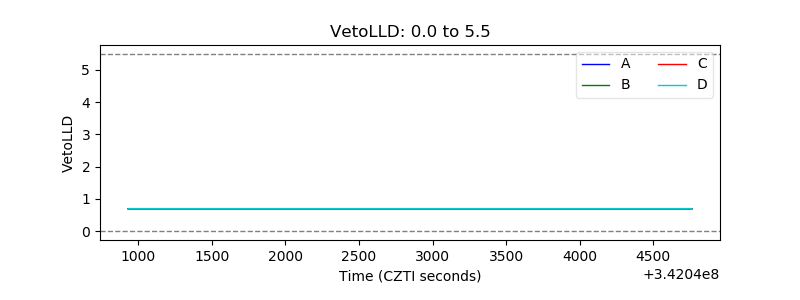 |
| Alpha Counter | 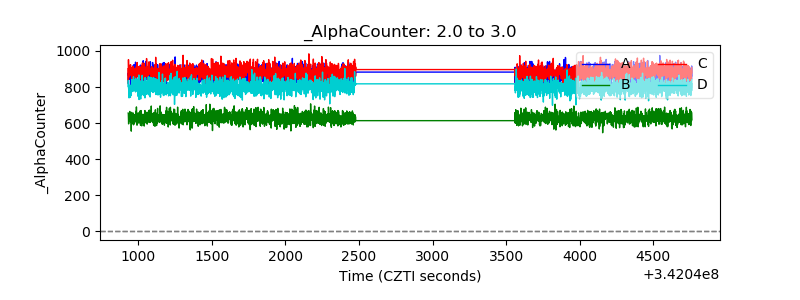 |
| _CPM_Rate | 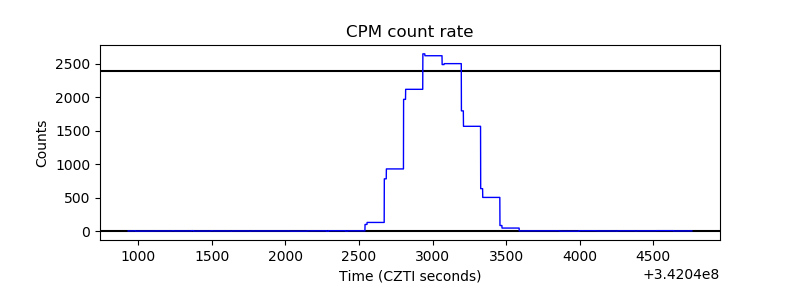 |
| CZT Counter | 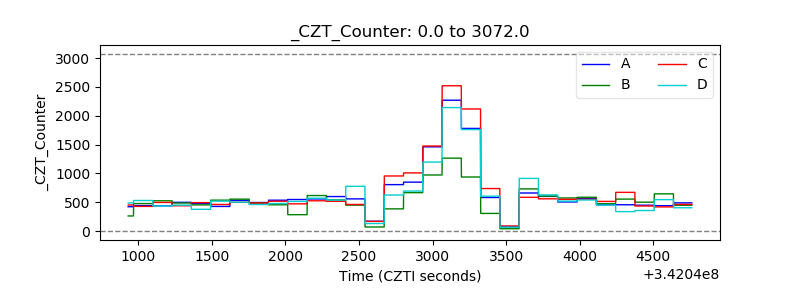 |
| +2.5 Volts monitor |  |
| +5 Volts monitor | 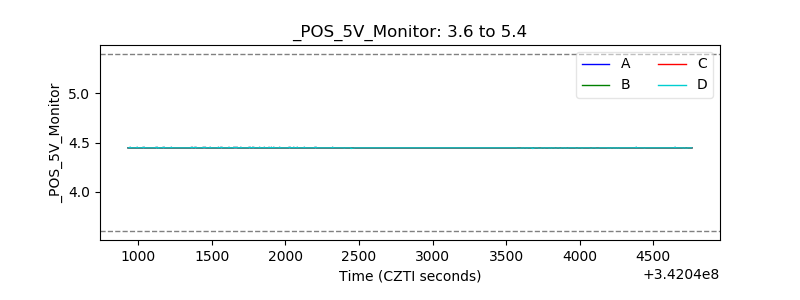 |
| _ROLL_ROT | 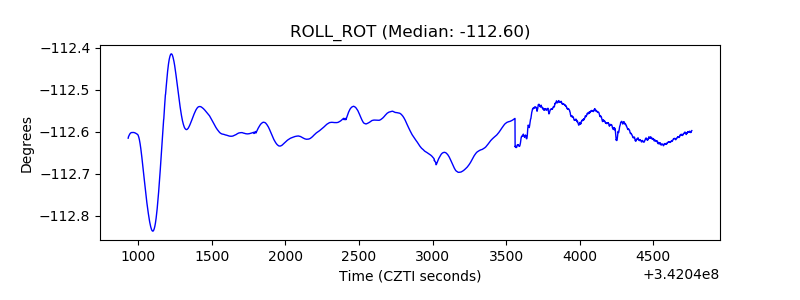 |
| _Roll_DEC | 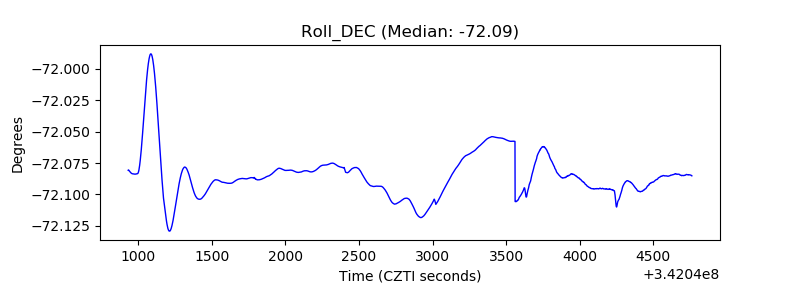 |
| _Roll_RA | 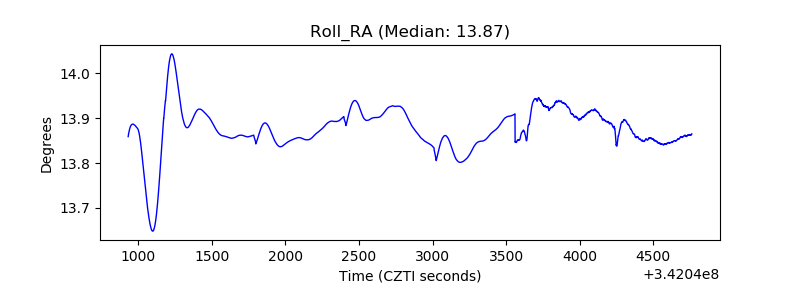 |
| Veto Counter | 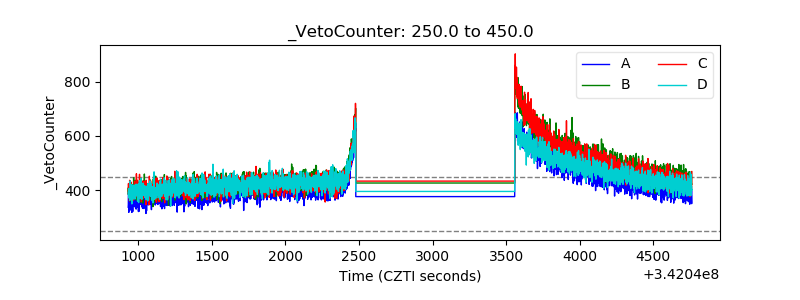 |