| Param | Original file | Final file |
|---|---|---|
| Filename | modeM0/AS1A09_038T13_9000003966_27572cztM0_level2.evt | modeM0/AS1A09_038T13_9000003966_27572cztM0_level2_quad_clean.evt |
| Size (bytes) | 103,783,680 | 31,392,000 |
| Size | 99.0 MB | 29.9 MB |
| Events in quadrant A | 736,788 | 213,023 |
| Events in quadrant B | 783,637 | 220,730 |
| Events in quadrant C | 739,689 | 207,988 |
| Events in quadrant D | 780,636 | 199,865 |
| Mode M9 | |||
|---|---|---|---|
| Quadrant | BADHDUFLAG | Total packets | Discarded packets |
| A | 0 | 5 | 0 |
| B | 0 | 6 | 0 |
| C | 0 | 6 | 0 |
| D | 0 | 6 | 0 |
| Mode M0 | |||
|---|---|---|---|
| Quadrant | BADHDUFLAG | Total packets | Discarded packets |
| A | 0 | 3091 | 0 |
| B | 0 | 3269 | 0 |
| C | 0 | 3085 | 0 |
| D | 0 | 3249 | 0 |
| Quadrant | Total seconds | Saturated seconds | Saturation percentage |
|---|---|---|---|
| A | 1460 | 7 | 0.479452% |
| B | 1460 | 3 | 0.205479% |
| C | 1460 | 6 | 0.410959% |
| D | 1460 | 5 | 0.342466% |
Noise dominated data is calculated using 1-second bins in cleaned event files. If a bin has >2000 counts, and if more than 50% of those come from <1% of pixels, then it is considered to be noise-dominated and hence unusable.
| Quadrant | # 1 sec bins | Bins with >0 counts | Bins with >2000 counts | High rate bins dominated by noise | Noise dominated (total time) | Noise dominated (detector-on time) | Marked lightcurve |
|---|---|---|---|---|---|---|---|
| A | 1460 | 1460 | 4 | 4 | 0.27% | 0.27% | 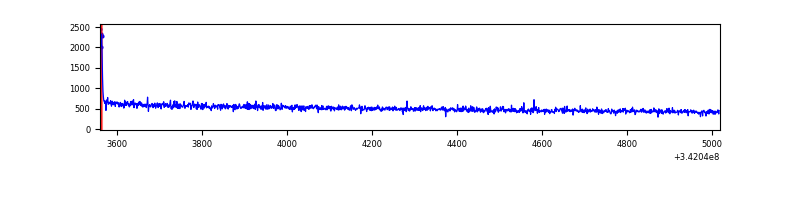 |
| B | 1460 | 1460 | 1 | 1 | 0.07% | 0.07% | 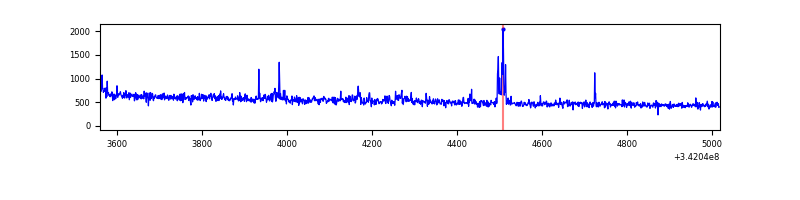 |
| C | 1460 | 1460 | 0 | 0 | 0.00% | 0.00% | 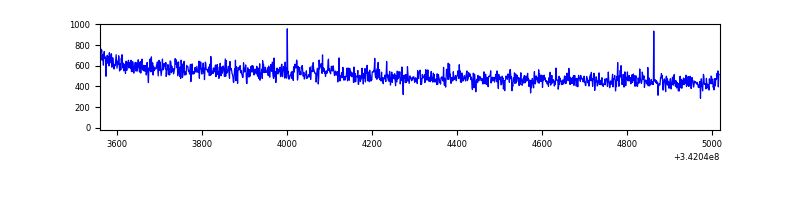 |
| D | 1460 | 1460 | 1 | 1 | 0.07% | 0.07% | 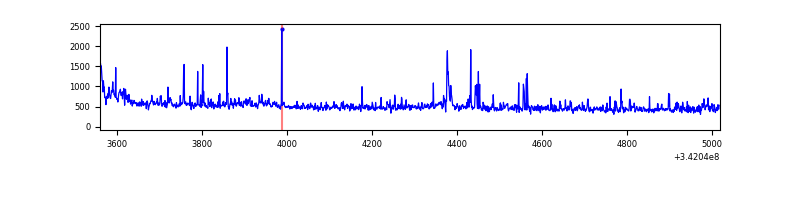 |
Top three noisy pixels from each quadrant. If the there are fewer than three noisy pixels in the level2.evt file, extra rows are filled as -1
| Pixel properties | Quadrant properties | ||||||
|---|---|---|---|---|---|---|---|
| Quadrant | DetID | PixID | Counts | Sigma | Mean | Median | Sigma |
| A | 8 | 192 | 9599 | 232.63 | 188 | 185 | 40.5 |
| A | 13 | 254 | 2813 | 64.94 | 188 | 185 | 40.5 |
| A | 3 | 137 | 1765 | 39.04 | 188 | 185 | 40.5 |
| B | 0 | 183 | 11941 | 311.4 | 190 | 186 | 37.7 |
| B | 0 | 230 | 7687 | 198.71 | 190 | 186 | 37.7 |
| B | 0 | 244 | 6499 | 167.24 | 190 | 186 | 37.7 |
| C | 14 | 238 | 29338 | 670.88 | 178 | 179 | 43.5 |
| C | 4 | 175 | 12316 | 279.24 | 178 | 179 | 43.5 |
| C | 1 | 16 | 1913 | 39.89 | 178 | 179 | 43.5 |
| D | 1 | 52 | 78210 | 1776.1 | 175 | 170 | 43.9 |
| D | 2 | 250 | 21531 | 486.15 | 175 | 170 | 43.9 |
| D | 6 | 112 | 8379 | 186.83 | 175 | 170 | 43.9 |
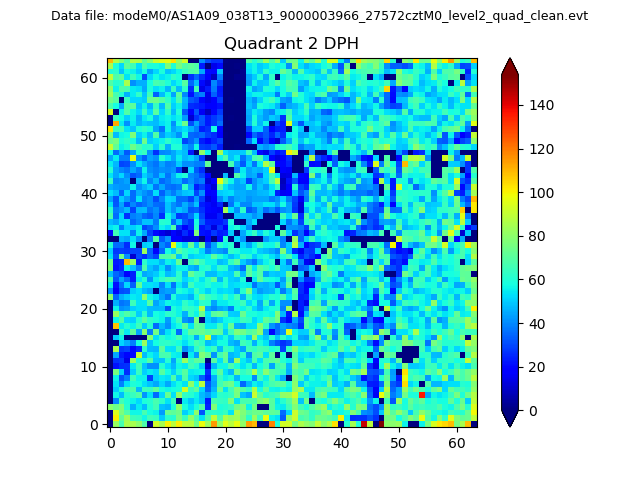
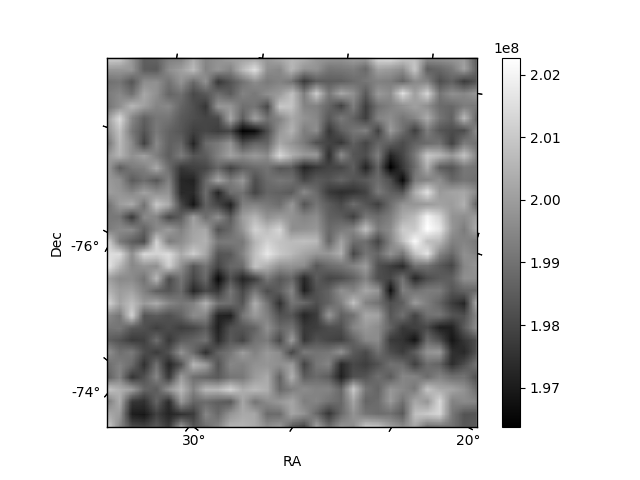
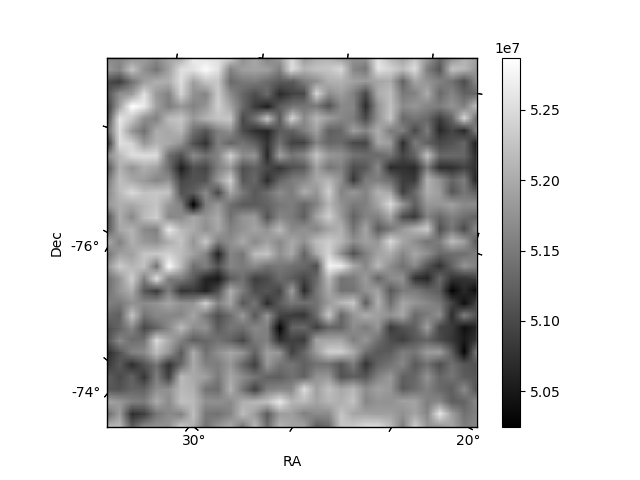
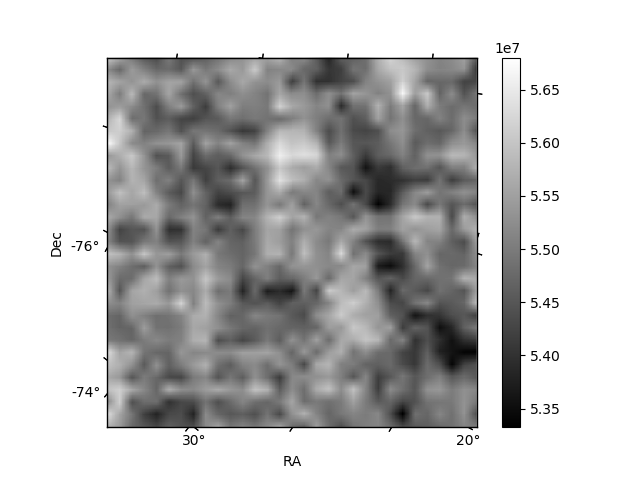
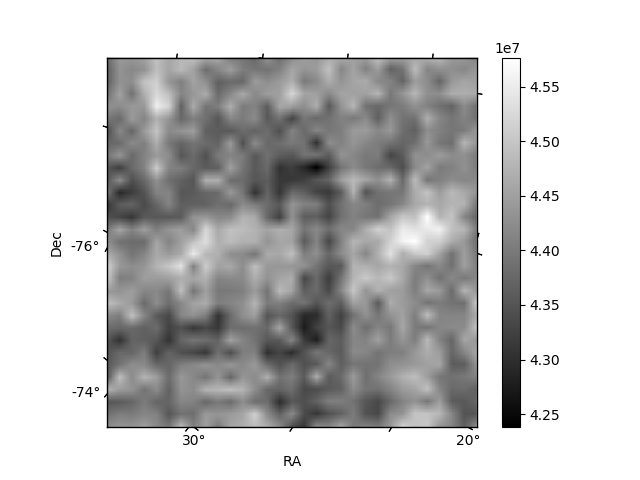
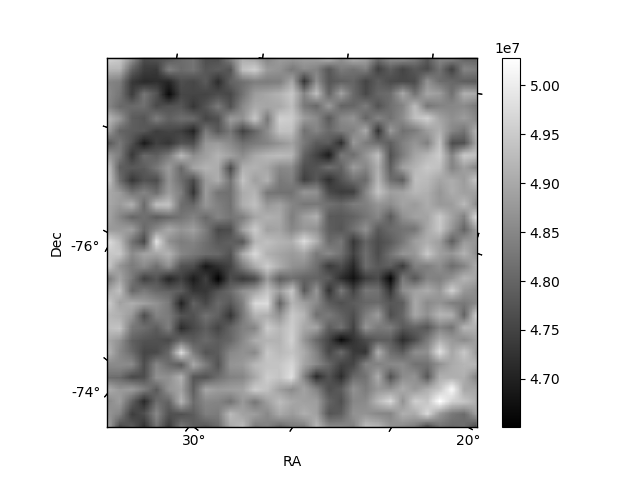
Histogram calculated using DETX and DETY for each event in the final _common_clean file
| Quadrant A | 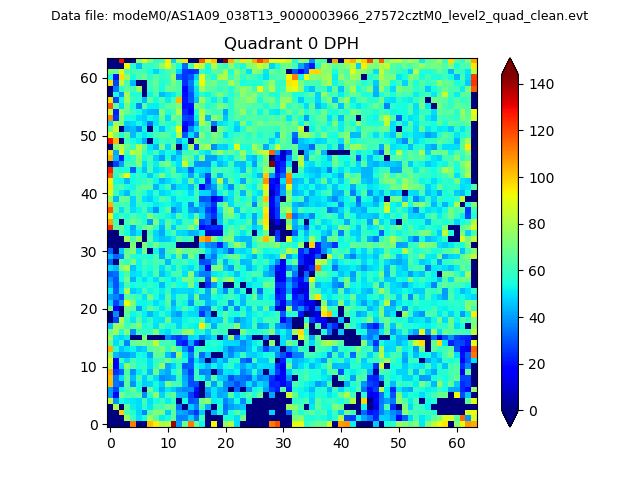 |
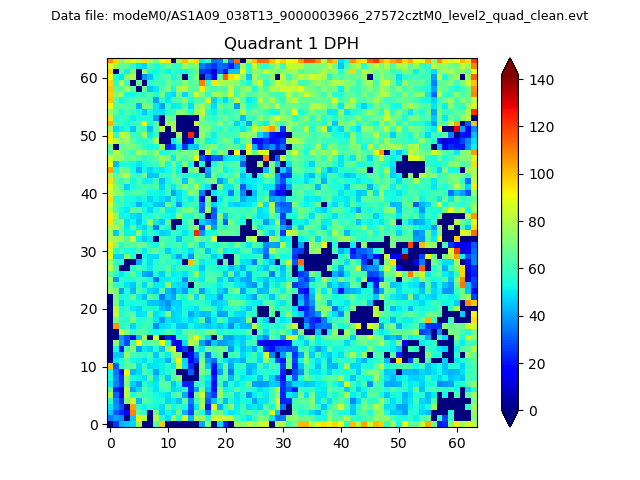 |
Quadrant B |
|---|---|---|---|
| Quadrant D | 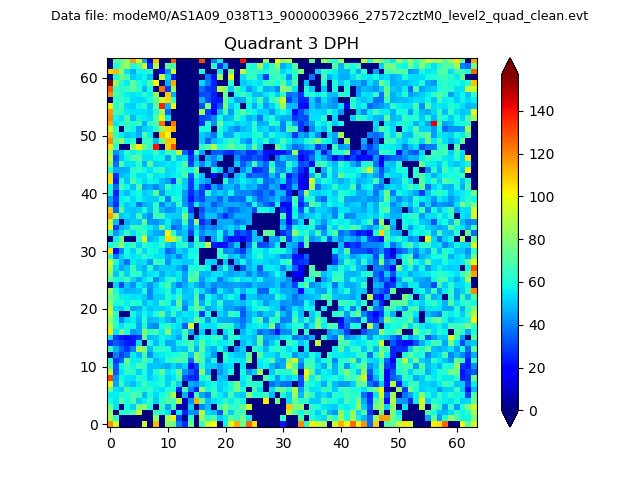 |
 |
Quadrant C |
| Plot type | Count rate plots | Images |
|---|---|---|
| Comparison with Poisson distribution Blue bars denote a histogram of data divided into 1 sec bins. Red curve is a Poisson curve with rate = median count rate of data. |
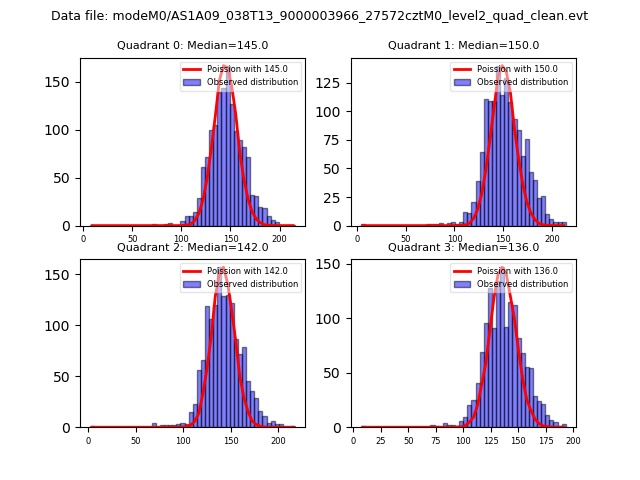 |
 |
| Quadrant-wise count rates Data is divided into 100 sec bins |
 |
|
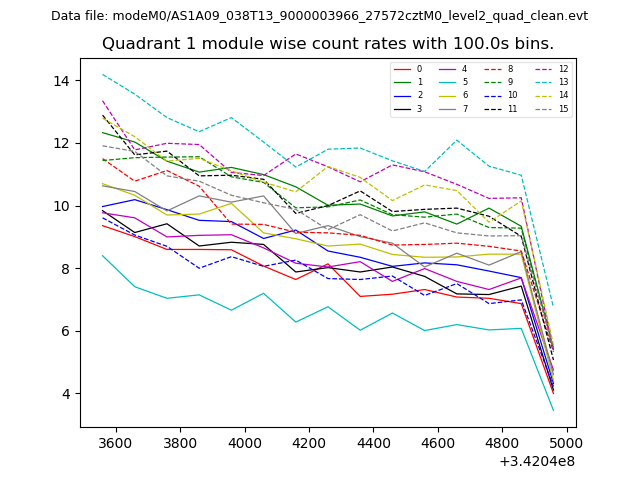
| Module-wise count rates for Quadrant A Data is divided into 100 sec bins |
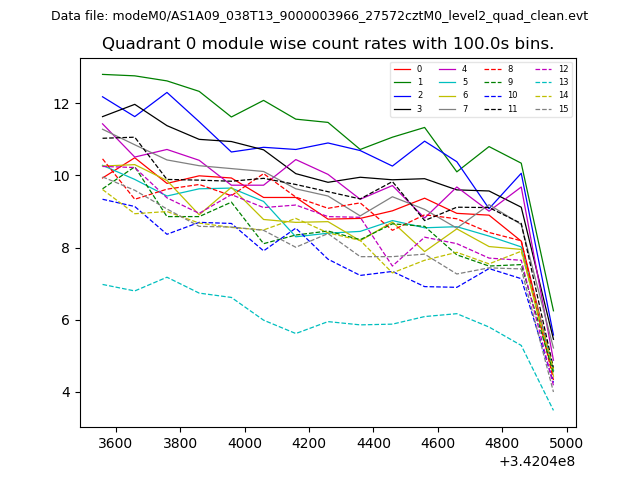 |
 |
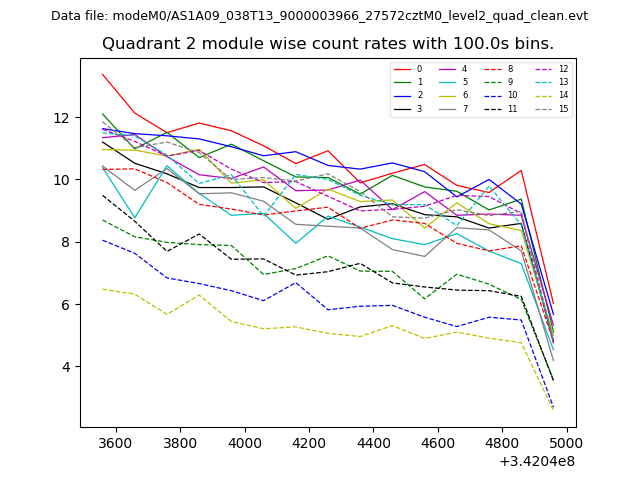
| Module-wise count rates for Quadrant B Data is divided into 100 sec bins |
 |
 |
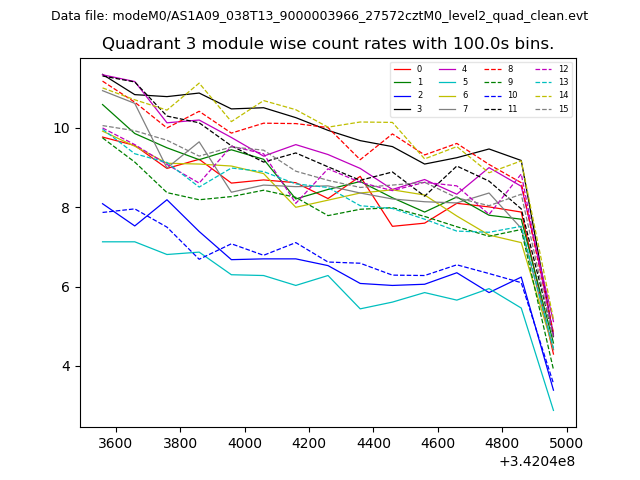
| Module-wise count rates for Quadrant C Data is divided into 100 sec bins |
 |
 |
| Module-wise count rates for Quadrant D Data is divided into 100 sec bins |
 |
 |
| Parameter | Plot |
|---|---|
| CZT HV Monitor | 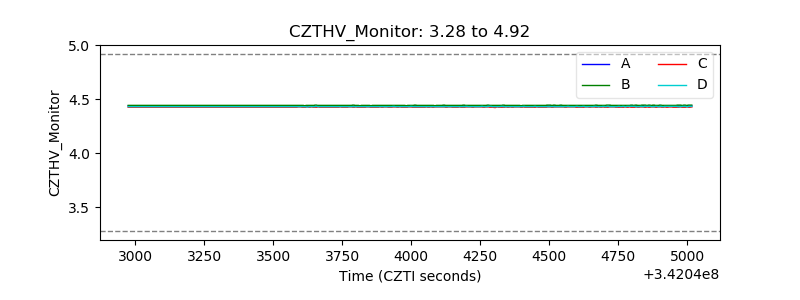 |
| D_VDD | 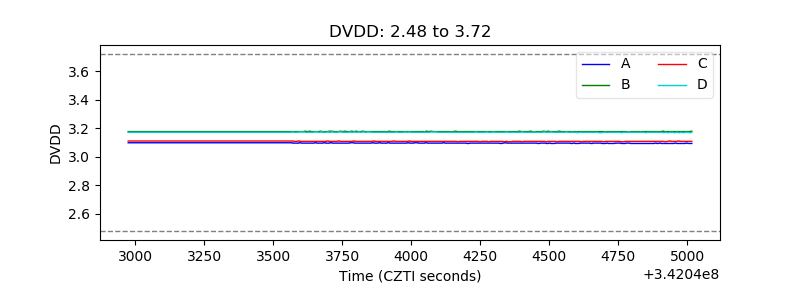 |
| Temperature 1 | 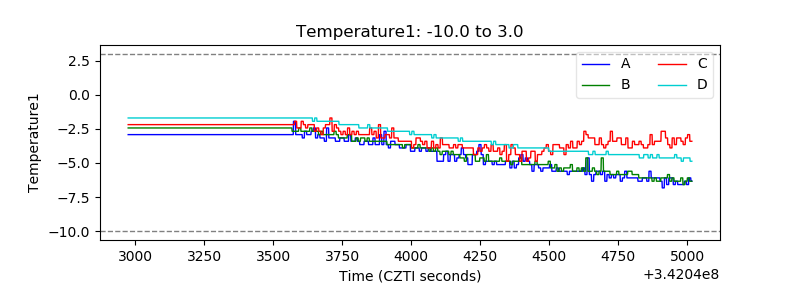 |
| Veto HV Monitor | 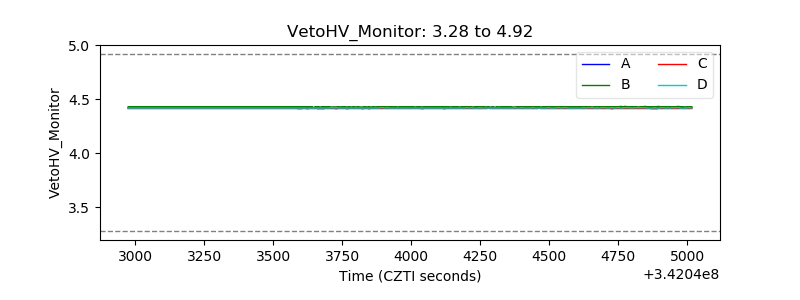 |
| Veto LLD | 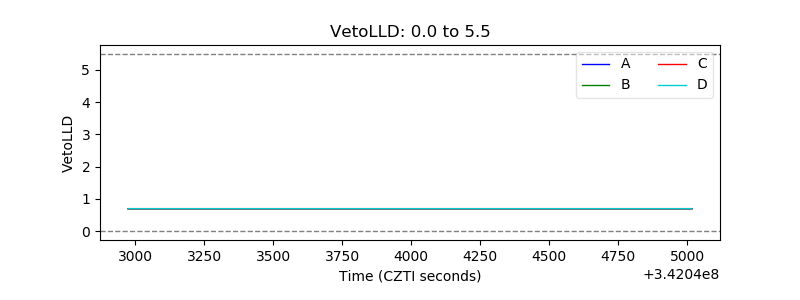 |
| Alpha Counter | 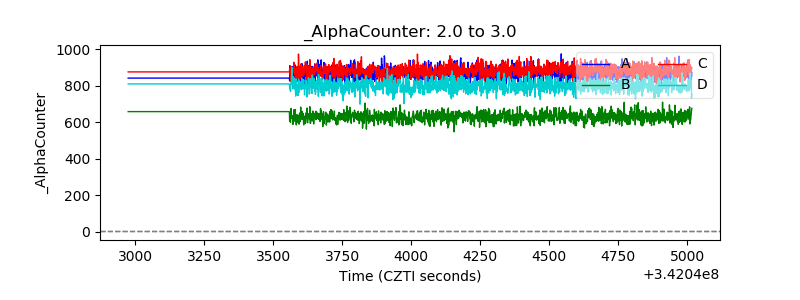 |
| _CPM_Rate |  |
| CZT Counter | 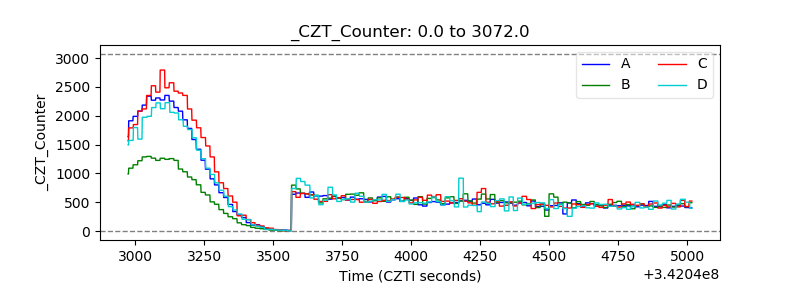 |
| +2.5 Volts monitor |  |
| +5 Volts monitor |  |
| _ROLL_ROT | 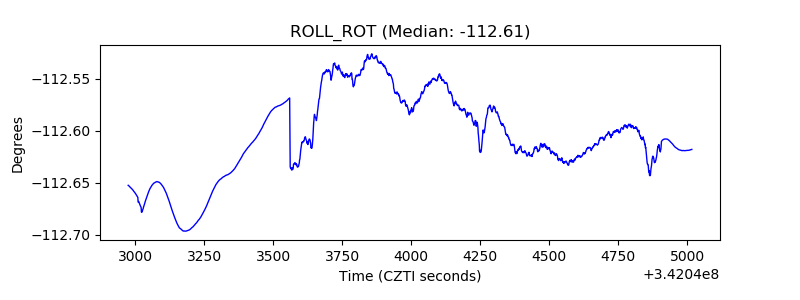 |
| _Roll_DEC | 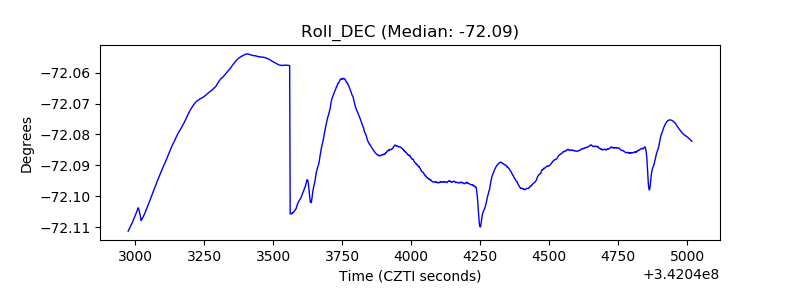 |
| _Roll_RA | 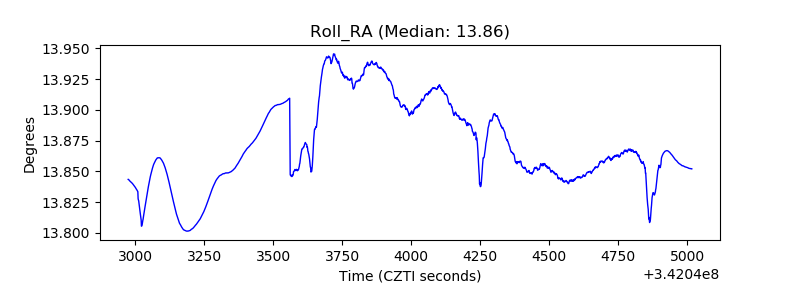 |
| Veto Counter | 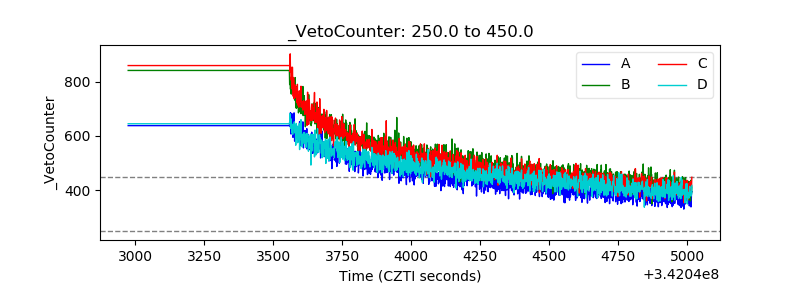 |