| Param | Original file | Final file |
|---|---|---|
| Filename | modeM0/AS1A09_038T14_9000003964cztM0_level2.fits | modeM0/AS1A09_038T14_9000003964cztM0_level2_quad_clean.evt |
| Size (bytes) | 38,214,720 | 44,910,720 |
| Size | 36.4 MB | 42.8 MB |
| Events in quadrant A | 233,118 | 288,014 |
| Events in quadrant B | 221,204 | 277,850 |
| Events in quadrant C | 225,104 | 265,619 |
| Events in quadrant D | 192,680 | 242,451 |
| Mode M9 | |||
|---|---|---|---|
| Quadrant | BADHDUFLAG | Total packets | Discarded packets |
| A | 0 | 9 | 0 |
| B | 0 | 9 | 0 |
| C | 0 | 9 | 0 |
| D | 0 | 9 | 0 |
| Mode M0 | |||
|---|---|---|---|
| Quadrant | BADHDUFLAG | Total packets | Discarded packets |
| A | 0 | 8318 | 0 |
| B | 0 | 9722 | 0 |
| C | 0 | 8265 | 0 |
| D | 0 | 11029 | 0 |
| Mode SS | |||
|---|---|---|---|
| Quadrant | BADHDUFLAG | Total packets | Discarded packets |
| A | 0 | 84 | 0 |
| B | 0 | 84 | 0 |
| C | 0 | 84 | 0 |
| D | 0 | 84 | 0 |
| Quadrant | Total seconds | Saturated seconds | Saturation percentage |
|---|---|---|---|
| A | 4041 | 26 | 0.643405% |
| B | 4041 | 157 | 3.885177% |
| C | 4041 | 46 | 1.138332% |
| D | 4041 | 139 | 3.439743% |
Noise dominated data is calculated using 1-second bins in cleaned event files. If a bin has >2000 counts, and if more than 50% of those come from <1% of pixels, then it is considered to be noise-dominated and hence unusable.
| Quadrant | # 1 sec bins | Bins with >0 counts | Bins with >2000 counts | High rate bins dominated by noise | Noise dominated (total time) | Noise dominated (detector-on time) | Marked lightcurve |
|---|---|---|---|---|---|---|---|
| A | 4960 | 4039 | 0 | 0 | 0.00% | 0.00% |  |
| B | 4961 | 4040 | 0 | 0 | 0.00% | 0.00% |  |
| C | 4960 | 4039 | 0 | 0 | 0.00% | 0.00% |  |
| D | 4961 | 4041 | 0 | 0 | 0.00% | 0.00% |  |
Top three noisy pixels from each quadrant. If the there are fewer than three noisy pixels in the level2.evt file, extra rows are filled as -1
| Pixel properties | Quadrant properties | ||||||
|---|---|---|---|---|---|---|---|
| Quadrant | DetID | PixID | Counts | Sigma | Mean | Median | Sigma |
| A | 14 | 188 | 244 | 11.15 | 60 | 57 | 16.8 |
| A | 0 | 29 | 224 | 9.96 | 60 | 57 | 16.8 |
| A | 14 | 204 | 222 | 9.84 | 60 | 57 | 16.8 |
| B | 2 | 9 | 172 | 8.71 | 58 | 55 | 13.4 |
| B | 14 | 254 | 160 | 7.81 | 58 | 55 | 13.4 |
| B | 12 | 37 | 153 | 7.29 | 58 | 55 | 13.4 |
| C | 1 | 81 | 182 | 7.5 | 59 | 55 | 16.9 |
| C | 1 | 80 | 169 | 6.73 | 59 | 55 | 16.9 |
| C | 7 | 111 | 162 | 6.32 | 59 | 55 | 16.9 |
| D | 10 | 189 | 158 | 6.48 | 55 | 50 | 16.7 |
| D | 6 | 67 | 154 | 6.24 | 55 | 50 | 16.7 |
| D | 12 | 6 | 140 | 5.4 | 55 | 50 | 16.7 |
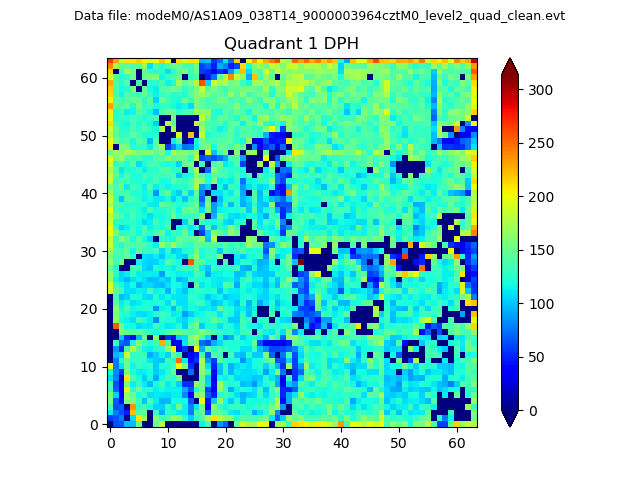
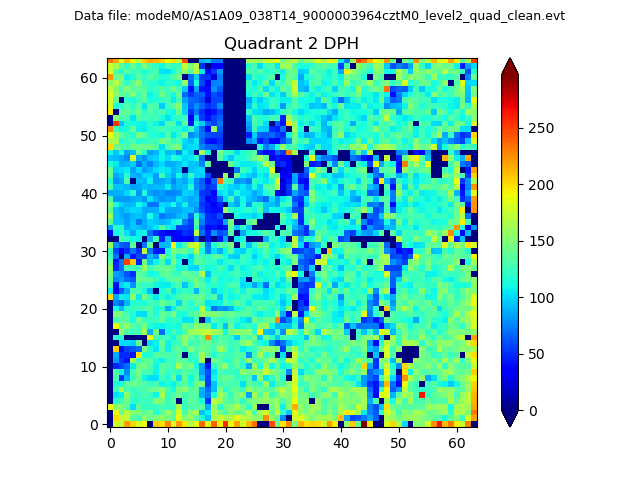
Histogram calculated using DETX and DETY for each event in the final _common_clean file
| Quadrant A |  |
 |
Quadrant B |
|---|---|---|---|
| Quadrant D |  |
 |
Quadrant C |
| Plot type | Count rate plots | Images |
|---|---|---|
| Comparison with Poisson distribution Blue bars denote a histogram of data divided into 1 sec bins. Red curve is a Poisson curve with rate = median count rate of data. |
 |
 |
| Quadrant-wise count rates Data is divided into 100 sec bins |
 |
|
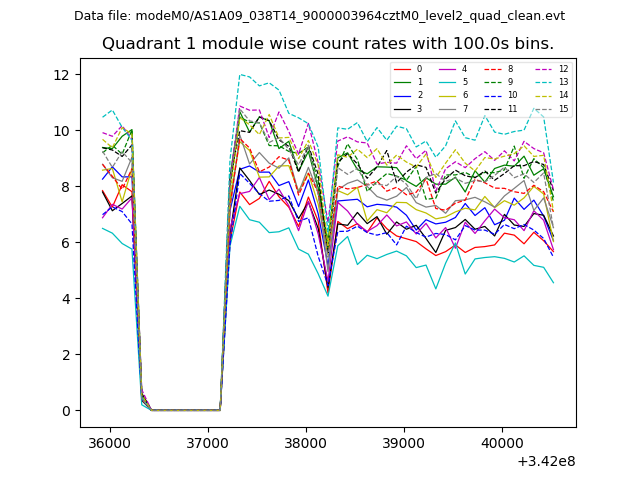
| Module-wise count rates for Quadrant A Data is divided into 100 sec bins |
 |
 |
| Module-wise count rates for Quadrant B Data is divided into 100 sec bins |
 |
 |
| Module-wise count rates for Quadrant C Data is divided into 100 sec bins |
 |
 |
| Module-wise count rates for Quadrant D Data is divided into 100 sec bins |
 |
 |
| Parameter | Plot |
|---|---|
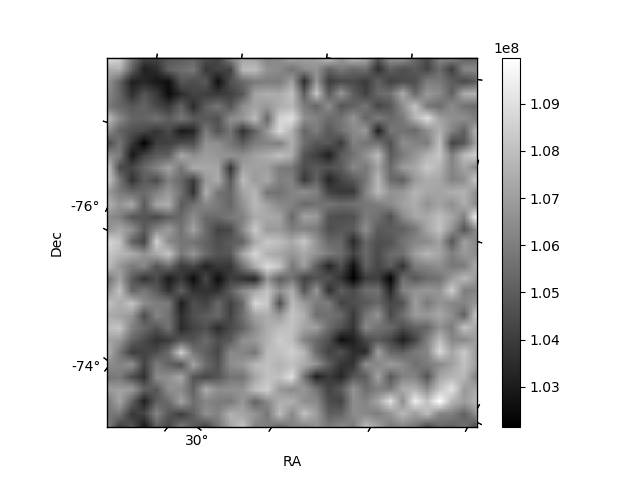
| CZT HV Monitor | 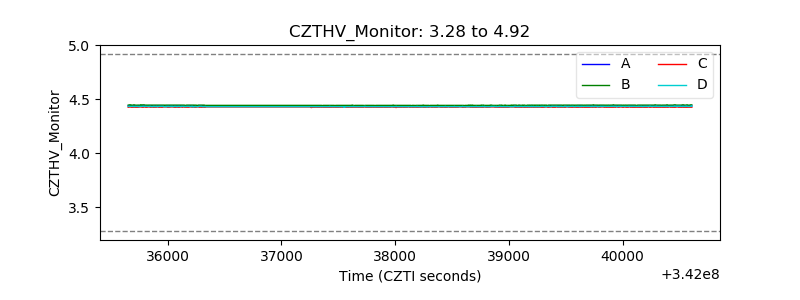 |
| D_VDD | 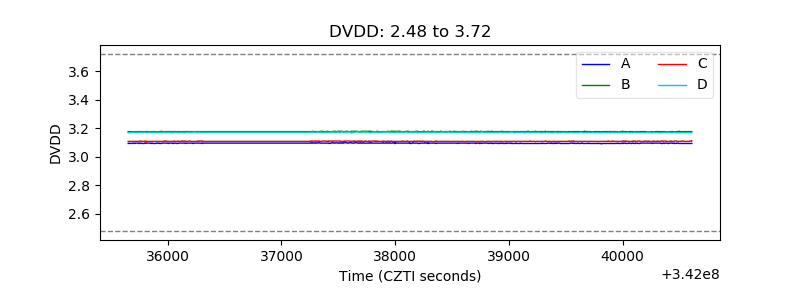 |
| Temperature 1 |  |
| Veto HV Monitor |  |
| Veto LLD |  |
| Alpha Counter |  |
| _CPM_Rate |  |
| CZT Counter |  |
| +2.5 Volts monitor |  |
| +5 Volts monitor |  |
| _ROLL_ROT |  |
| _Roll_DEC |  |
| _Roll_RA |  |
| Veto Counter | 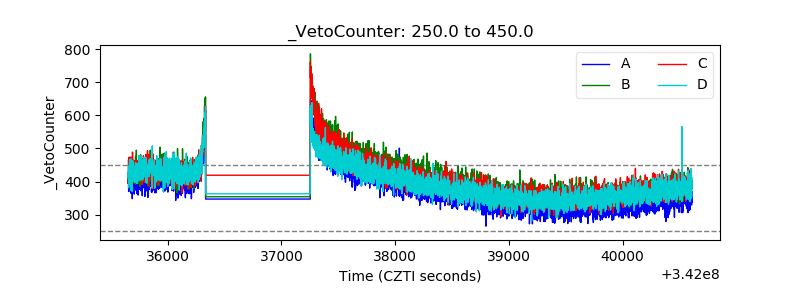 |