| Param | Original file | Final file |
|---|---|---|
| Filename | modeM0/AS1A09_038T14_9000003964_27569cztM0_level2.evt | modeM0/AS1A09_038T14_9000003964_27569cztM0_level2_quad_clean.evt |
| Size (bytes) | 171,149,760 | 35,098,560 |
| Size | 163.2 MB | 33.5 MB |
| Events in quadrant A | 1,043,069 | 235,164 |
| Events in quadrant B | 1,391,285 | 233,040 |
| Events in quadrant C | 1,025,678 | 230,189 |
| Events in quadrant D | 1,583,951 | 217,405 |
| Mode M9 | |||
|---|---|---|---|
| Quadrant | BADHDUFLAG | Total packets | Discarded packets |
| A | 0 | 9 | 0 |
| B | 0 | 9 | 0 |
| C | 0 | 9 | 0 |
| D | 0 | 9 | 0 |
| Mode M0 | |||
|---|---|---|---|
| Quadrant | BADHDUFLAG | Total packets | Discarded packets |
| A | 0 | 4258 | 0 |
| B | 0 | 5354 | 0 |
| C | 0 | 4207 | 0 |
| D | 0 | 6032 | 0 |
| Quadrant | Total seconds | Saturated seconds | Saturation percentage |
|---|---|---|---|
| A | 2013 | 25 | 1.241927% |
| B | 2013 | 141 | 7.004471% |
| C | 2013 | 35 | 1.738698% |
| D | 2013 | 99 | 4.918033% |
Noise dominated data is calculated using 1-second bins in cleaned event files. If a bin has >2000 counts, and if more than 50% of those come from <1% of pixels, then it is considered to be noise-dominated and hence unusable.
| Quadrant | # 1 sec bins | Bins with >0 counts | Bins with >2000 counts | High rate bins dominated by noise | Noise dominated (total time) | Noise dominated (detector-on time) | Marked lightcurve |
|---|---|---|---|---|---|---|---|
| A | 2933 | 2014 | 2 | 2 | 0.07% | 0.10% | 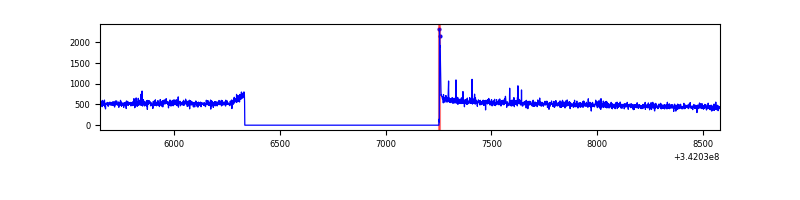 |
| B | 2933 | 2014 | 88 | 88 | 3.00% | 4.37% | 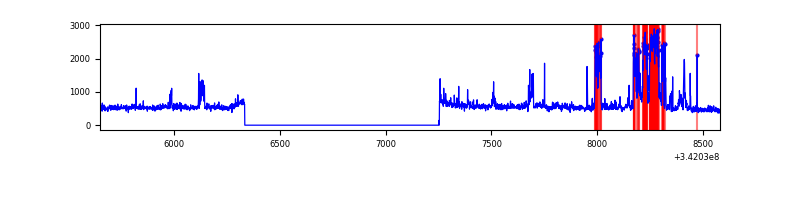 |
| C | 2933 | 2014 | 0 | 0 | 0.00% | 0.00% | 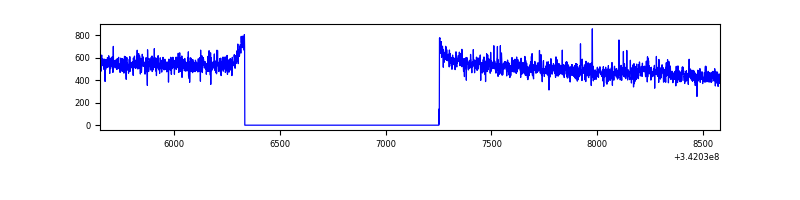 |
| D | 2933 | 2014 | 77 | 77 | 2.63% | 3.82% | 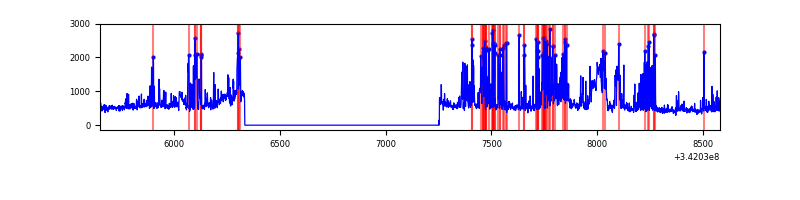 |
Top three noisy pixels from each quadrant. If the there are fewer than three noisy pixels in the level2.evt file, extra rows are filled as -1
| Pixel properties | Quadrant properties | ||||||
|---|---|---|---|---|---|---|---|
| Quadrant | DetID | PixID | Counts | Sigma | Mean | Median | Sigma |
| A | 8 | 192 | 9389 | 165.54 | 266 | 261 | 55.1 |
| A | 13 | 254 | 3644 | 61.35 | 266 | 261 | 55.1 |
| A | 13 | 248 | 3131 | 52.05 | 266 | 261 | 55.1 |
| B | 10 | 245 | 334190 | 6466.15 | 259 | 252 | 51.6 |
| B | 15 | 32 | 12352 | 234.3 | 259 | 252 | 51.6 |
| B | 0 | 230 | 11694 | 221.56 | 259 | 252 | 51.6 |
| C | 14 | 238 | 40693 | 665.93 | 250 | 250 | 60.7 |
| C | 14 | 67 | 7509 | 119.53 | 250 | 250 | 60.7 |
| C | 13 | 61 | 1725 | 24.29 | 250 | 250 | 60.7 |
| D | 1 | 52 | 431209 | 6984.28 | 250 | 241 | 61.7 |
| D | 12 | 233 | 111259 | 1799.16 | 250 | 241 | 61.7 |
| D | 2 | 250 | 42527 | 685.29 | 250 | 241 | 61.7 |
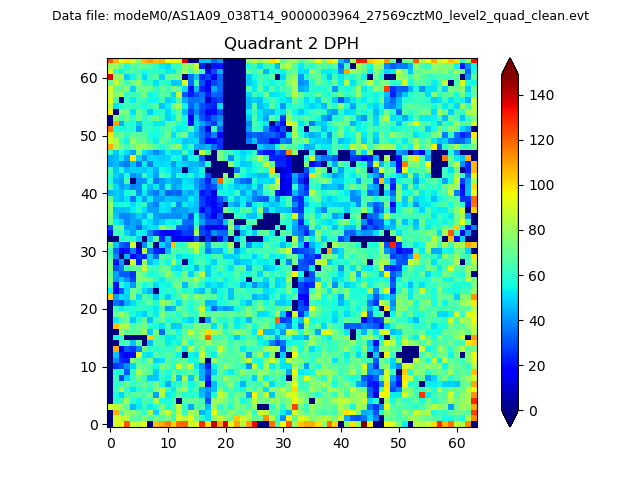
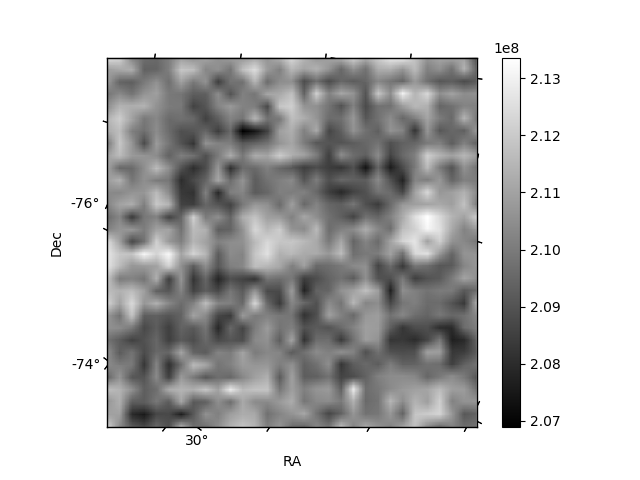
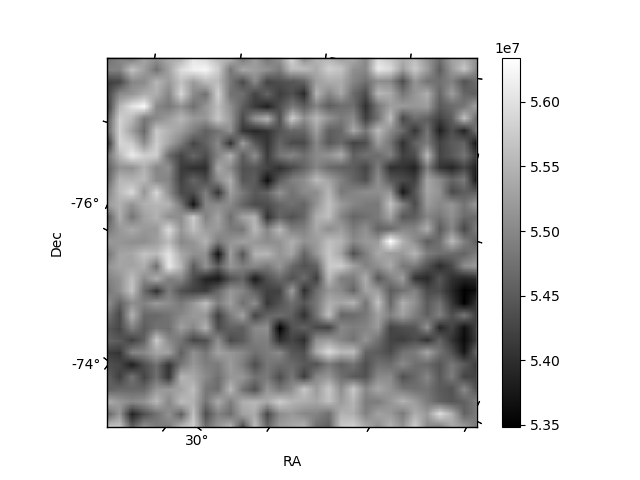
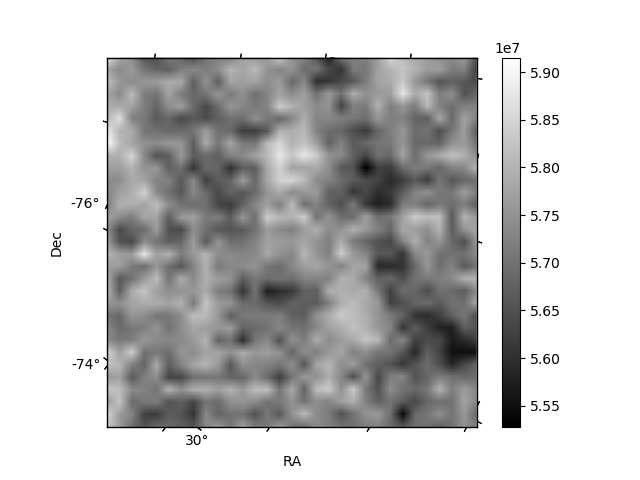
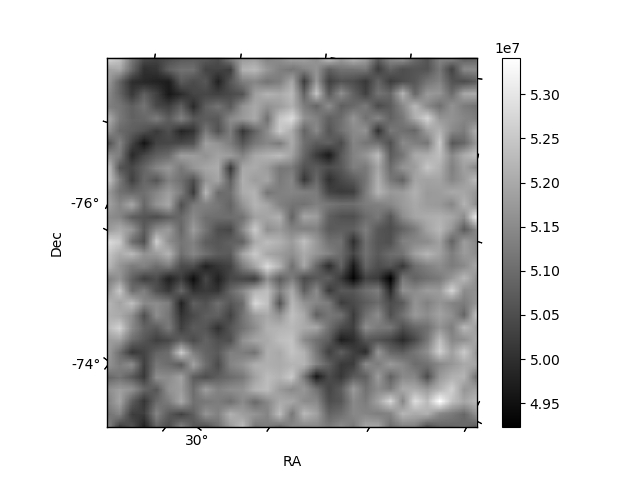
Histogram calculated using DETX and DETY for each event in the final _common_clean file
| Quadrant A | 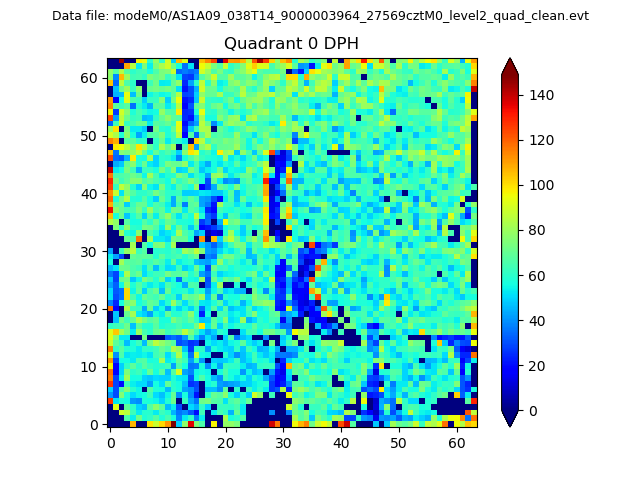 |
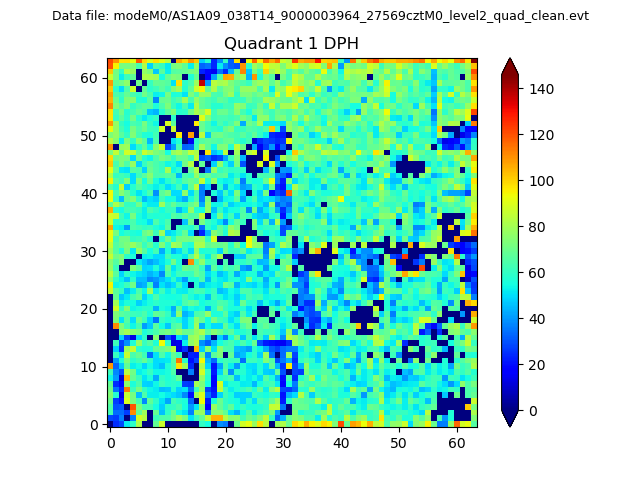 |
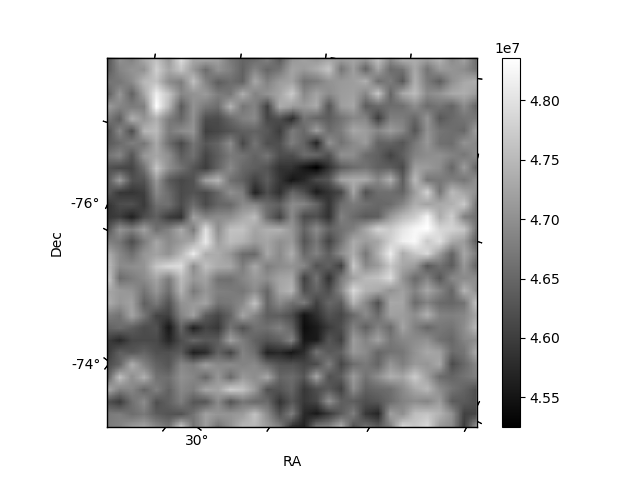
Quadrant B |
|---|---|---|---|
| Quadrant D | 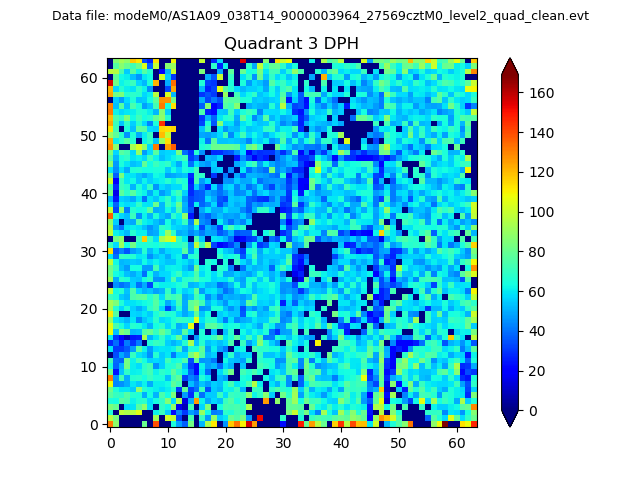 |
 |
Quadrant C |
| Plot type | Count rate plots | Images |
|---|---|---|
| Comparison with Poisson distribution Blue bars denote a histogram of data divided into 1 sec bins. Red curve is a Poisson curve with rate = median count rate of data. |
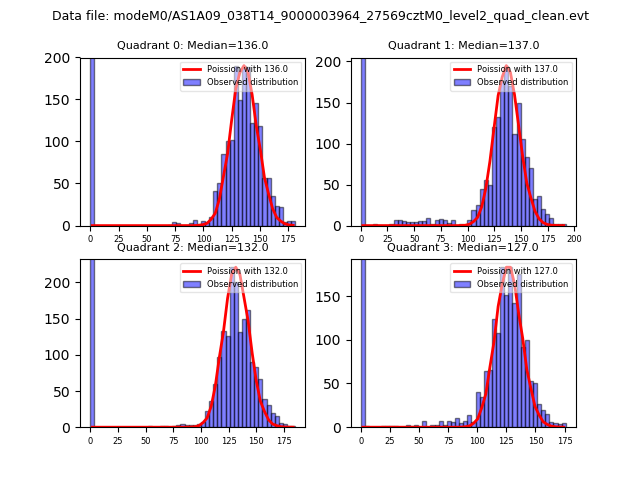 |
 |
| Quadrant-wise count rates Data is divided into 100 sec bins |
 |
|
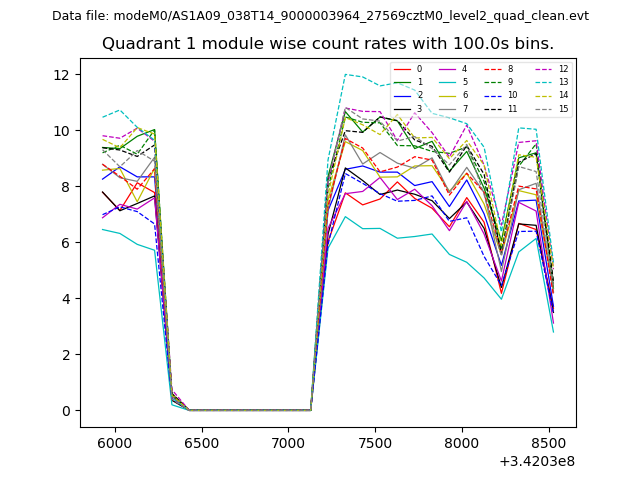
| Module-wise count rates for Quadrant A Data is divided into 100 sec bins |
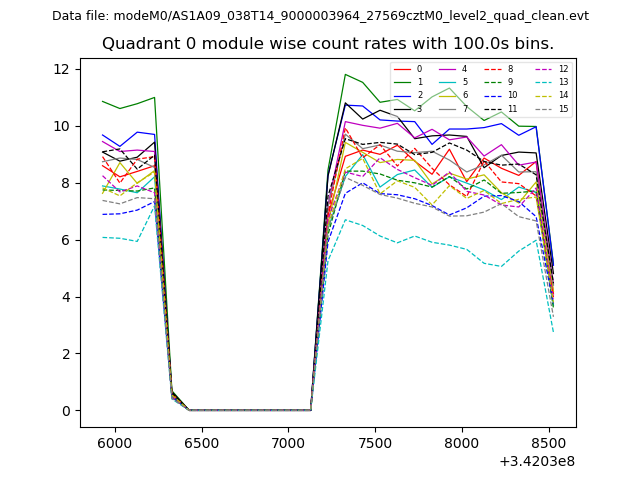 |
 |
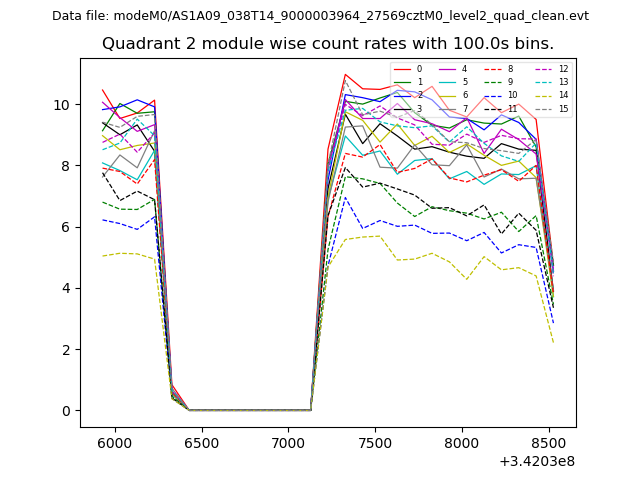
| Module-wise count rates for Quadrant B Data is divided into 100 sec bins |
 |
 |
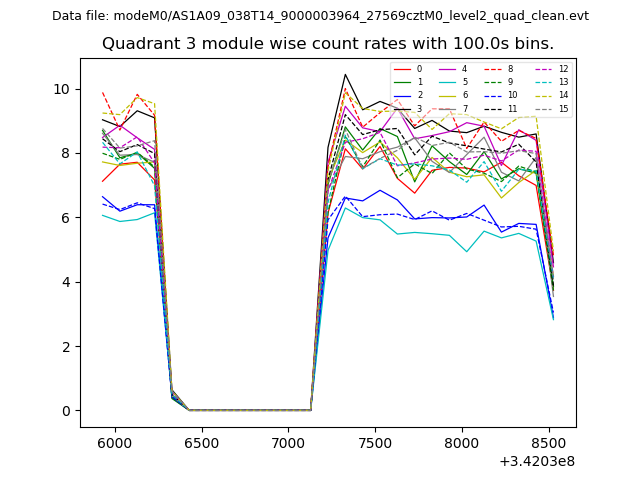
| Module-wise count rates for Quadrant C Data is divided into 100 sec bins |
 |
 |
| Module-wise count rates for Quadrant D Data is divided into 100 sec bins |
 |
 |
| Parameter | Plot |
|---|---|
| CZT HV Monitor | 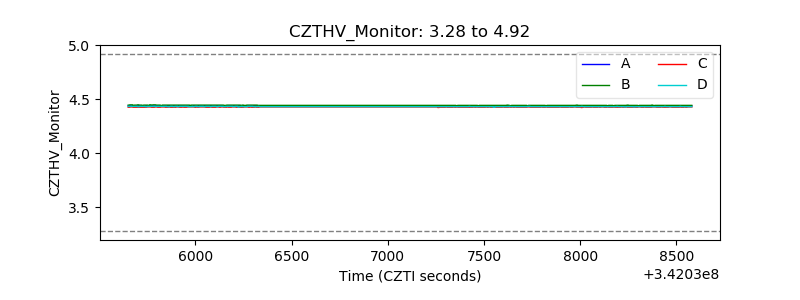 |
| D_VDD | 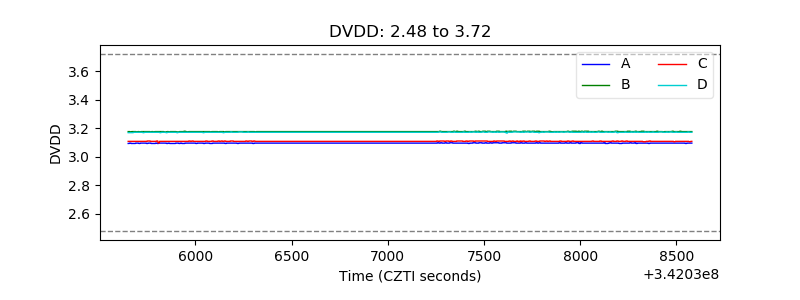 |
| Temperature 1 | 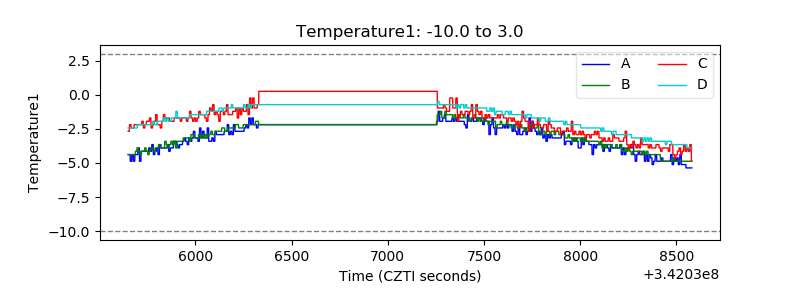 |
| Veto HV Monitor |  |
| Veto LLD |  |
| Alpha Counter |  |
| _CPM_Rate | 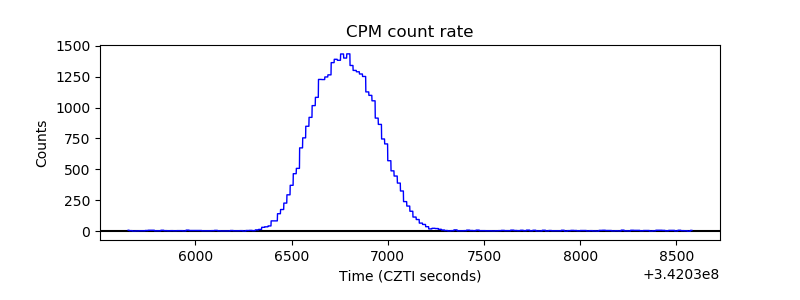 |
| CZT Counter | 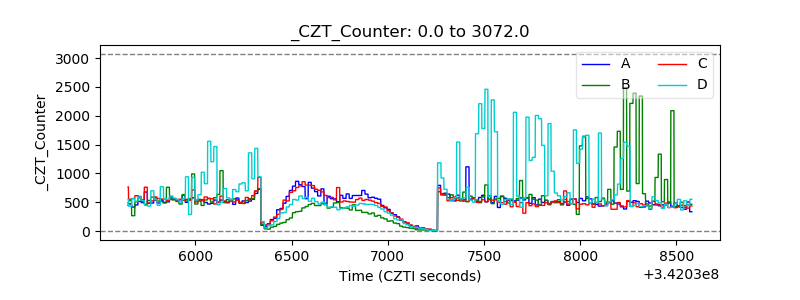 |
| +2.5 Volts monitor |  |
| +5 Volts monitor |  |
| _ROLL_ROT | 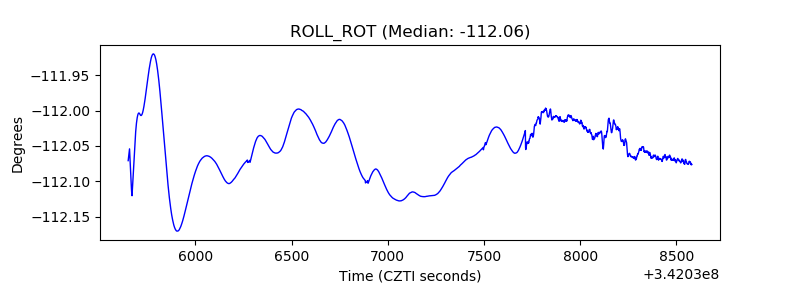 |
| _Roll_DEC | 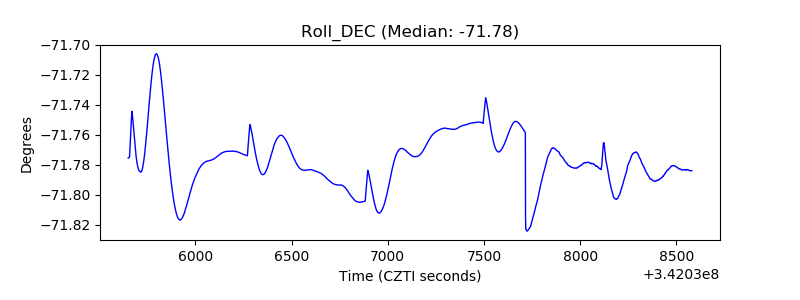 |
| _Roll_RA | 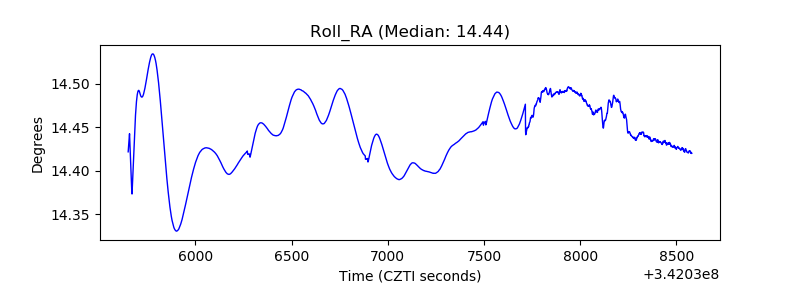 |
| Veto Counter | 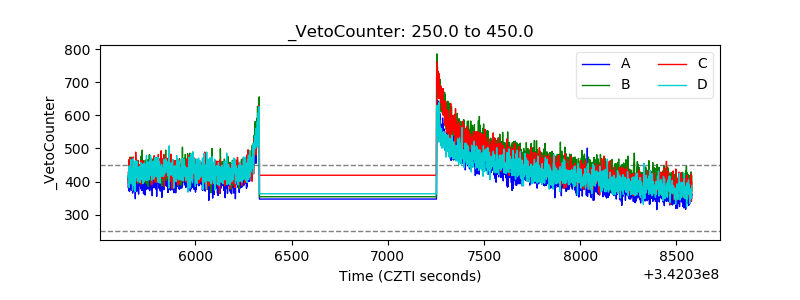 |