| Param | Original file | Final file |
|---|---|---|
| Filename | modeM0/AS1A09_038T14_9000003964_27570cztM0_level2.evt | modeM0/AS1A09_038T14_9000003964_27570cztM0_level2_quad_clean.evt |
| Size (bytes) | 244,932,480 | 62,464,320 |
| Size | 233.6 MB | 59.6 MB |
| Events in quadrant A | 1,488,926 | 428,993 |
| Events in quadrant B | 1,961,834 | 426,775 |
| Events in quadrant C | 1,488,109 | 406,441 |
| Events in quadrant D | 2,248,938 | 390,936 |
| Mode M9 | |||
|---|---|---|---|
| Quadrant | BADHDUFLAG | Total packets | Discarded packets |
| A | 0 | 2 | 0 |
| B | 0 | 3 | 0 |
| C | 0 | 3 | 0 |
| D | 0 | 3 | 0 |
| Mode M0 | |||
|---|---|---|---|
| Quadrant | BADHDUFLAG | Total packets | Discarded packets |
| A | 0 | 6879 | 0 |
| B | 0 | 8200 | 0 |
| C | 0 | 6793 | 0 |
| D | 0 | 9114 | 0 |
| Quadrant | Total seconds | Saturated seconds | Saturation percentage |
|---|---|---|---|
| A | 3356 | 11 | 0.327771% |
| B | 3356 | 135 | 4.022646% |
| C | 3356 | 29 | 0.864124% |
| D | 3356 | 107 | 3.188319% |
Noise dominated data is calculated using 1-second bins in cleaned event files. If a bin has >2000 counts, and if more than 50% of those come from <1% of pixels, then it is considered to be noise-dominated and hence unusable.
| Quadrant | # 1 sec bins | Bins with >0 counts | Bins with >2000 counts | High rate bins dominated by noise | Noise dominated (total time) | Noise dominated (detector-on time) | Marked lightcurve |
|---|---|---|---|---|---|---|---|
| A | 3356 | 3356 | 2 | 2 | 0.06% | 0.06% | 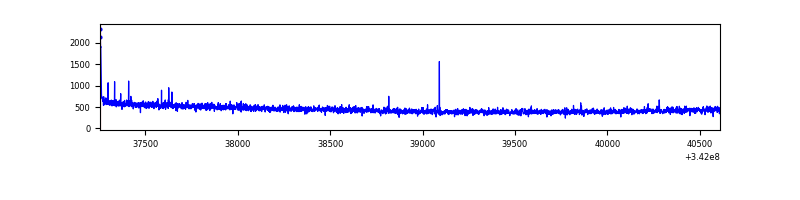 |
| B | 3356 | 3356 | 104 | 104 | 3.10% | 3.10% | 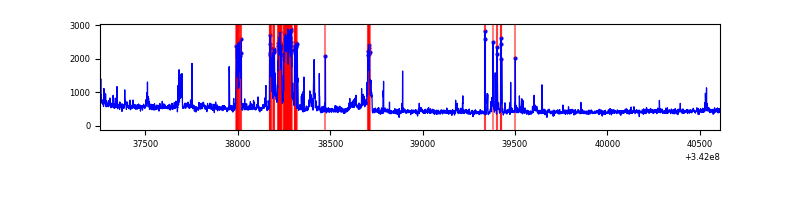 |
| C | 3356 | 3356 | 0 | 0 | 0.00% | 0.00% | 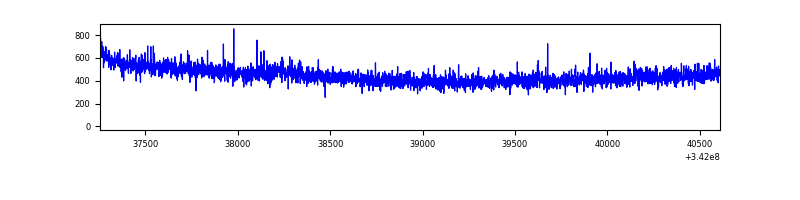 |
| D | 3356 | 3356 | 110 | 110 | 3.28% | 3.28% | 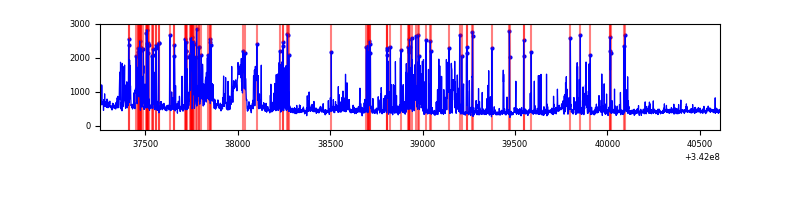 |
Top three noisy pixels from each quadrant. If the there are fewer than three noisy pixels in the level2.evt file, extra rows are filled as -1
| Pixel properties | Quadrant properties | ||||||
|---|---|---|---|---|---|---|---|
| Quadrant | DetID | PixID | Counts | Sigma | Mean | Median | Sigma |
| A | 8 | 192 | 9550 | 118.27 | 381 | 375 | 77.6 |
| A | 13 | 254 | 6194 | 75.01 | 381 | 375 | 77.6 |
| A | 3 | 137 | 3550 | 40.93 | 381 | 375 | 77.6 |
| B | 10 | 245 | 417464 | 5684.8 | 378 | 368 | 73.4 |
| B | 0 | 230 | 19265 | 257.56 | 378 | 368 | 73.4 |
| B | 15 | 32 | 12519 | 165.61 | 378 | 368 | 73.4 |
| C | 14 | 238 | 59898 | 694.59 | 361 | 364 | 85.7 |
| C | 7 | 221 | 8284 | 92.4 | 361 | 364 | 85.7 |
| C | 14 | 67 | 7474 | 82.95 | 361 | 364 | 85.7 |
| D | 1 | 52 | 634453 | 7306.57 | 354 | 343 | 86.8 |
| D | 12 | 233 | 116319 | 1336.34 | 354 | 343 | 86.8 |
| D | 2 | 250 | 85022 | 975.72 | 354 | 343 | 86.8 |
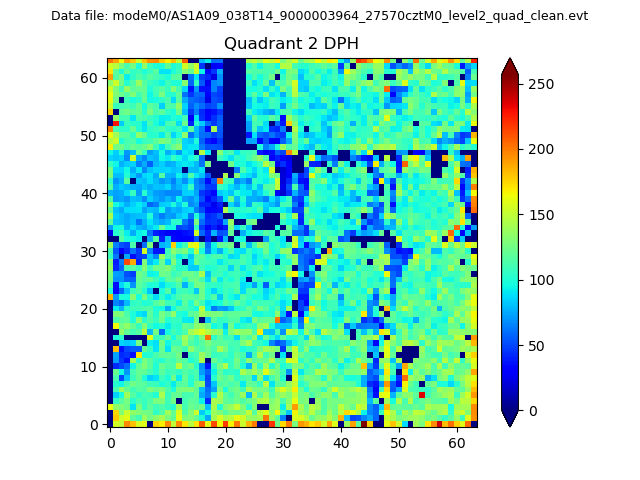
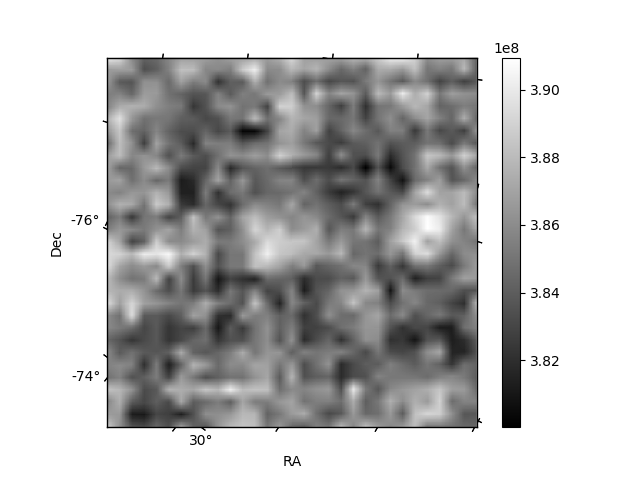
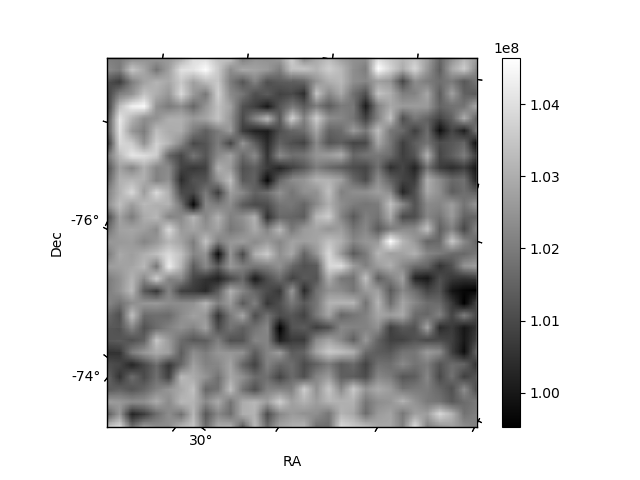
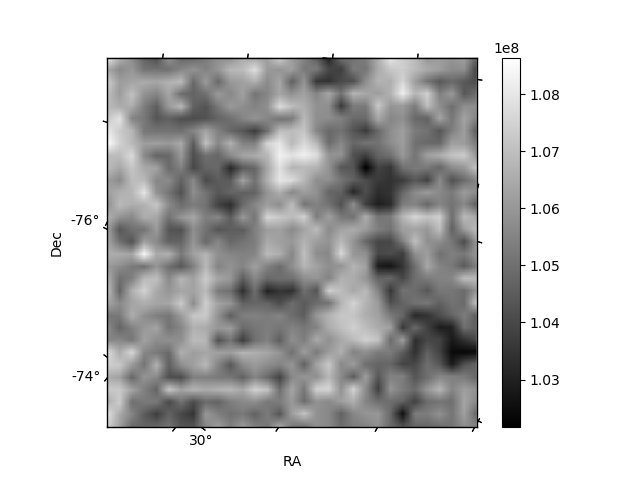
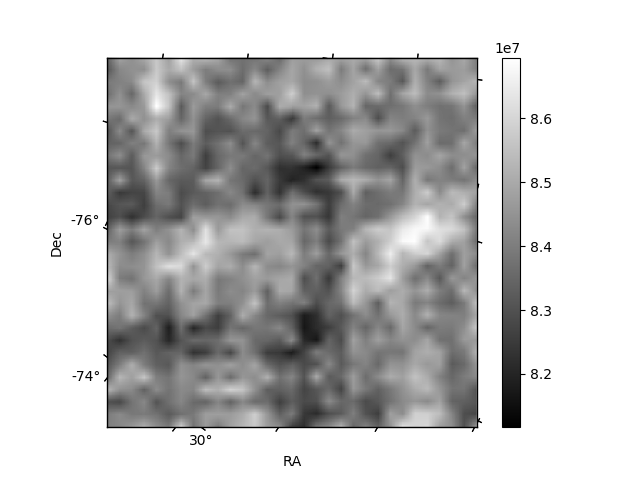
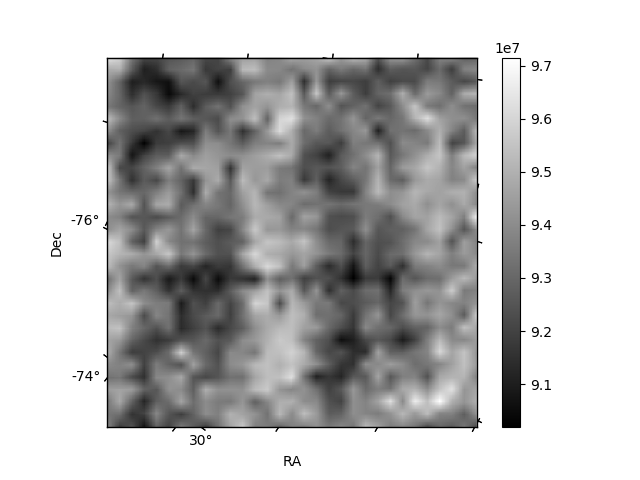
Histogram calculated using DETX and DETY for each event in the final _common_clean file
| Quadrant A | 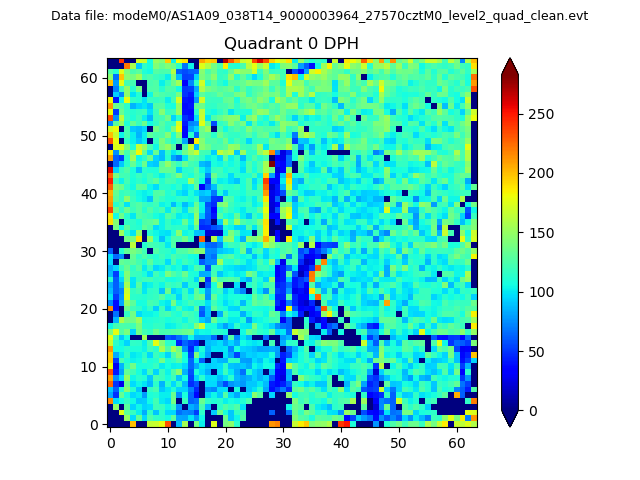 |
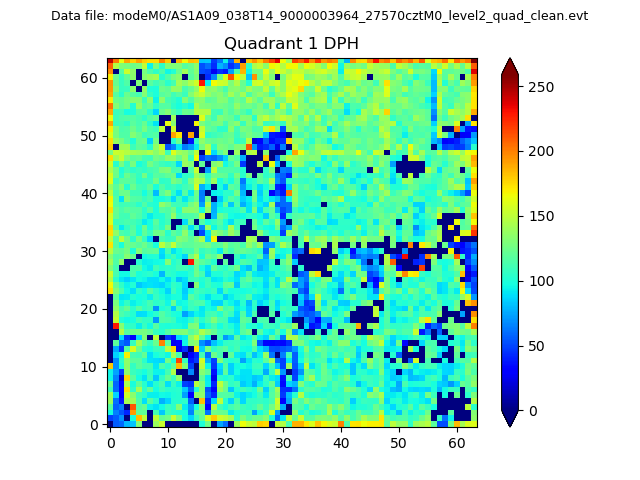 |
Quadrant B |
|---|---|---|---|
| Quadrant D | 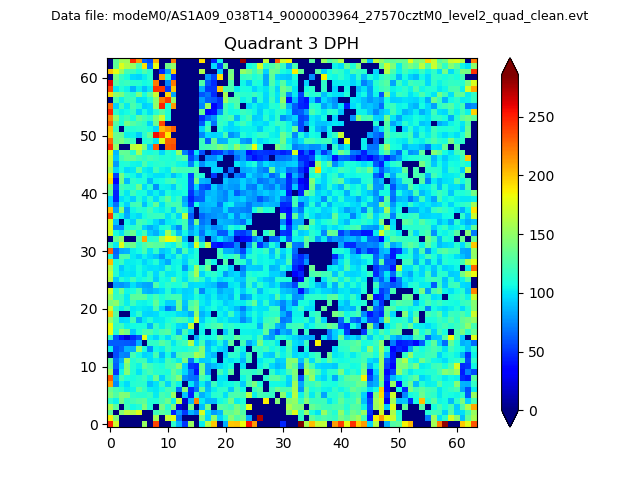 |
 |
Quadrant C |
| Plot type | Count rate plots | Images |
|---|---|---|
| Comparison with Poisson distribution Blue bars denote a histogram of data divided into 1 sec bins. Red curve is a Poisson curve with rate = median count rate of data. |
 |
 |
| Quadrant-wise count rates Data is divided into 100 sec bins |
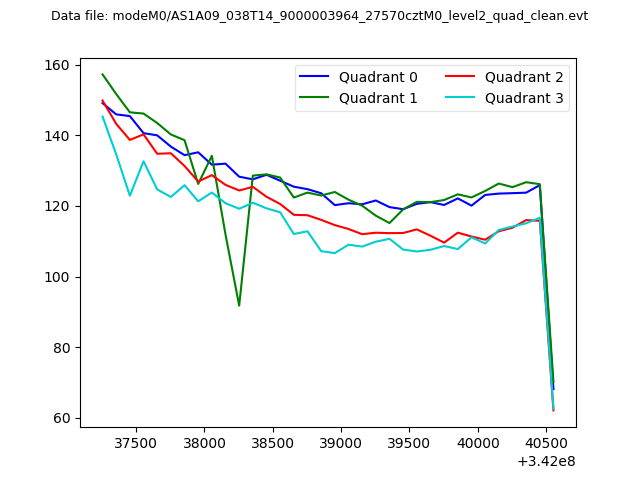 |
|
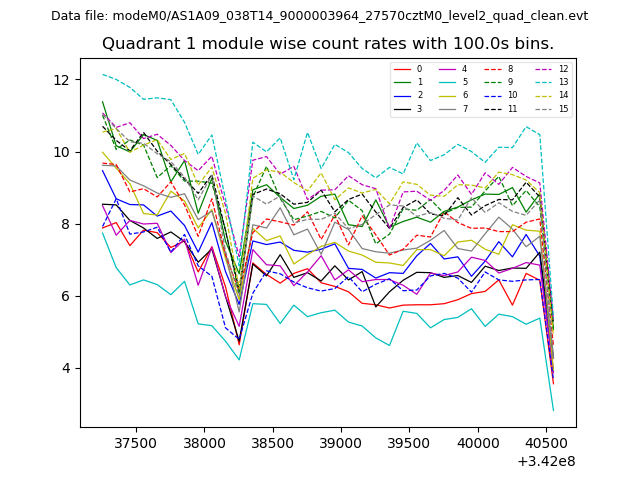
| Module-wise count rates for Quadrant A Data is divided into 100 sec bins |
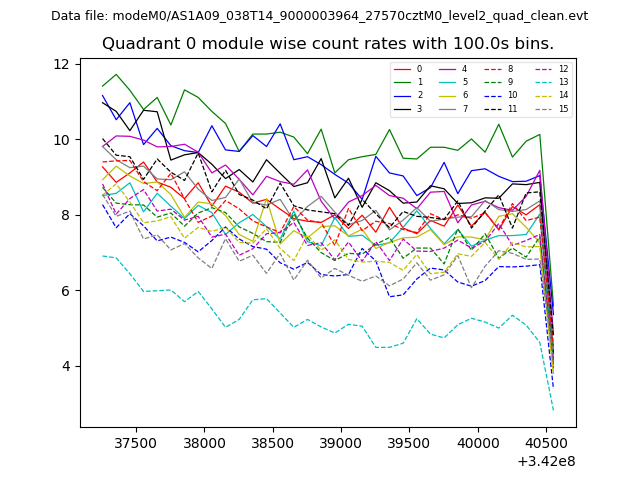 |
 |
| Module-wise count rates for Quadrant B Data is divided into 100 sec bins |
 |
 |
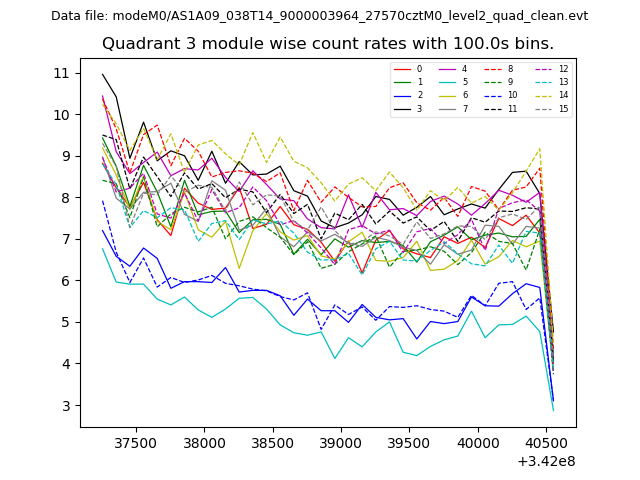
| Module-wise count rates for Quadrant C Data is divided into 100 sec bins |
 |
 |
| Module-wise count rates for Quadrant D Data is divided into 100 sec bins |
 |
 |
| Parameter | Plot |
|---|---|
| CZT HV Monitor |  |
| D_VDD | 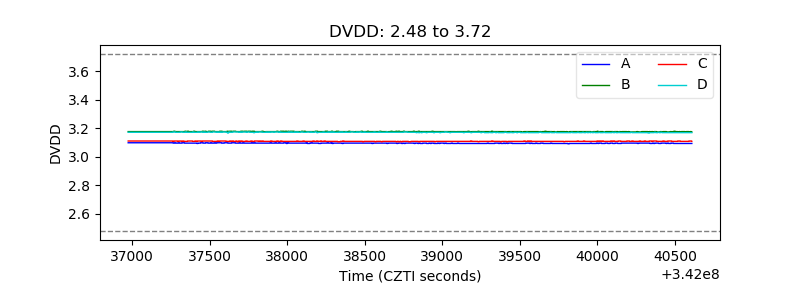 |
| Temperature 1 | 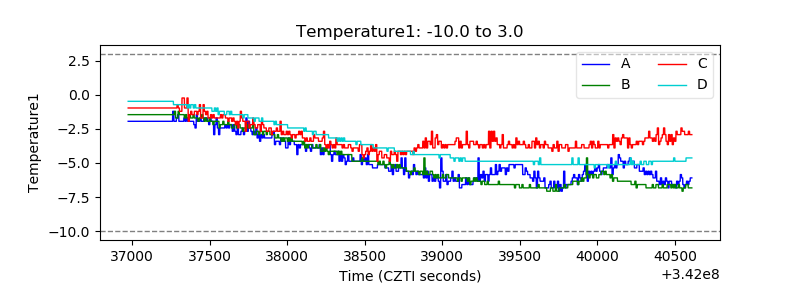 |
| Veto HV Monitor | 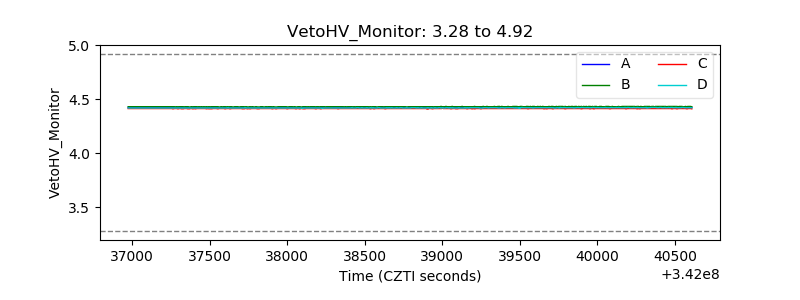 |
| Veto LLD | 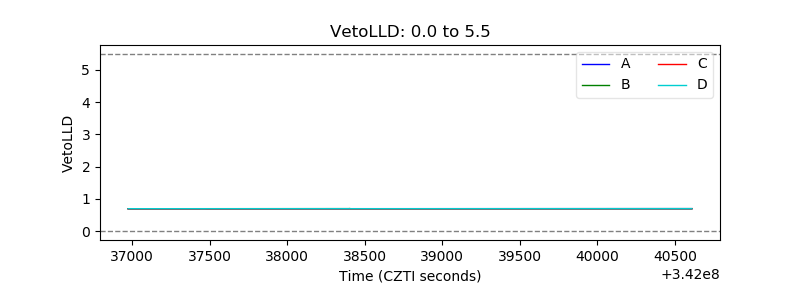 |
| Alpha Counter | 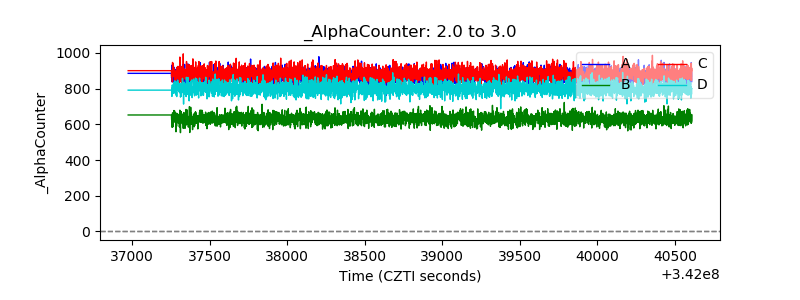 |
| _CPM_Rate | 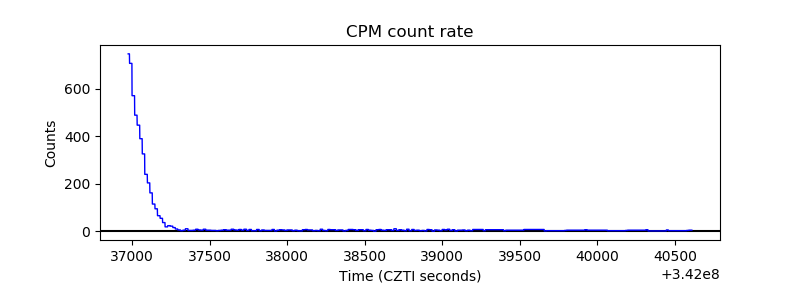 |
| CZT Counter | 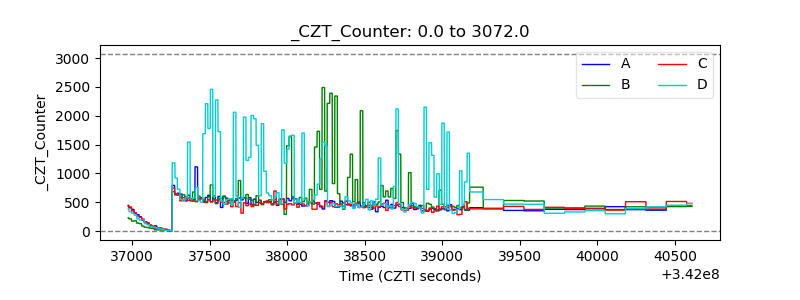 |
| +2.5 Volts monitor |  |
| +5 Volts monitor |  |
| _ROLL_ROT | 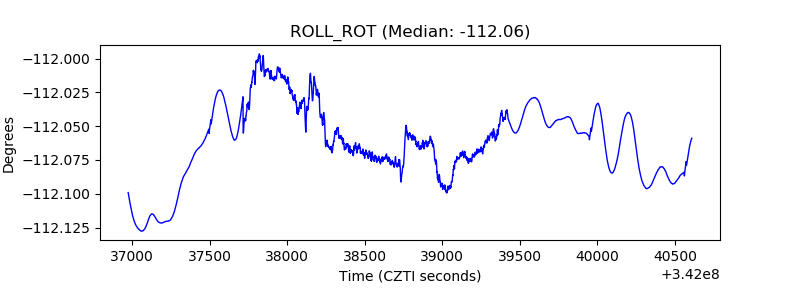 |
| _Roll_DEC | 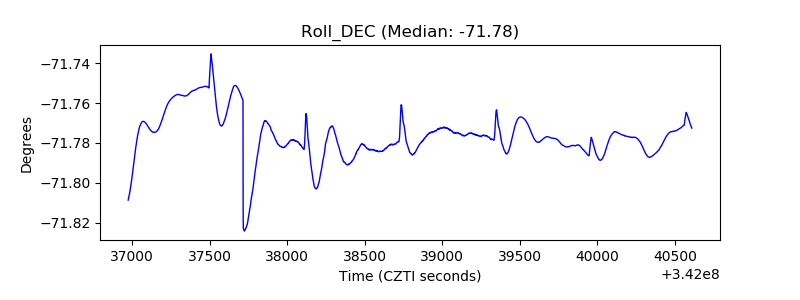 |
| _Roll_RA | 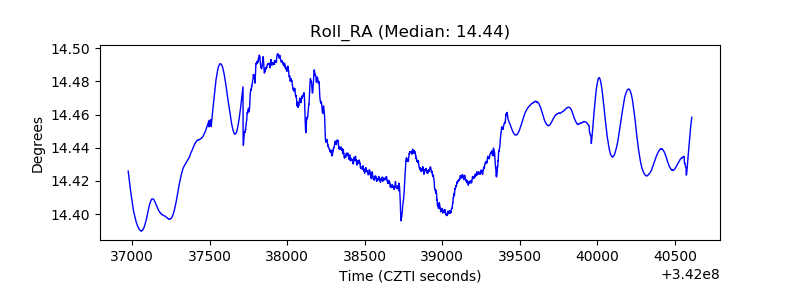 |
| Veto Counter | 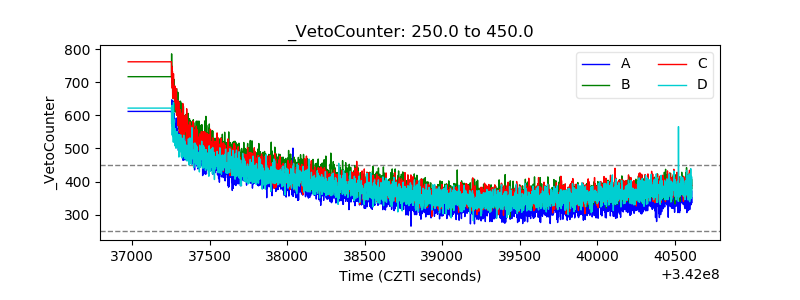 |