| Param | Original file | Final file |
|---|---|---|
| Filename | modeM0/AS1A09_038T24_9000003968cztM0_level2.fits | modeM0/AS1A09_038T24_9000003968cztM0_level2_quad_clean.evt |
| Size (bytes) | 49,368,960 | 34,401,600 |
| Size | 47.1 MB | 32.8 MB |
| Events in quadrant A | 303,658 | 184,722 |
| Events in quadrant B | 294,254 | 186,042 |
| Events in quadrant C | 301,942 | 175,007 |
| Events in quadrant D | 260,860 | 160,290 |
| Mode SS | |||
|---|---|---|---|
| Quadrant | BADHDUFLAG | Total packets | Discarded packets |
| A | 0 | 98 | 0 |
| B | 0 | 98 | 0 |
| C | 0 | 98 | 0 |
| D | 0 | 98 | 0 |
| Mode M0 | |||
|---|---|---|---|
| Quadrant | BADHDUFLAG | Total packets | Discarded packets |
| A | 0 | 9909 | 0 |
| B | 0 | 10339 | 0 |
| C | 0 | 9944 | 0 |
| D | 0 | 11326 | 0 |
| Mode M9 | |||
|---|---|---|---|
| Quadrant | BADHDUFLAG | Total packets | Discarded packets |
| A | 0 | 12 | 0 |
| B | 0 | 12 | 0 |
| C | 0 | 12 | 0 |
| D | 0 | 12 | 0 |
| Quadrant | Total seconds | Saturated seconds | Saturation percentage |
|---|---|---|---|
| A | 4764 | 17 | 0.356843% |
| B | 4764 | 23 | 0.482788% |
| C | 4764 | 44 | 0.923594% |
| D | 4764 | 36 | 0.755668% |
Noise dominated data is calculated using 1-second bins in cleaned event files. If a bin has >2000 counts, and if more than 50% of those come from <1% of pixels, then it is considered to be noise-dominated and hence unusable.
| Quadrant | # 1 sec bins | Bins with >0 counts | Bins with >2000 counts | High rate bins dominated by noise | Noise dominated (total time) | Noise dominated (detector-on time) | Marked lightcurve |
|---|---|---|---|---|---|---|---|
| A | 5964 | 4764 | 0 | 0 | 0.00% | 0.00% |  |
| B | 5964 | 4764 | 0 | 0 | 0.00% | 0.00% |  |
| C | 5963 | 4762 | 0 | 0 | 0.00% | 0.00% | 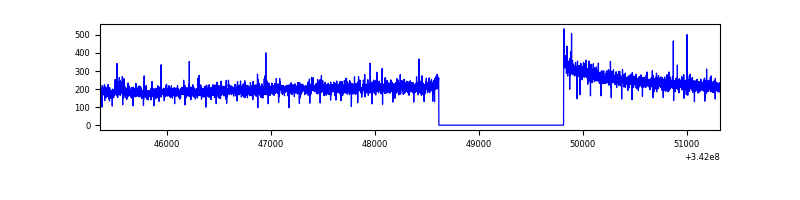 |
| D | 5964 | 4764 | 0 | 0 | 0.00% | 0.00% |  |
Top three noisy pixels from each quadrant. If the there are fewer than three noisy pixels in the level2.evt file, extra rows are filled as -1
| Pixel properties | Quadrant properties | ||||||
|---|---|---|---|---|---|---|---|
| Quadrant | DetID | PixID | Counts | Sigma | Mean | Median | Sigma |
| A | 0 | 29 | 278 | 9.66 | 79 | 75 | 21.0 |
| A | 7 | 110 | 240 | 7.85 | 79 | 75 | 21.0 |
| A | 14 | 79 | 219 | 6.85 | 79 | 75 | 21.0 |
| B | 2 | 9 | 242 | 9.84 | 77 | 75 | 17.0 |
| B | 2 | 245 | 220 | 8.55 | 77 | 75 | 17.0 |
| B | 5 | 128 | 218 | 8.43 | 77 | 75 | 17.0 |
| C | 12 | 241 | 241 | 7.68 | 79 | 75 | 21.6 |
| C | 12 | 242 | 221 | 6.76 | 79 | 75 | 21.6 |
| C | 9 | 209 | 217 | 6.57 | 79 | 75 | 21.6 |
| D | 15 | 46 | 204 | 6.54 | 74 | 67 | 20.9 |
| D | 6 | 67 | 204 | 6.54 | 74 | 67 | 20.9 |
| D | 7 | 3 | 196 | 6.16 | 74 | 67 | 20.9 |
Histogram calculated using DETX and DETY for each event in the final _common_clean file
| Quadrant A |  |
 |
Quadrant B |
|---|---|---|---|
| Quadrant D |  |
 |
Quadrant C |
| Plot type | Count rate plots | Images |
|---|---|---|
| Comparison with Poisson distribution Blue bars denote a histogram of data divided into 1 sec bins. Red curve is a Poisson curve with rate = median count rate of data. |
 |
 |
| Quadrant-wise count rates Data is divided into 100 sec bins |
 |
|
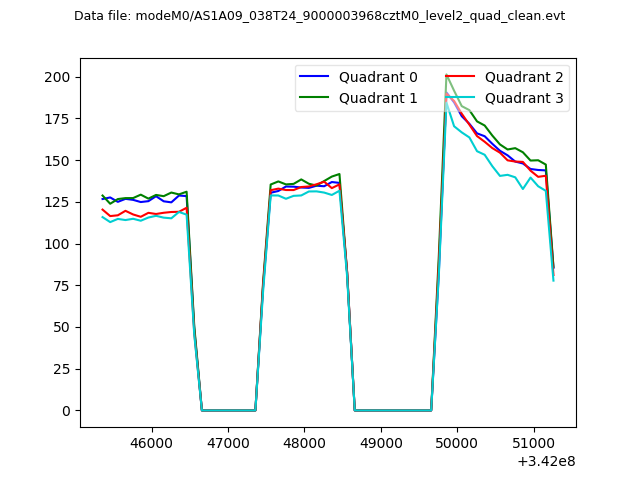
| Module-wise count rates for Quadrant A Data is divided into 100 sec bins |
 |
 |
| Module-wise count rates for Quadrant B Data is divided into 100 sec bins |
 |
 |
| Module-wise count rates for Quadrant C Data is divided into 100 sec bins |
 |
 |
| Module-wise count rates for Quadrant D Data is divided into 100 sec bins |
 |
 |
| Parameter | Plot |
|---|---|
| CZT HV Monitor |  |
| D_VDD | 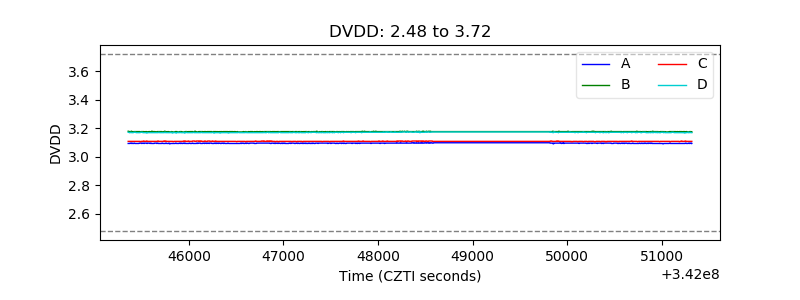 |
| Temperature 1 |  |
| Veto HV Monitor |  |
| Veto LLD |  |
| Alpha Counter |  |
| _CPM_Rate |  |
| CZT Counter |  |
| +2.5 Volts monitor |  |
| +5 Volts monitor |  |
| _ROLL_ROT |  |
| _Roll_DEC |  |
| _Roll_RA |  |
| Veto Counter |  |