| Param | Original file | Final file |
|---|---|---|
| Filename | modeM0/AS1A09_038T24_9000003968_27572cztM0_level2.evt | modeM0/AS1A09_038T24_9000003968_27572cztM0_level2_quad_clean.evt |
| Size (bytes) | 316,422,720 | 76,824,000 |
| Size | 301.8 MB | 73.3 MB |
| Events in quadrant A | 2,168,390 | 508,918 |
| Events in quadrant B | 2,297,781 | 524,026 |
| Events in quadrant C | 2,224,947 | 499,004 |
| Events in quadrant D | 2,585,252 | 478,489 |
| Mode M0 | |||
|---|---|---|---|
| Quadrant | BADHDUFLAG | Total packets | Discarded packets |
| A | 0 | 9369 | 0 |
| B | 0 | 9795 | 0 |
| C | 0 | 9401 | 0 |
| D | 0 | 10736 | 0 |
| Mode M9 | |||
|---|---|---|---|
| Quadrant | BADHDUFLAG | Total packets | Discarded packets |
| A | 0 | 12 | 0 |
| B | 0 | 12 | 0 |
| C | 0 | 12 | 0 |
| D | 0 | 12 | 0 |
| Quadrant | Total seconds | Saturated seconds | Saturation percentage |
|---|---|---|---|
| A | 4494 | 17 | 0.378282% |
| B | 4494 | 23 | 0.511794% |
| C | 4494 | 42 | 0.934579% |
| D | 4493 | 36 | 0.801246% |
Noise dominated data is calculated using 1-second bins in cleaned event files. If a bin has >2000 counts, and if more than 50% of those come from <1% of pixels, then it is considered to be noise-dominated and hence unusable.
| Quadrant | # 1 sec bins | Bins with >0 counts | Bins with >2000 counts | High rate bins dominated by noise | Noise dominated (total time) | Noise dominated (detector-on time) | Marked lightcurve |
|---|---|---|---|---|---|---|---|
| A | 5694 | 4495 | 4 | 4 | 0.07% | 0.09% | 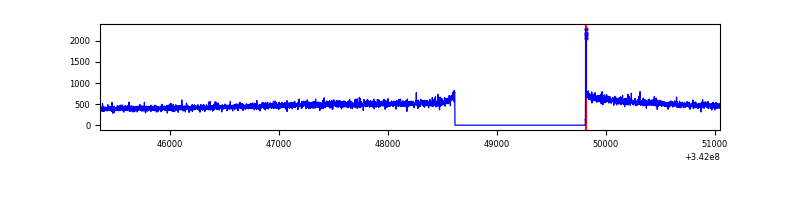 |
| B | 5694 | 4495 | 0 | 0 | 0.00% | 0.00% | 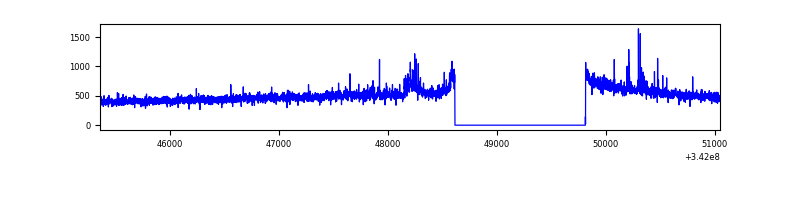 |
| C | 5694 | 4495 | 0 | 0 | 0.00% | 0.00% | 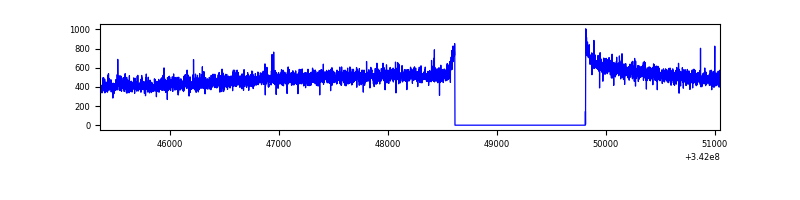 |
| D | 5693 | 4494 | 36 | 36 | 0.63% | 0.80% | 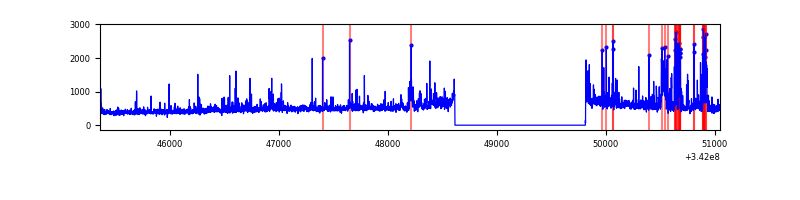 |
Top three noisy pixels from each quadrant. If the there are fewer than three noisy pixels in the level2.evt file, extra rows are filled as -1
| Pixel properties | Quadrant properties | ||||||
|---|---|---|---|---|---|---|---|
| Quadrant | DetID | PixID | Counts | Sigma | Mean | Median | Sigma |
| A | 8 | 192 | 9964 | 84.4 | 558 | 546 | 111.6 |
| A | 13 | 254 | 7096 | 58.7 | 558 | 546 | 111.6 |
| A | 3 | 137 | 5180 | 41.53 | 558 | 546 | 111.6 |
| B | 3 | 64 | 46127 | 426.76 | 563 | 549 | 106.8 |
| B | 0 | 230 | 16002 | 144.69 | 563 | 549 | 106.8 |
| B | 12 | 111 | 12655 | 113.35 | 563 | 549 | 106.8 |
| C | 14 | 238 | 89426 | 701.12 | 546 | 550 | 126.8 |
| C | 13 | 61 | 3635 | 24.34 | 546 | 550 | 126.8 |
| C | 4 | 175 | 3091 | 20.05 | 546 | 550 | 126.8 |
| D | 1 | 52 | 300260 | 2335.85 | 542 | 527 | 128.3 |
| D | 6 | 112 | 130160 | 1010.24 | 542 | 527 | 128.3 |
| D | 2 | 250 | 88653 | 686.78 | 542 | 527 | 128.3 |
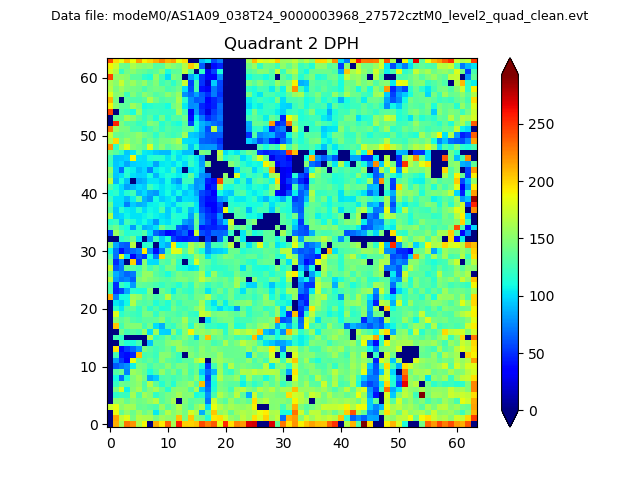
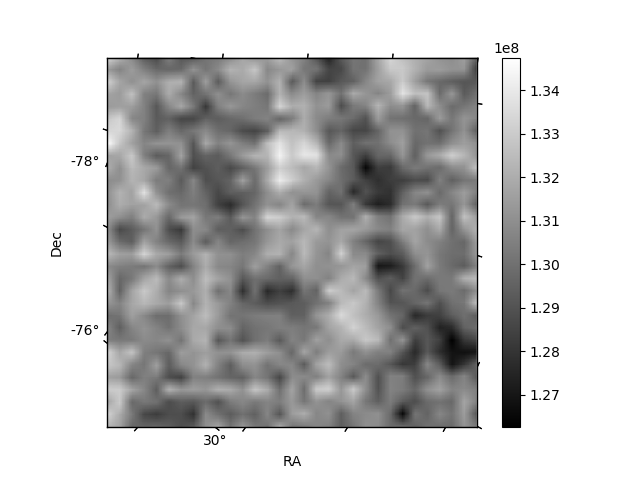
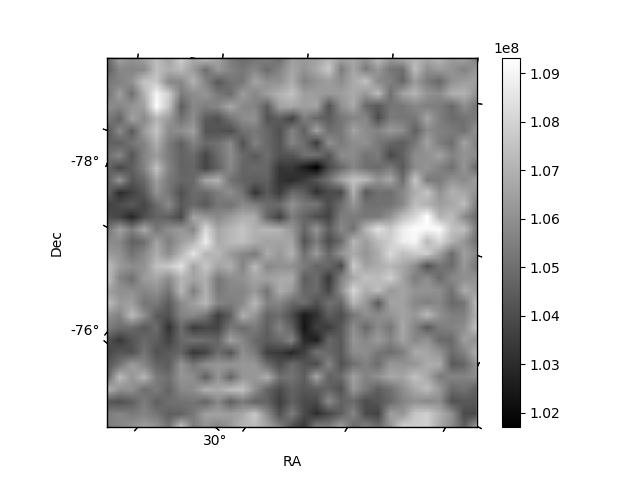
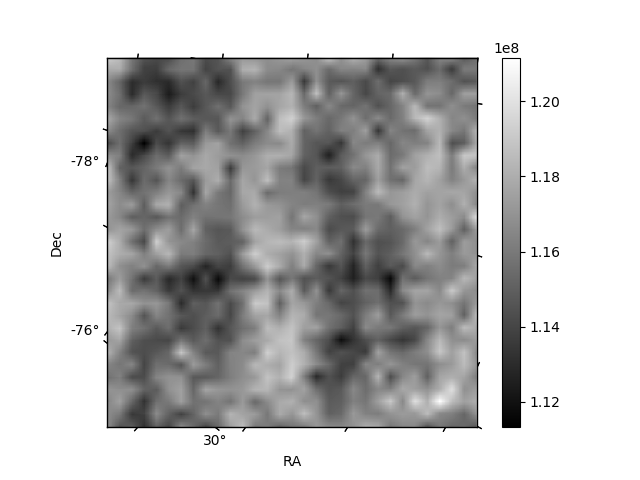
Histogram calculated using DETX and DETY for each event in the final _common_clean file
| Quadrant A | 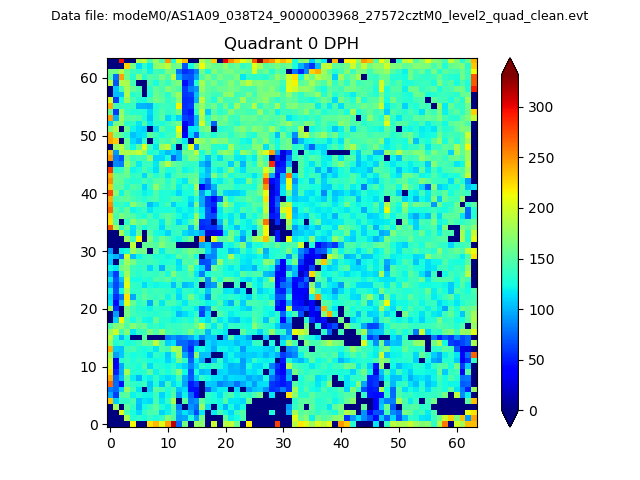 |
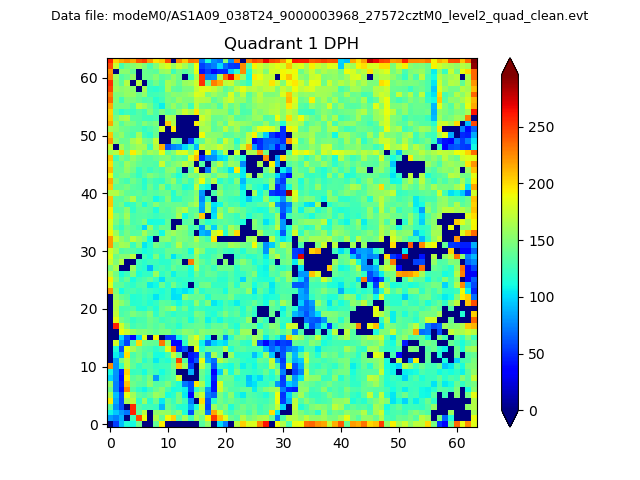 |
Quadrant B |
|---|---|---|---|
| Quadrant D | 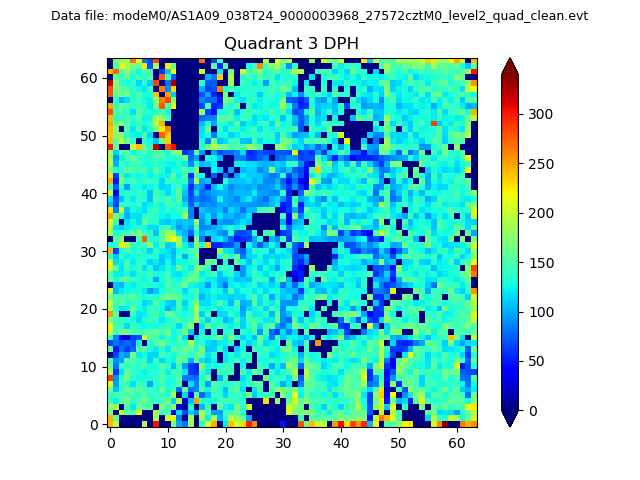 |
 |
Quadrant C |
| Plot type | Count rate plots | Images |
|---|---|---|
| Comparison with Poisson distribution Blue bars denote a histogram of data divided into 1 sec bins. Red curve is a Poisson curve with rate = median count rate of data. |
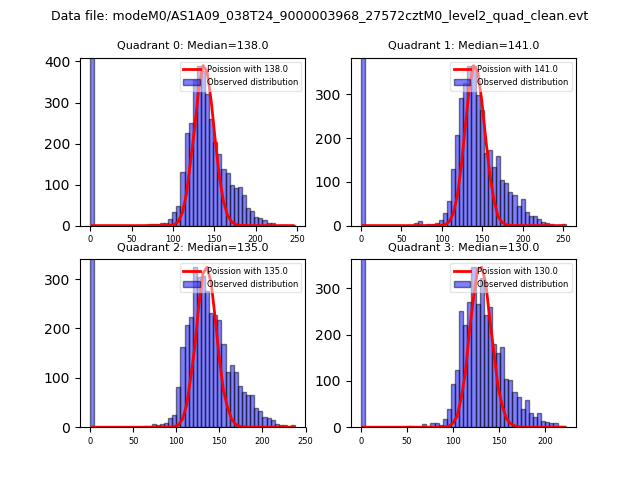 |
 |
| Quadrant-wise count rates Data is divided into 100 sec bins |
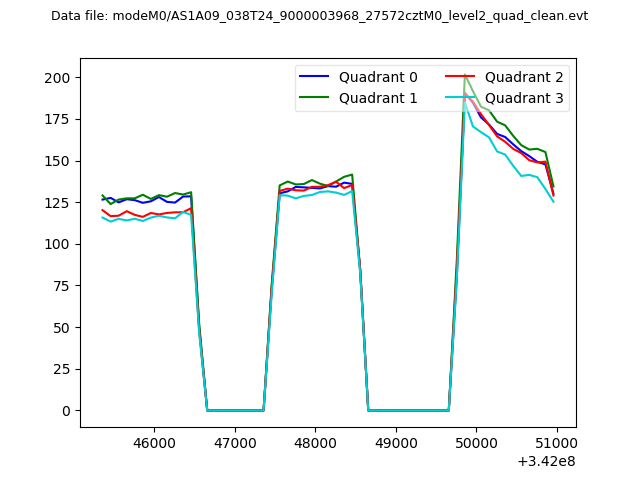 |
|
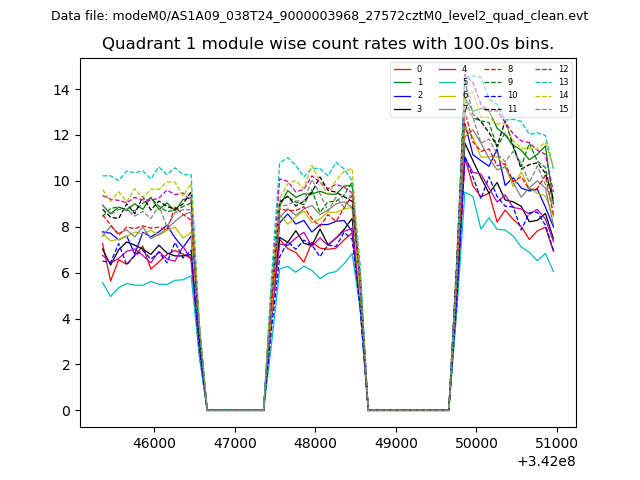
| Module-wise count rates for Quadrant A Data is divided into 100 sec bins |
 |
 |
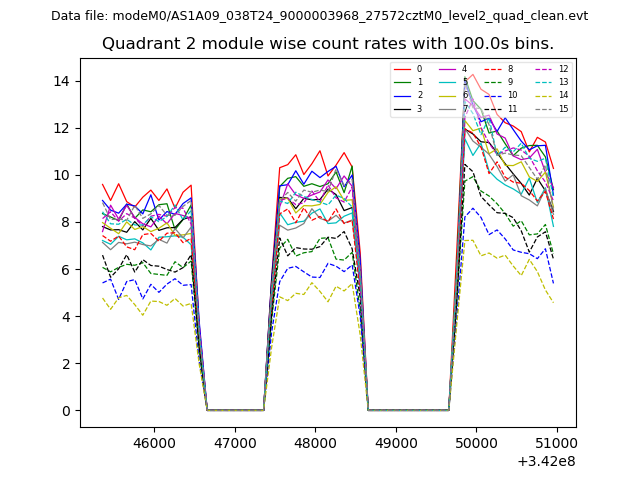
| Module-wise count rates for Quadrant B Data is divided into 100 sec bins |
 |
 |
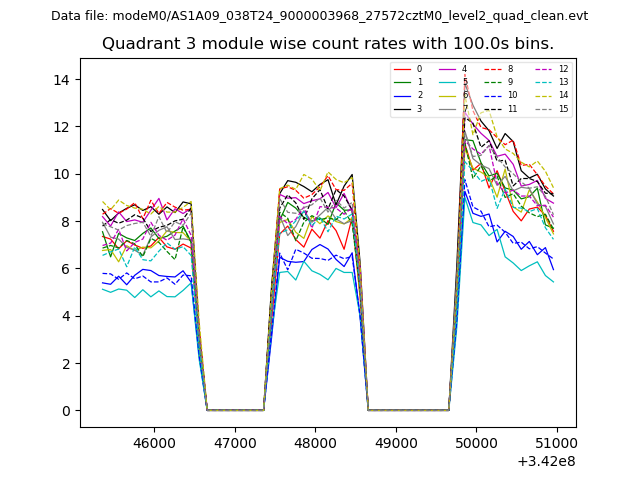
| Module-wise count rates for Quadrant C Data is divided into 100 sec bins |
 |
 |
| Module-wise count rates for Quadrant D Data is divided into 100 sec bins |
 |
 |
| Parameter | Plot |
|---|---|
| CZT HV Monitor | 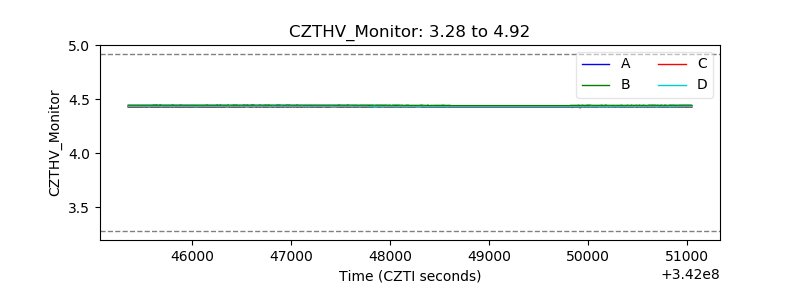 |
| D_VDD | 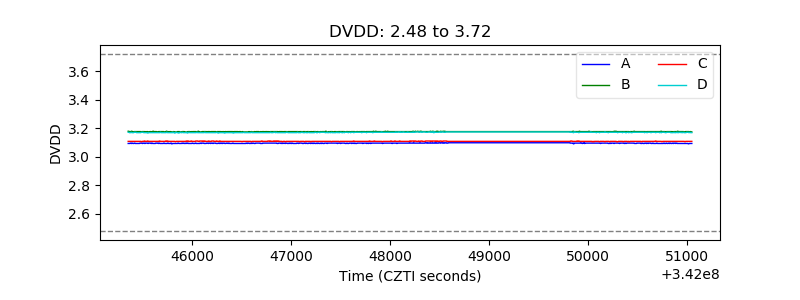 |
| Temperature 1 | 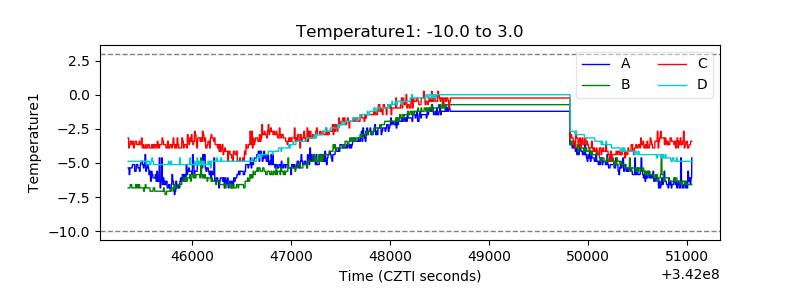 |
| Veto HV Monitor | 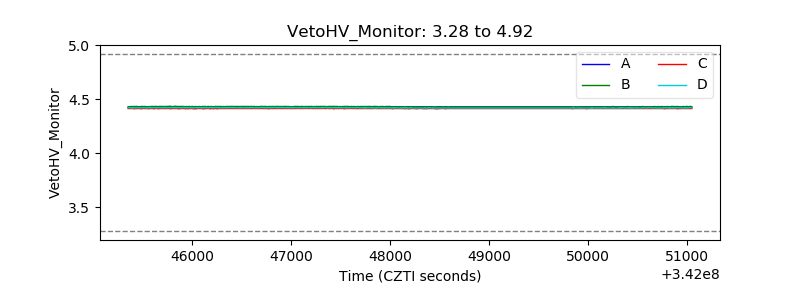 |
| Veto LLD | 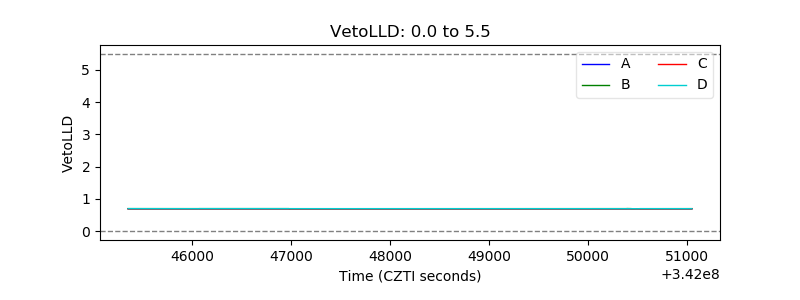 |
| Alpha Counter | 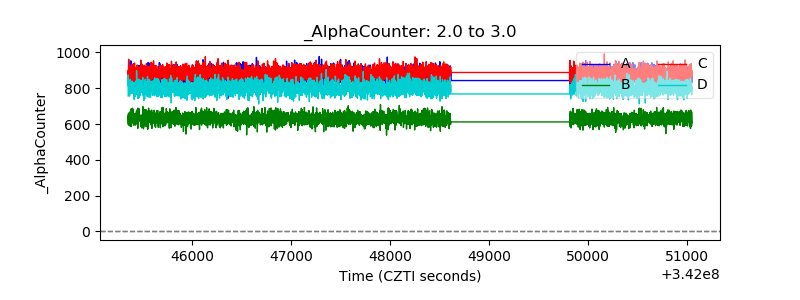 |
| _CPM_Rate | 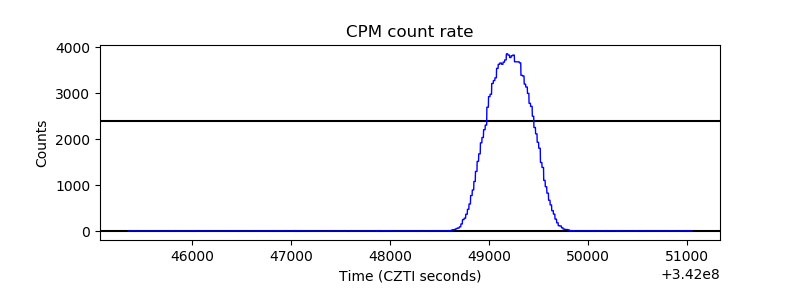 |
| CZT Counter | 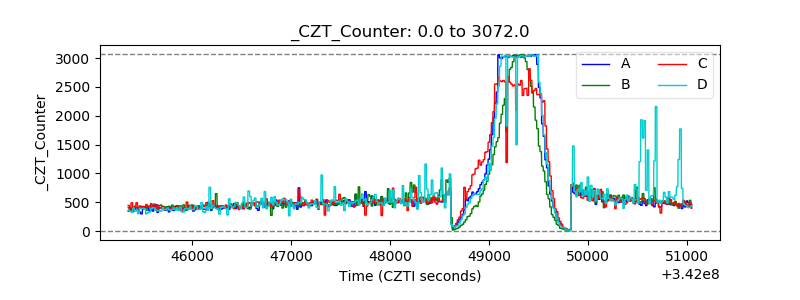 |
| +2.5 Volts monitor |  |
| +5 Volts monitor | 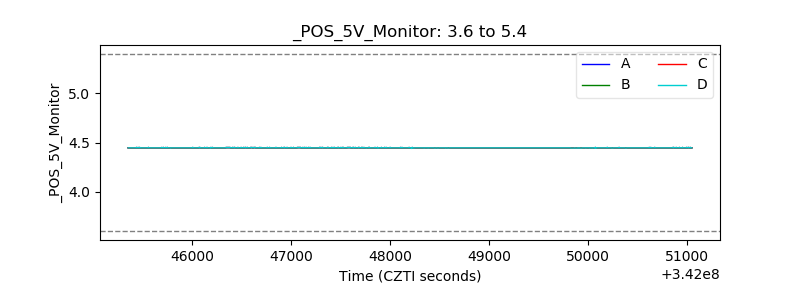 |
| _ROLL_ROT | 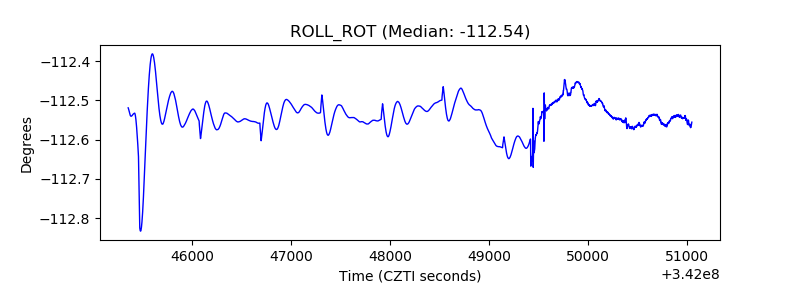 |
| _Roll_DEC | 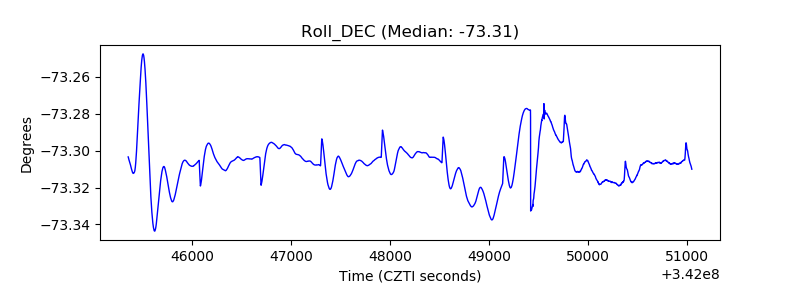 |
| _Roll_RA | 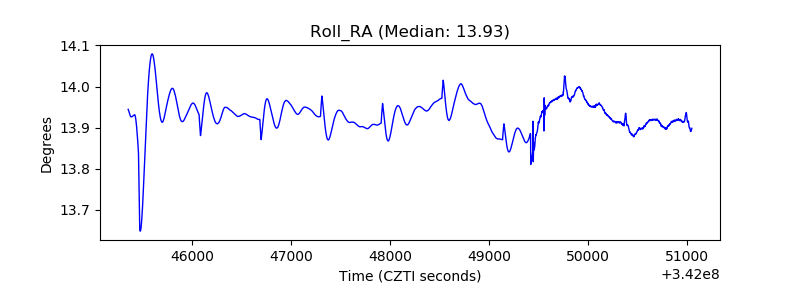 |
| Veto Counter | 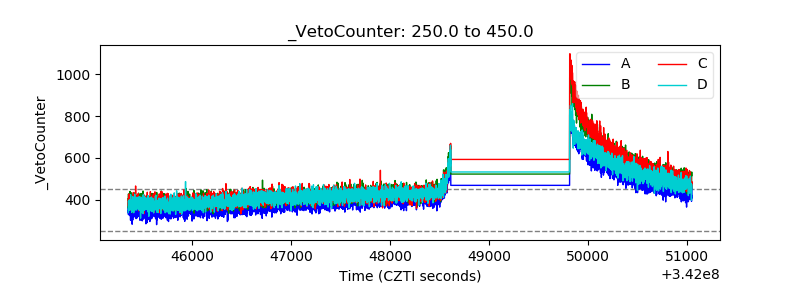 |