| Param | Original file | Final file |
|---|---|---|
| Filename | modeM0/AS1A09_038T24_9000003968_27575cztM0_level2.evt | modeM0/AS1A09_038T24_9000003968_27575cztM0_level2_quad_clean.evt |
| Size (bytes) | 122,667,840 | 35,904,960 |
| Size | 117.0 MB | 34.2 MB |
| Events in quadrant A | 806,714 | 245,323 |
| Events in quadrant B | 874,039 | 254,918 |
| Events in quadrant C | 824,041 | 243,683 |
| Events in quadrant D | 1,103,736 | 230,056 |
| Mode M0 | |||
|---|---|---|---|
| Quadrant | BADHDUFLAG | Total packets | Discarded packets |
| A | 0 | 3370 | 0 |
| B | 0 | 3597 | 0 |
| C | 0 | 3401 | 0 |
| D | 0 | 4313 | 0 |
| Mode M9 | |||
|---|---|---|---|
| Quadrant | BADHDUFLAG | Total packets | Discarded packets |
| A | 0 | 12 | 0 |
| B | 0 | 12 | 0 |
| C | 0 | 12 | 0 |
| D | 0 | 12 | 0 |
| Quadrant | Total seconds | Saturated seconds | Saturation percentage |
|---|---|---|---|
| A | 1528 | 12 | 0.785340% |
| B | 1529 | 16 | 1.046436% |
| C | 1529 | 21 | 1.373447% |
| D | 1529 | 28 | 1.831262% |
Noise dominated data is calculated using 1-second bins in cleaned event files. If a bin has >2000 counts, and if more than 50% of those come from <1% of pixels, then it is considered to be noise-dominated and hence unusable.
| Quadrant | # 1 sec bins | Bins with >0 counts | Bins with >2000 counts | High rate bins dominated by noise | Noise dominated (total time) | Noise dominated (detector-on time) | Marked lightcurve |
|---|---|---|---|---|---|---|---|
| A | 2728 | 1529 | 4 | 4 | 0.15% | 0.26% | 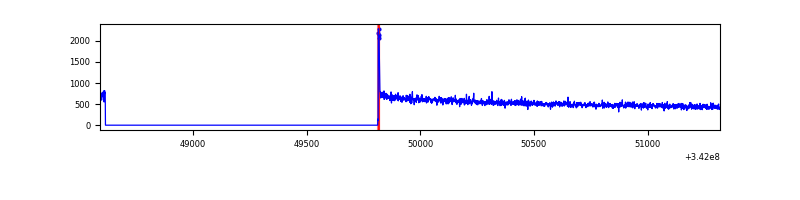 |
| B | 2729 | 1530 | 0 | 0 | 0.00% | 0.00% | 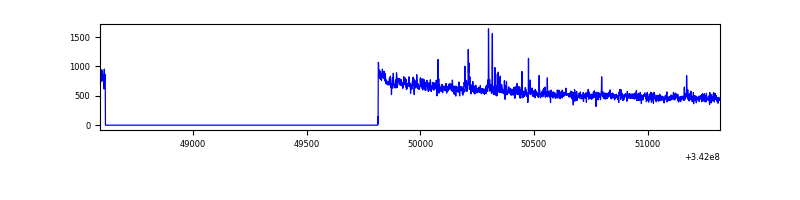 |
| C | 2729 | 1530 | 0 | 0 | 0.00% | 0.00% | 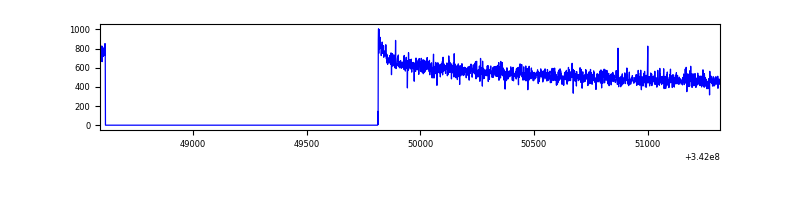 |
| D | 2729 | 1530 | 34 | 34 | 1.25% | 2.22% | 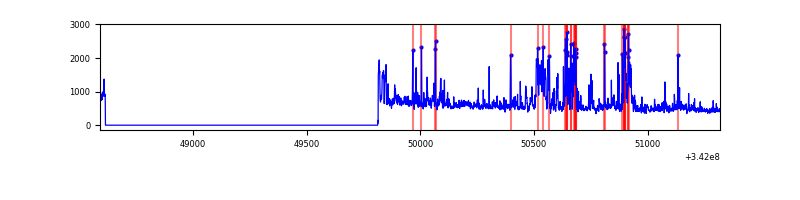 |
Top three noisy pixels from each quadrant. If the there are fewer than three noisy pixels in the level2.evt file, extra rows are filled as -1
| Pixel properties | Quadrant properties | ||||||
|---|---|---|---|---|---|---|---|
| Quadrant | DetID | PixID | Counts | Sigma | Mean | Median | Sigma |
| A | 8 | 192 | 9449 | 215.27 | 206 | 202 | 43.0 |
| A | 13 | 254 | 2671 | 57.48 | 206 | 202 | 43.0 |
| A | 3 | 137 | 1840 | 38.13 | 206 | 202 | 43.0 |
| B | 3 | 64 | 12806 | 303.28 | 212 | 208 | 41.5 |
| B | 0 | 230 | 11317 | 267.43 | 212 | 208 | 41.5 |
| B | 0 | 244 | 10254 | 241.84 | 212 | 208 | 41.5 |
| C | 14 | 238 | 33832 | 693.38 | 202 | 203 | 48.5 |
| C | 13 | 61 | 1362 | 23.9 | 202 | 203 | 48.5 |
| C | 1 | 16 | 1159 | 19.71 | 202 | 203 | 48.5 |
| D | 1 | 52 | 144623 | 3011.0 | 196 | 191 | 48.0 |
| D | 6 | 112 | 134572 | 2801.46 | 196 | 191 | 48.0 |
| D | 2 | 250 | 70286 | 1461.28 | 196 | 191 | 48.0 |
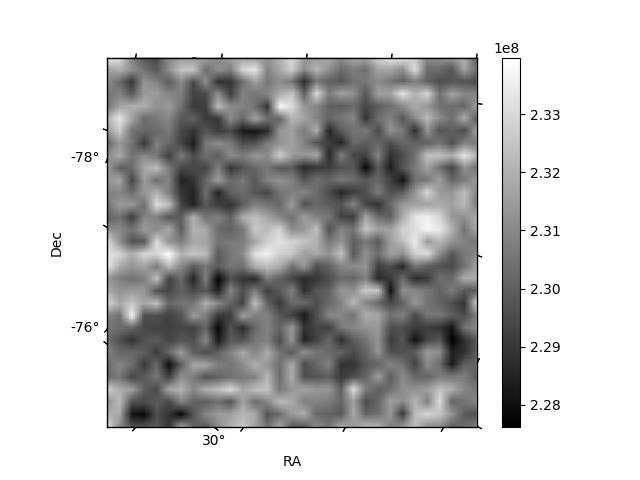
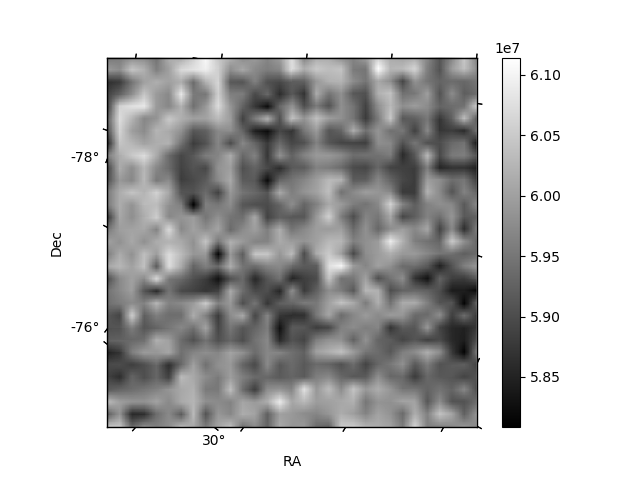
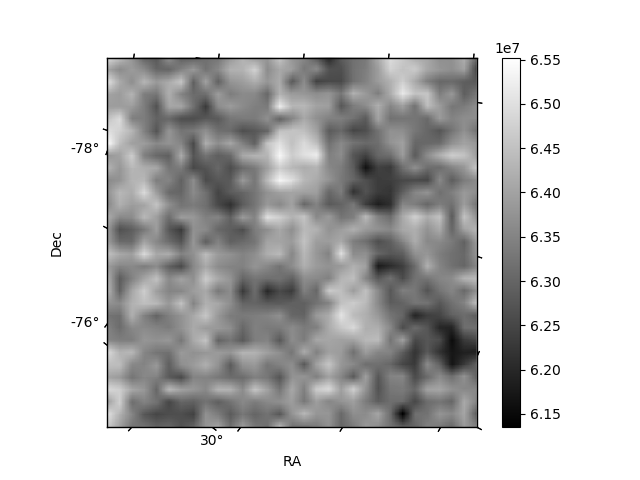
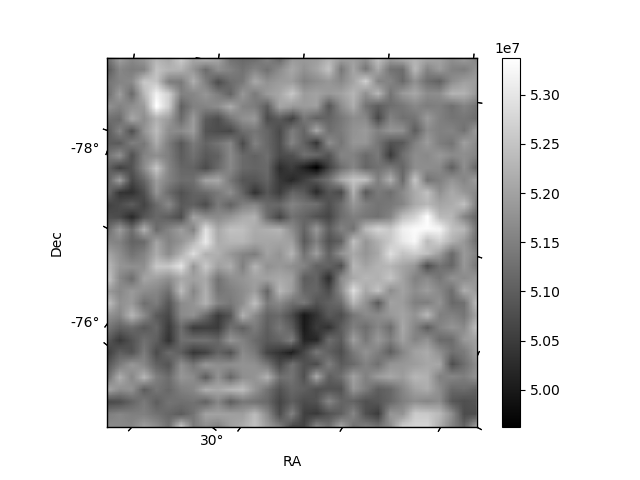
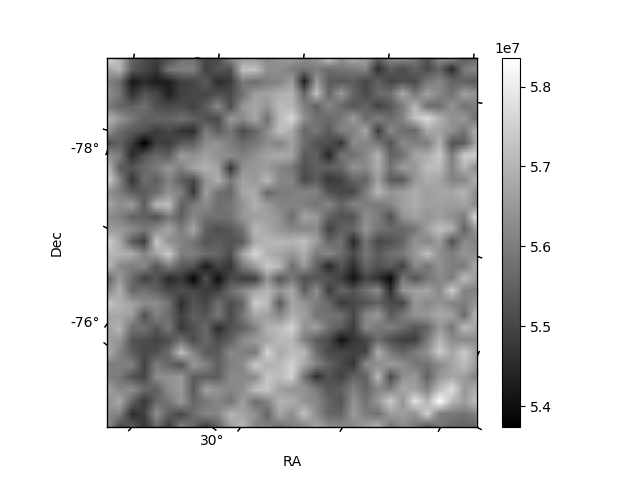
Histogram calculated using DETX and DETY for each event in the final _common_clean file
| Quadrant A | 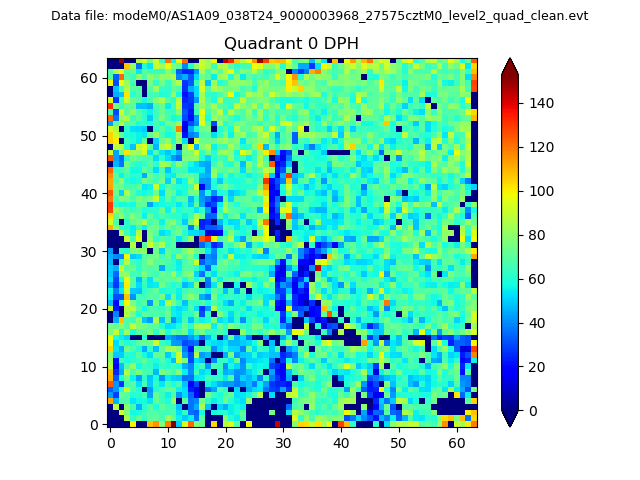 |
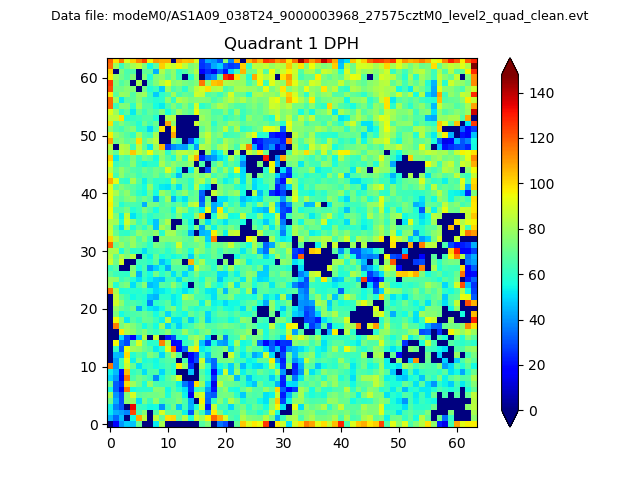 |
Quadrant B |
|---|---|---|---|
| Quadrant D | 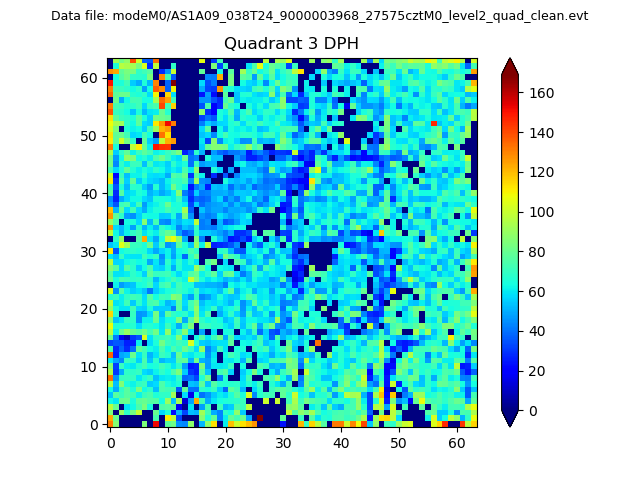 |
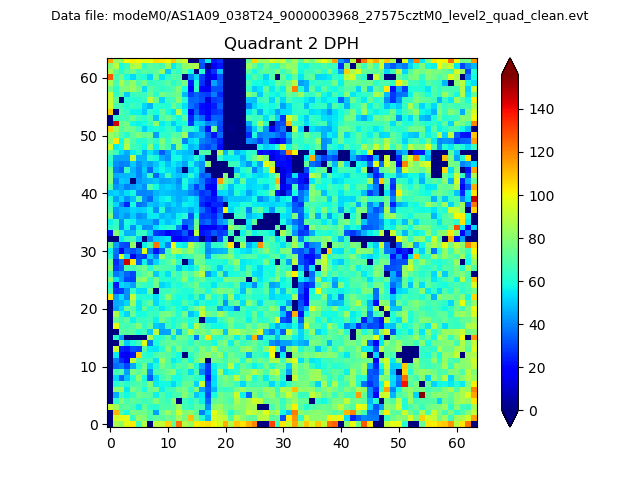 |
Quadrant C |
| Plot type | Count rate plots | Images |
|---|---|---|
| Comparison with Poisson distribution Blue bars denote a histogram of data divided into 1 sec bins. Red curve is a Poisson curve with rate = median count rate of data. |
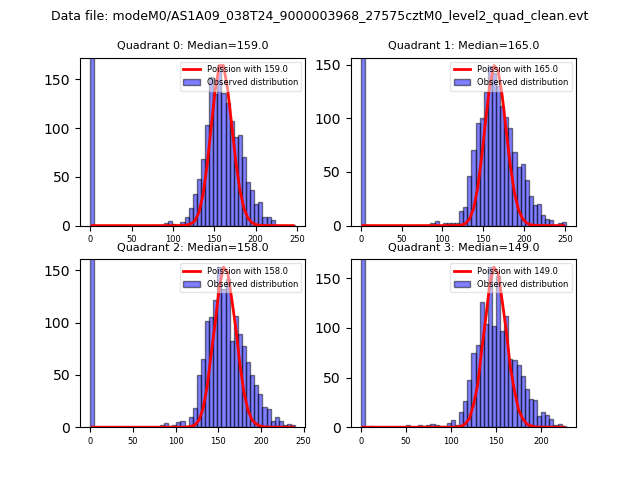 |
 |
| Quadrant-wise count rates Data is divided into 100 sec bins |
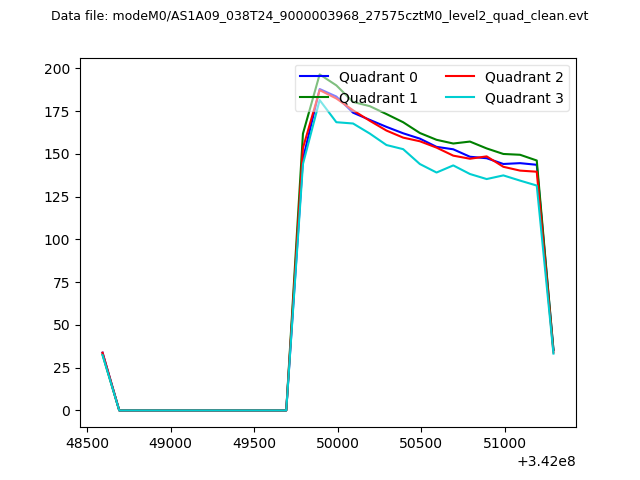 |
|
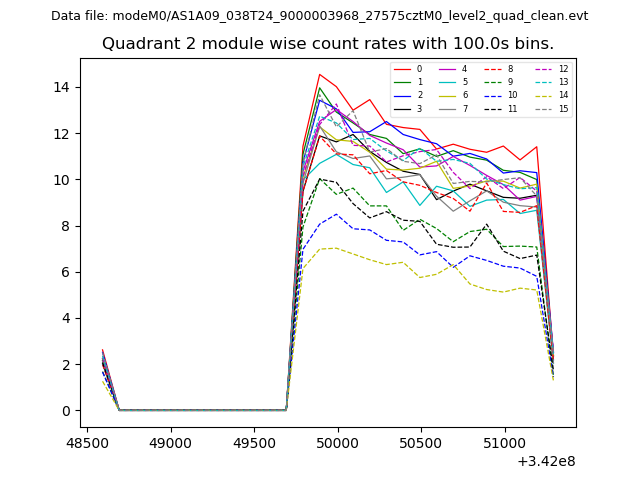
| Module-wise count rates for Quadrant A Data is divided into 100 sec bins |
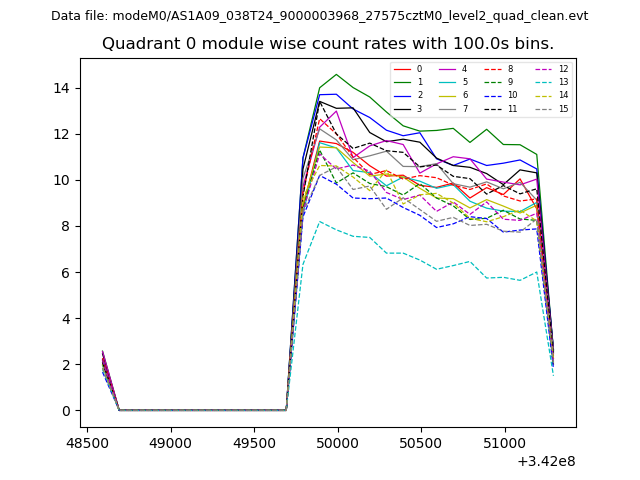 |
 |
| Module-wise count rates for Quadrant B Data is divided into 100 sec bins |
 |
 |
| Module-wise count rates for Quadrant C Data is divided into 100 sec bins |
 |
 |
| Module-wise count rates for Quadrant D Data is divided into 100 sec bins |
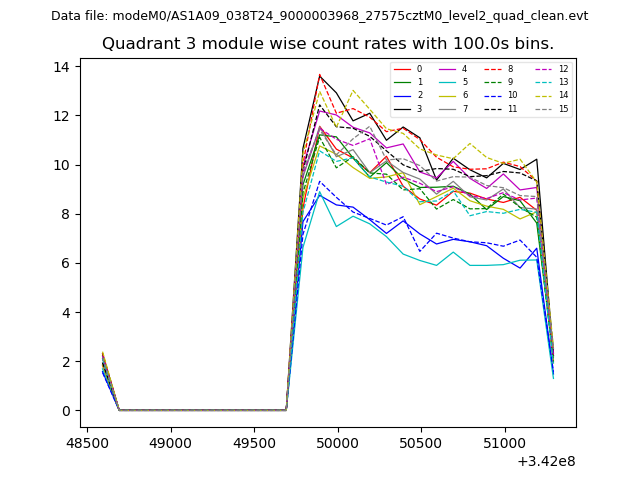 |
 |
| Parameter | Plot |
|---|---|
| CZT HV Monitor |  |
| D_VDD | 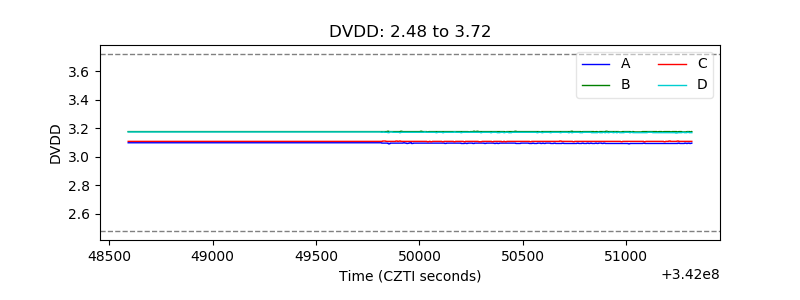 |
| Temperature 1 | 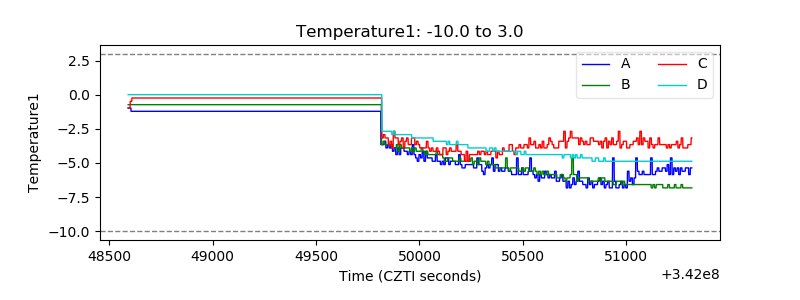 |
| Veto HV Monitor |  |
| Veto LLD | 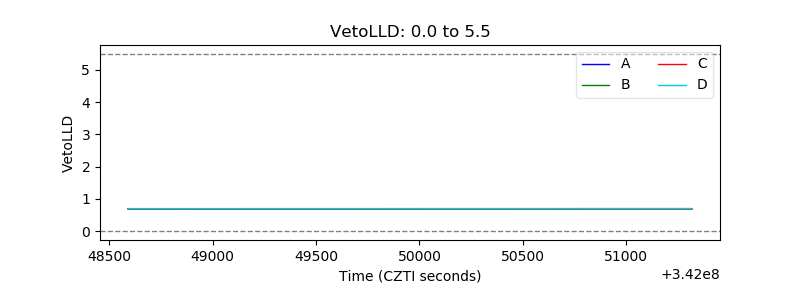 |
| Alpha Counter | 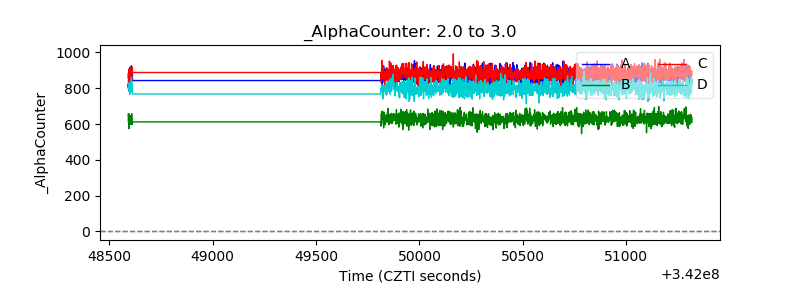 |
| _CPM_Rate | 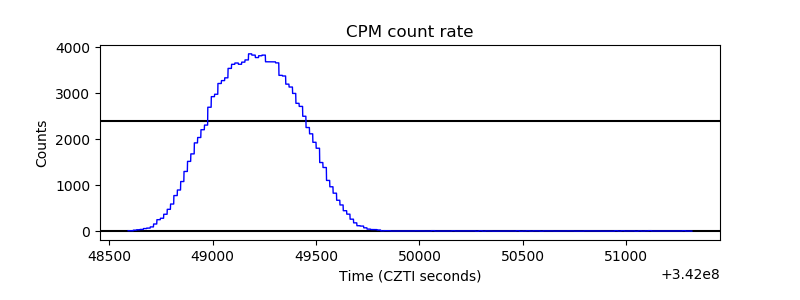 |
| CZT Counter | 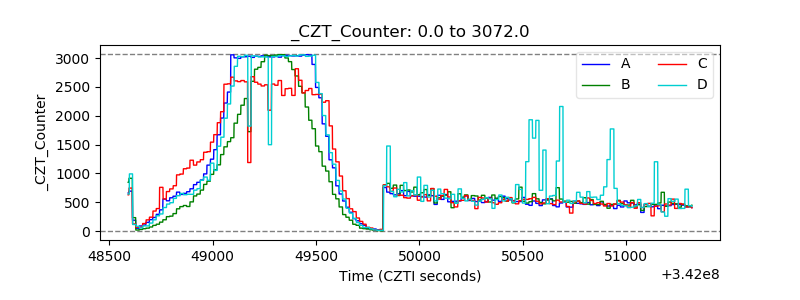 |
| +2.5 Volts monitor | 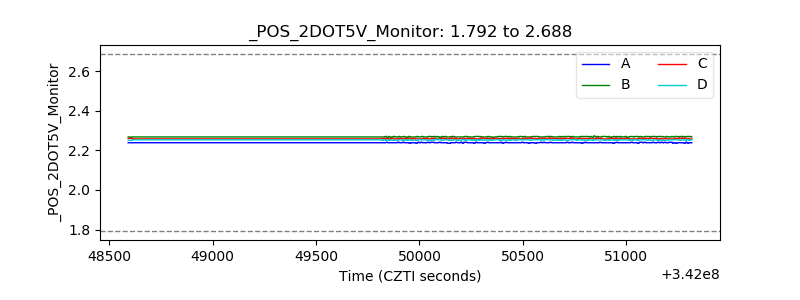 |
| +5 Volts monitor |  |
| _ROLL_ROT |  |
| _Roll_DEC | 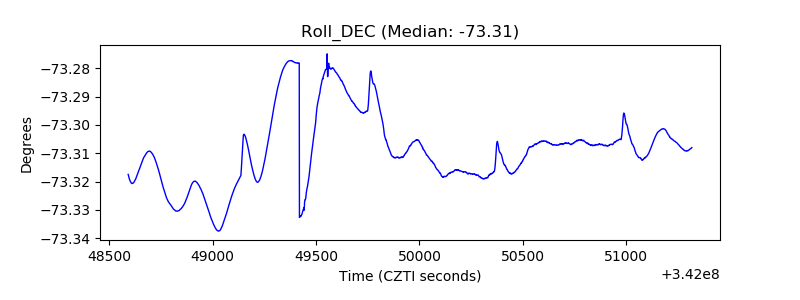 |
| _Roll_RA | 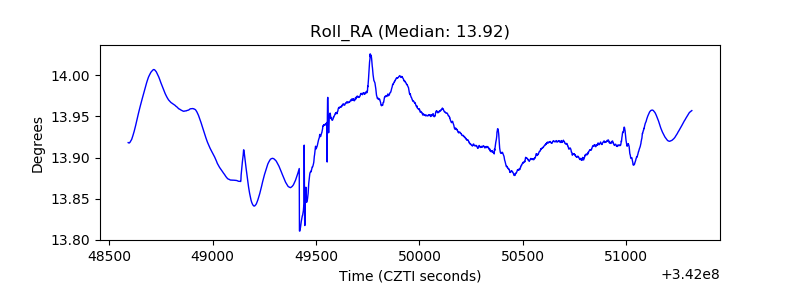 |
| Veto Counter |  |