| Param | Original file | Final file |
|---|---|---|
| Filename | modeM0/AS1A09_038T30_9000003958_27568cztM0_level2.evt | modeM0/AS1A09_038T30_9000003958_27568cztM0_level2_quad_clean.evt |
| Size (bytes) | 337,311,360 | 79,358,400 |
| Size | 321.7 MB | 75.7 MB |
| Events in quadrant A | 2,104,169 | 530,935 |
| Events in quadrant B | 2,202,271 | 535,946 |
| Events in quadrant C | 2,234,094 | 509,967 |
| Events in quadrant D | 3,349,473 | 491,060 |
| Mode M0 | |||
|---|---|---|---|
| Quadrant | BADHDUFLAG | Total packets | Discarded packets |
| A | 0 | 9587 | 0 |
| B | 0 | 9740 | 0 |
| C | 0 | 9843 | 0 |
| D | 0 | 13042 | 0 |
| Quadrant | Total seconds | Saturated seconds | Saturation percentage |
|---|---|---|---|
| A | 4772 | 5 | 0.104778% |
| B | 4772 | 5 | 0.104778% |
| C | 4772 | 31 | 0.649623% |
| D | 4772 | 233 | 4.882649% |
Noise dominated data is calculated using 1-second bins in cleaned event files. If a bin has >2000 counts, and if more than 50% of those come from <1% of pixels, then it is considered to be noise-dominated and hence unusable.
| Quadrant | # 1 sec bins | Bins with >0 counts | Bins with >2000 counts | High rate bins dominated by noise | Noise dominated (total time) | Noise dominated (detector-on time) | Marked lightcurve |
|---|---|---|---|---|---|---|---|
| A | 4772 | 4772 | 0 | 0 | 0.00% | 0.00% | 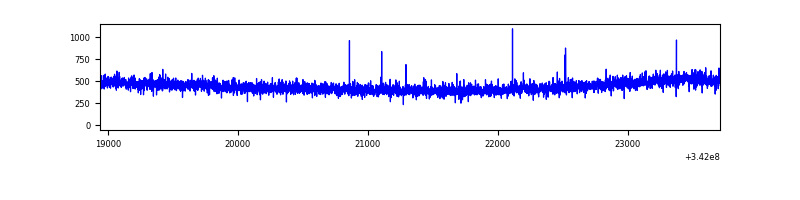 |
| B | 4772 | 4772 | 0 | 0 | 0.00% | 0.00% | 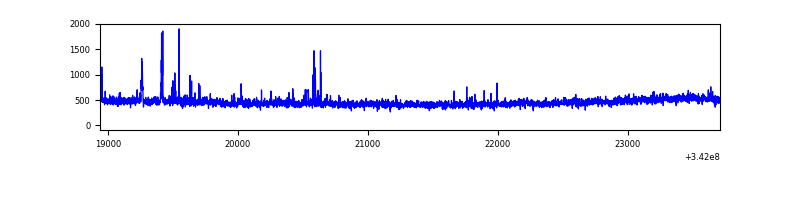 |
| C | 4772 | 4772 | 4 | 4 | 0.08% | 0.08% | 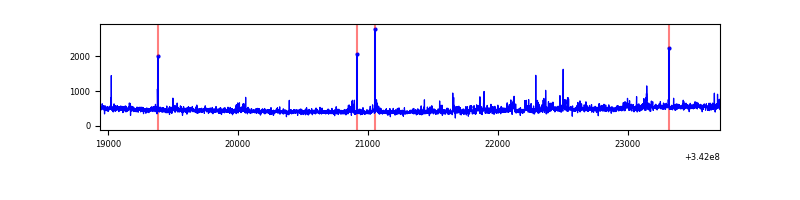 |
| D | 4772 | 4772 | 277 | 277 | 5.80% | 5.80% | 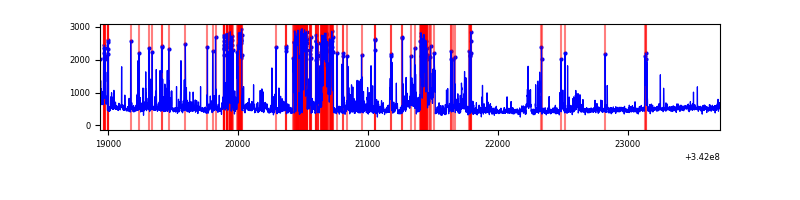 |
Top three noisy pixels from each quadrant. If the there are fewer than three noisy pixels in the level2.evt file, extra rows are filled as -1
| Pixel properties | Quadrant properties | ||||||
|---|---|---|---|---|---|---|---|
| Quadrant | DetID | PixID | Counts | Sigma | Mean | Median | Sigma |
| A | 13 | 254 | 8340 | 70.17 | 544 | 532 | 111.3 |
| A | 3 | 137 | 5381 | 43.58 | 544 | 532 | 111.3 |
| A | 0 | 226 | 4509 | 35.74 | 544 | 532 | 111.3 |
| B | 15 | 32 | 33149 | 312.99 | 544 | 531 | 104.2 |
| B | 10 | 245 | 23345 | 218.91 | 544 | 531 | 104.2 |
| B | 12 | 111 | 12940 | 119.07 | 544 | 531 | 104.2 |
| C | 15 | 208 | 96382 | 775.66 | 521 | 523 | 123.6 |
| C | 14 | 238 | 83417 | 670.75 | 521 | 523 | 123.6 |
| C | 10 | 22 | 11669 | 90.19 | 521 | 523 | 123.6 |
| D | 1 | 52 | 1214050 | 9750.53 | 516 | 500 | 124.5 |
| D | 7 | 80 | 112779 | 902.13 | 516 | 500 | 124.5 |
| D | 2 | 250 | 40733 | 323.26 | 516 | 500 | 124.5 |
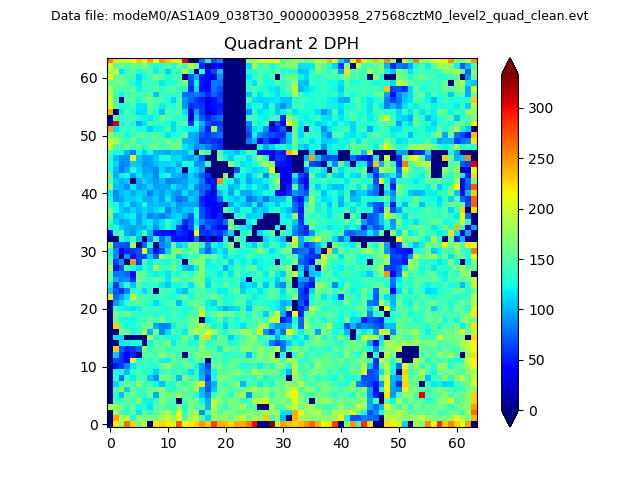
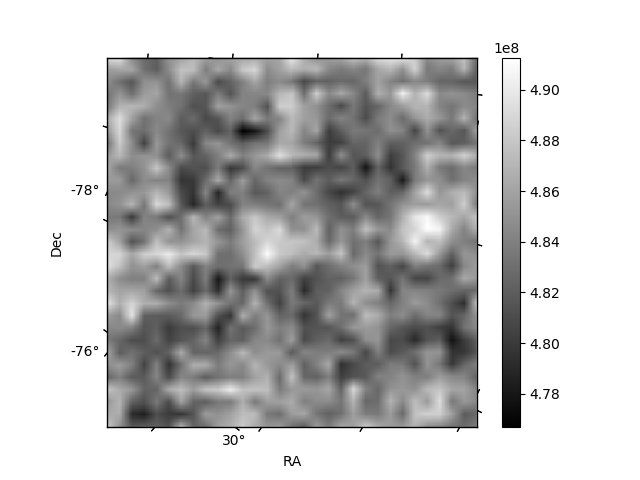
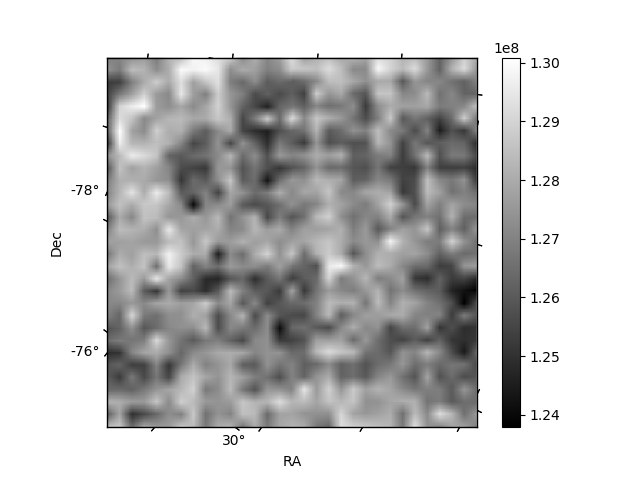
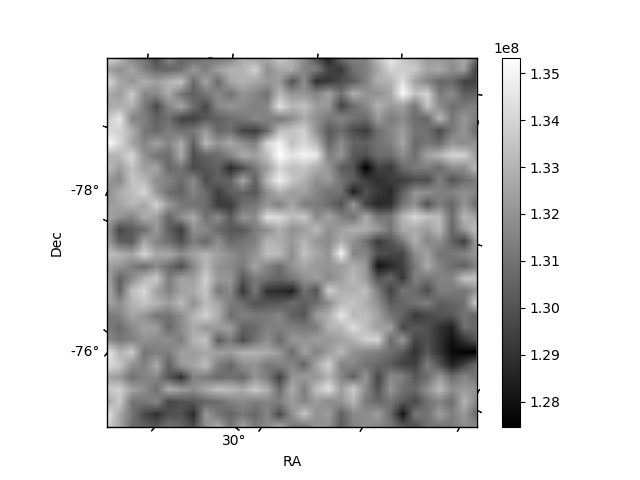
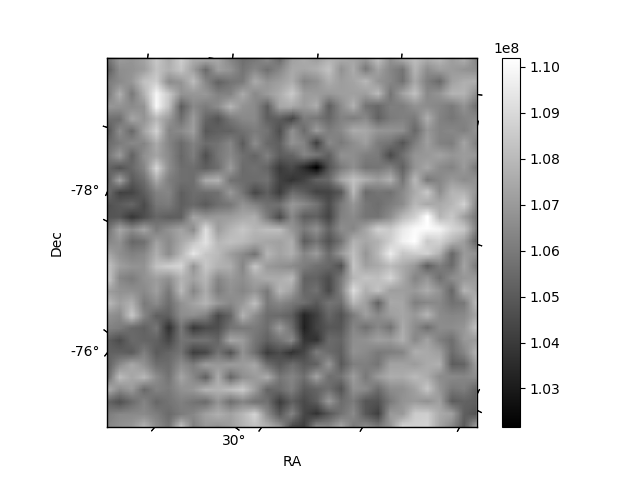
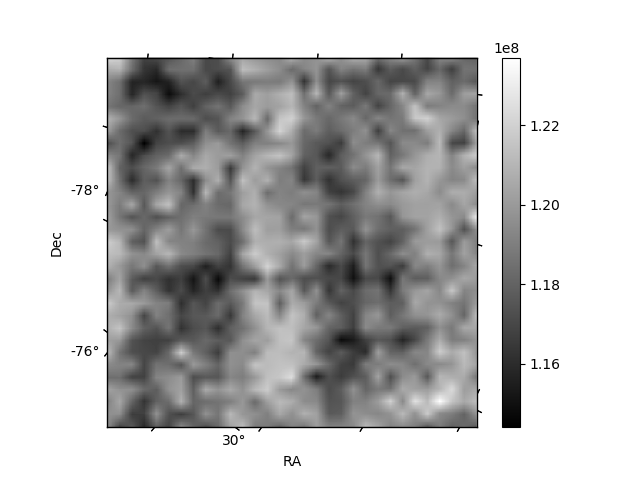
Histogram calculated using DETX and DETY for each event in the final _common_clean file
| Quadrant A | 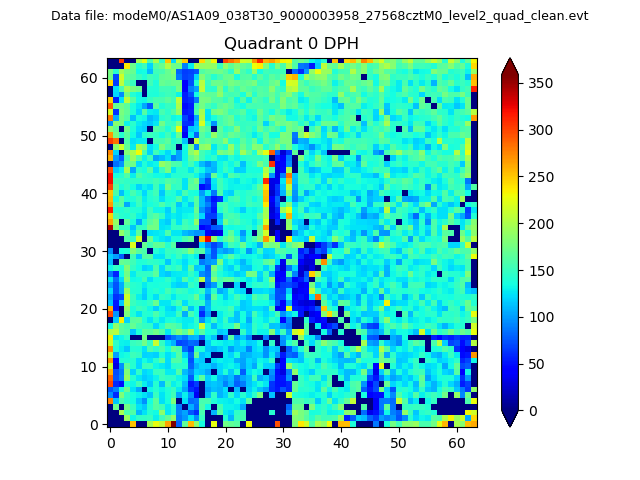 |
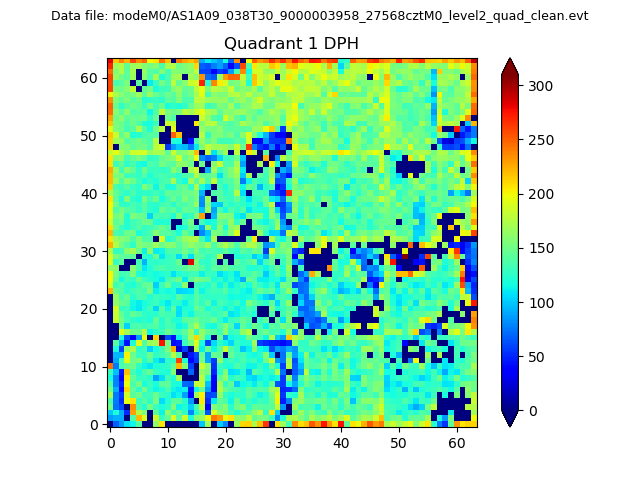 |
Quadrant B |
|---|---|---|---|
| Quadrant D | 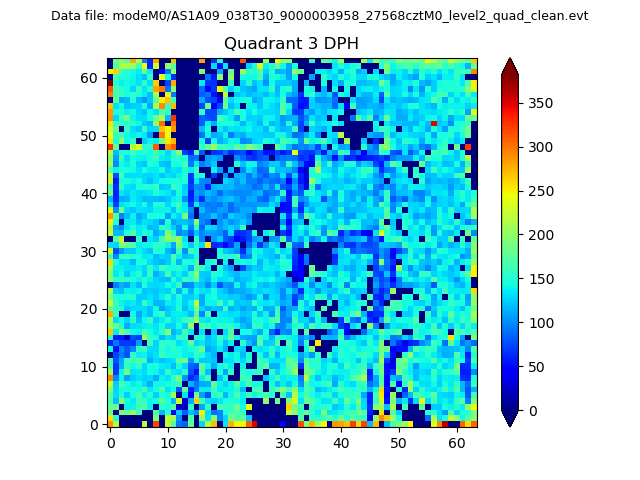 |
 |
Quadrant C |
| Plot type | Count rate plots | Images |
|---|---|---|
| Comparison with Poisson distribution Blue bars denote a histogram of data divided into 1 sec bins. Red curve is a Poisson curve with rate = median count rate of data. |
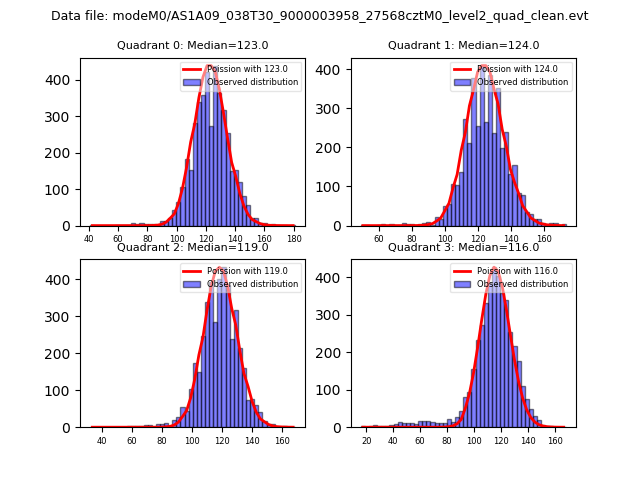 |
 |
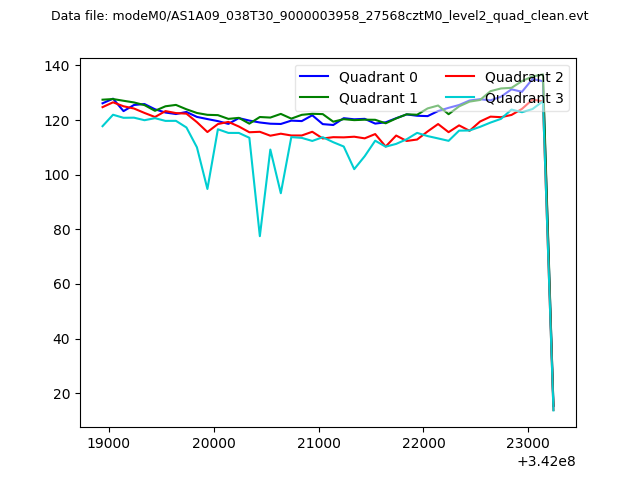
| Quadrant-wise count rates Data is divided into 100 sec bins |
 |
|
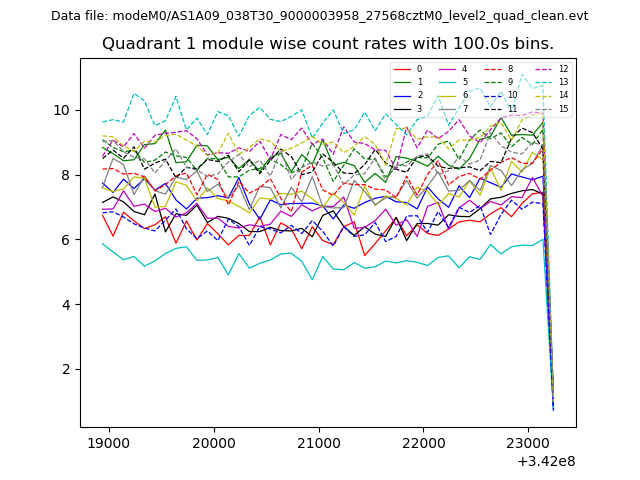
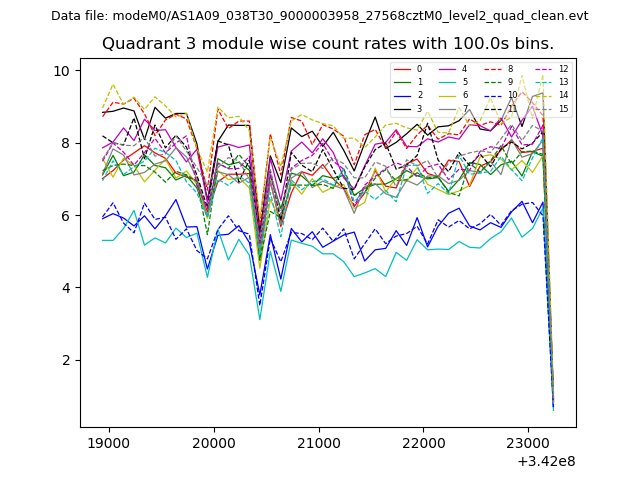
| Module-wise count rates for Quadrant A Data is divided into 100 sec bins |
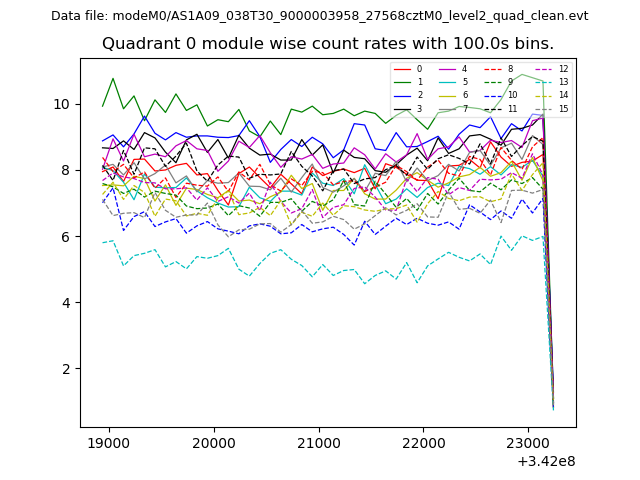 |
 |
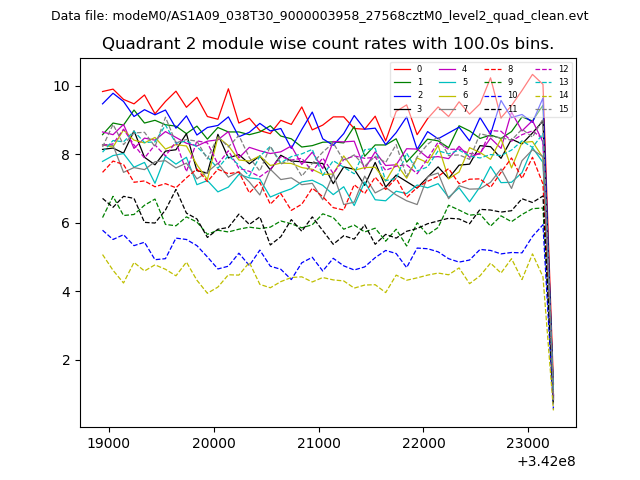
| Module-wise count rates for Quadrant B Data is divided into 100 sec bins |
 |
 |
| Module-wise count rates for Quadrant C Data is divided into 100 sec bins |
 |
 |
| Module-wise count rates for Quadrant D Data is divided into 100 sec bins |
 |
 |
| Parameter | Plot |
|---|---|
| CZT HV Monitor | 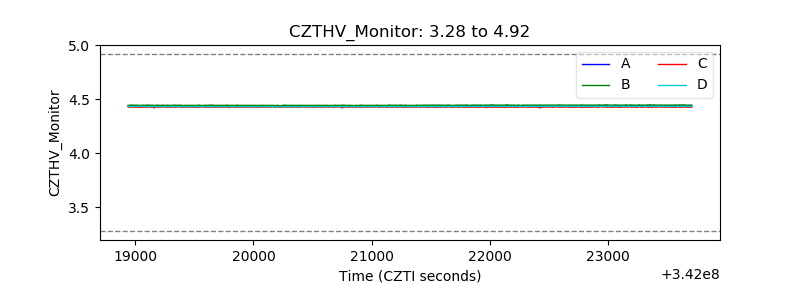 |
| D_VDD | 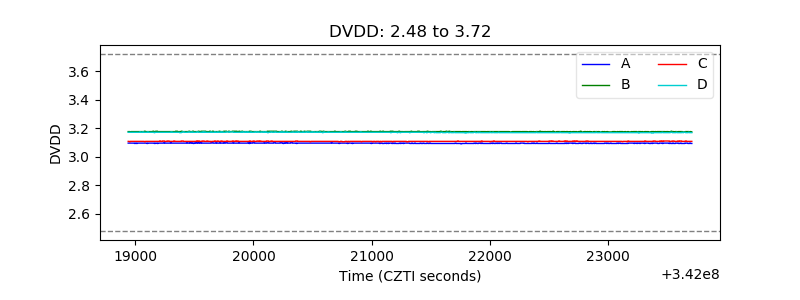 |
| Temperature 1 | 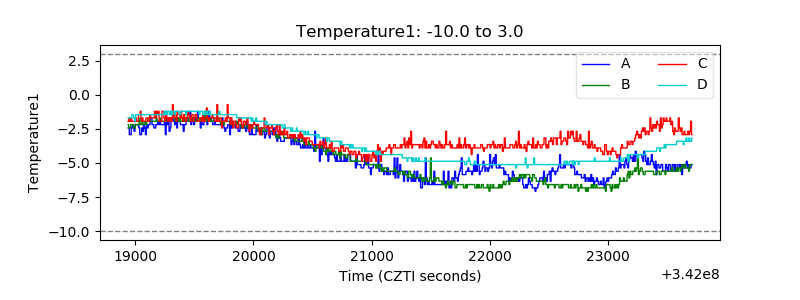 |
| Veto HV Monitor | 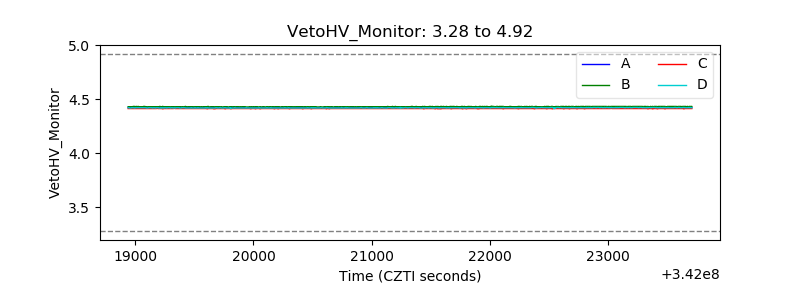 |
| Veto LLD | 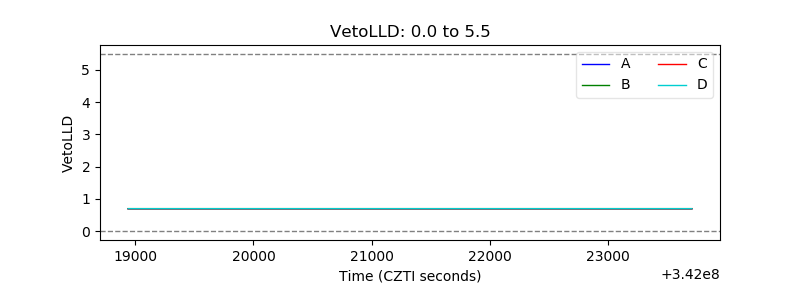 |
| Alpha Counter | 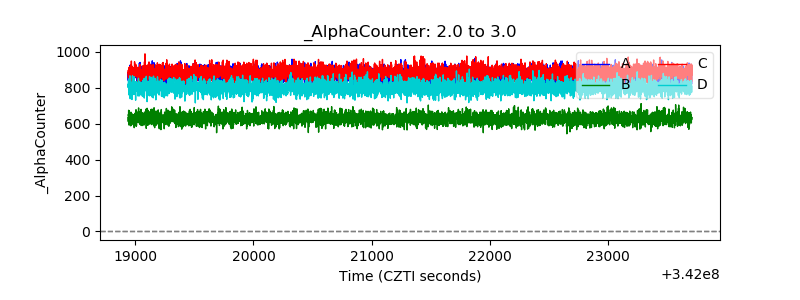 |
| _CPM_Rate | 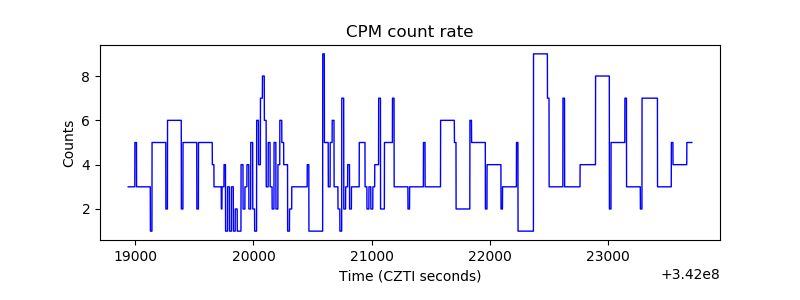 |
| CZT Counter | 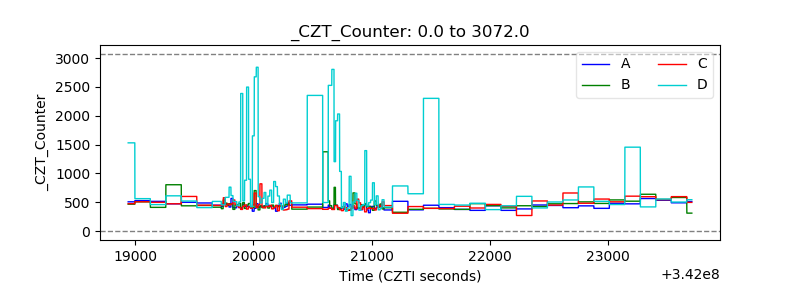 |
| +2.5 Volts monitor |  |
| +5 Volts monitor |  |
| _ROLL_ROT | 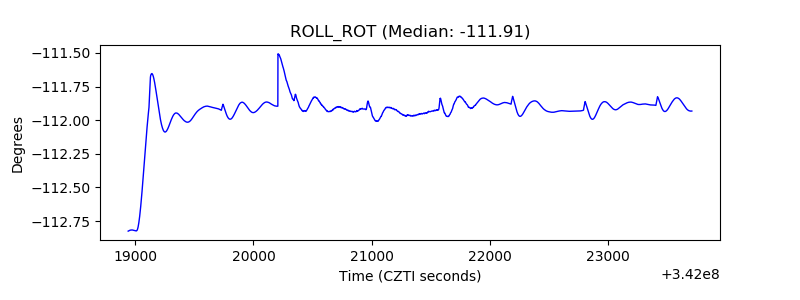 |
| _Roll_DEC | 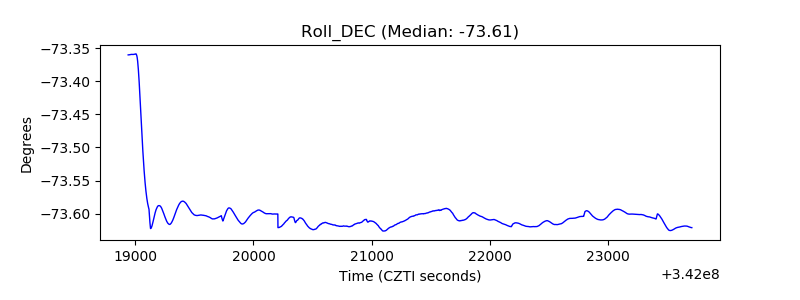 |
| _Roll_RA | 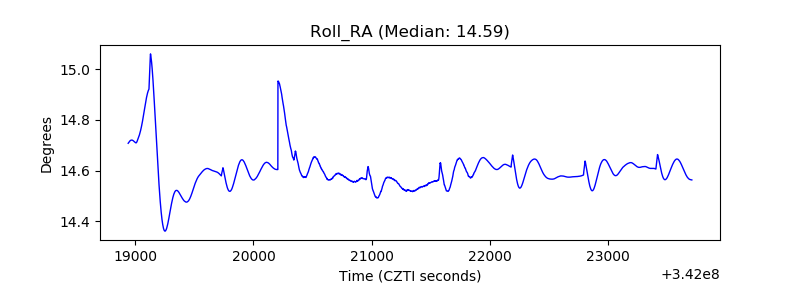 |
| Veto Counter | 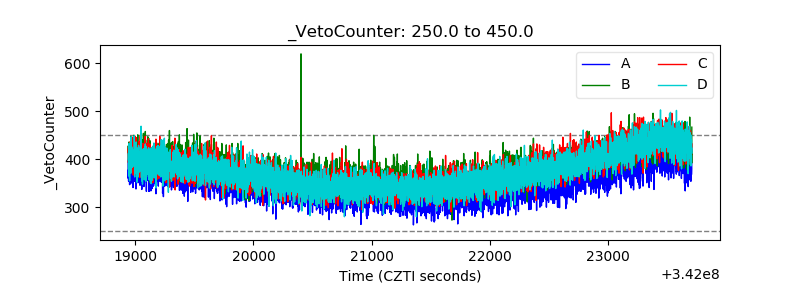 |