| Param | Original file | Final file |
|---|---|---|
| Filename | modeM0/AS1A09_038T31_9000003960cztM0_level2.fits | modeM0/AS1A09_038T31_9000003960cztM0_level2_quad_clean.evt |
| Size (bytes) | 39,669,120 | 43,309,440 |
| Size | 37.8 MB | 41.3 MB |
| Events in quadrant A | 237,962 | 266,391 |
| Events in quadrant B | 224,700 | 261,045 |
| Events in quadrant C | 231,104 | 246,687 |
| Events in quadrant D | 200,830 | 229,684 |
| Mode M9 | |||
|---|---|---|---|
| Quadrant | BADHDUFLAG | Total packets | Discarded packets |
| A | 0 | 7 | 0 |
| B | 0 | 7 | 0 |
| C | 0 | 7 | 0 |
| D | 0 | 7 | 0 |
| Mode SS | |||
|---|---|---|---|
| Quadrant | BADHDUFLAG | Total packets | Discarded packets |
| A | 0 | 88 | 0 |
| B | 0 | 88 | 0 |
| C | 0 | 88 | 0 |
| D | 0 | 88 | 0 |
| Mode M0 | |||
|---|---|---|---|
| Quadrant | BADHDUFLAG | Total packets | Discarded packets |
| A | 0 | 8836 | 0 |
| B | 0 | 10101 | 0 |
| C | 0 | 9167 | 0 |
| D | 0 | 10539 | 0 |
| Quadrant | Total seconds | Saturated seconds | Saturation percentage |
|---|---|---|---|
| A | 4366 | 25 | 0.572607% |
| B | 4366 | 125 | 2.863033% |
| C | 4366 | 30 | 0.687128% |
| D | 4366 | 68 | 1.557490% |
Noise dominated data is calculated using 1-second bins in cleaned event files. If a bin has >2000 counts, and if more than 50% of those come from <1% of pixels, then it is considered to be noise-dominated and hence unusable.
| Quadrant | # 1 sec bins | Bins with >0 counts | Bins with >2000 counts | High rate bins dominated by noise | Noise dominated (total time) | Noise dominated (detector-on time) | Marked lightcurve |
|---|---|---|---|---|---|---|---|
| A | 4980 | 4364 | 0 | 0 | 0.00% | 0.00% |  |
| B | 4980 | 4364 | 0 | 0 | 0.00% | 0.00% |  |
| C | 4980 | 4364 | 0 | 0 | 0.00% | 0.00% |  |
| D | 4980 | 4365 | 0 | 0 | 0.00% | 0.00% |  |
Top three noisy pixels from each quadrant. If the there are fewer than three noisy pixels in the level2.evt file, extra rows are filled as -1
| Pixel properties | Quadrant properties | ||||||
|---|---|---|---|---|---|---|---|
| Quadrant | DetID | PixID | Counts | Sigma | Mean | Median | Sigma |
| A | 0 | 29 | 243 | 10.5 | 62 | 58 | 17.6 |
| A | 0 | 30 | 192 | 7.61 | 62 | 58 | 17.6 |
| A | 7 | 110 | 191 | 7.55 | 62 | 58 | 17.6 |
| B | 2 | 9 | 186 | 9.19 | 59 | 56 | 14.1 |
| B | 14 | 254 | 171 | 8.13 | 59 | 56 | 14.1 |
| B | 5 | 128 | 157 | 7.14 | 59 | 56 | 14.1 |
| C | 3 | 202 | 191 | 7.59 | 61 | 57 | 17.7 |
| C | 3 | 203 | 179 | 6.91 | 61 | 57 | 17.7 |
| C | 12 | 242 | 173 | 6.57 | 61 | 57 | 17.7 |
| D | 4 | 246 | 162 | 6.42 | 57 | 52 | 17.1 |
| D | 6 | 231 | 150 | 5.72 | 57 | 52 | 17.1 |
| D | 12 | 235 | 145 | 5.43 | 57 | 52 | 17.1 |
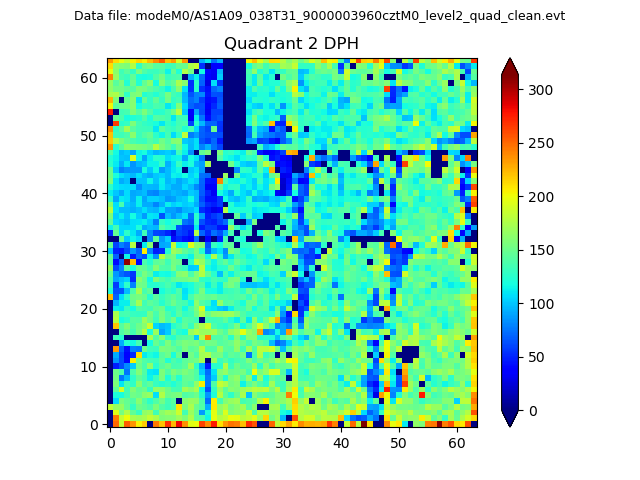
Histogram calculated using DETX and DETY for each event in the final _common_clean file
| Quadrant A |  |
 |
Quadrant B |
|---|---|---|---|
| Quadrant D |  |
 |
Quadrant C |
| Plot type | Count rate plots | Images |
|---|---|---|
| Comparison with Poisson distribution Blue bars denote a histogram of data divided into 1 sec bins. Red curve is a Poisson curve with rate = median count rate of data. |
 |
 |
| Quadrant-wise count rates Data is divided into 100 sec bins |
 |
|
| Module-wise count rates for Quadrant A Data is divided into 100 sec bins |
 |
 |
| Module-wise count rates for Quadrant B Data is divided into 100 sec bins |
 |
 |
| Module-wise count rates for Quadrant C Data is divided into 100 sec bins |
 |
 |
| Module-wise count rates for Quadrant D Data is divided into 100 sec bins |
 |
 |
| Parameter | Plot |
|---|---|
| CZT HV Monitor |  |
| D_VDD |  |
| Temperature 1 |  |
| Veto HV Monitor |  |
| Veto LLD |  |
| Alpha Counter |  |
| _CPM_Rate |  |
| CZT Counter |  |
| +2.5 Volts monitor |  |
| +5 Volts monitor |  |
| _ROLL_ROT |  |
| _Roll_DEC |  |
| _Roll_RA |  |
| Veto Counter |  |