| Param | Original file | Final file |
|---|---|---|
| Filename | modeM0/AS1A09_038T31_9000003960_27568cztM0_level2.evt | modeM0/AS1A09_038T31_9000003960_27568cztM0_level2_quad_clean.evt |
| Size (bytes) | 304,692,480 | 78,652,800 |
| Size | 290.6 MB | 75.0 MB |
| Events in quadrant A | 1,922,595 | 532,490 |
| Events in quadrant B | 2,388,579 | 531,115 |
| Events in quadrant C | 2,071,442 | 511,082 |
| Events in quadrant D | 2,547,391 | 500,265 |
| Mode M9 | |||
|---|---|---|---|
| Quadrant | BADHDUFLAG | Total packets | Discarded packets |
| A | 0 | 7 | 0 |
| B | 0 | 7 | 0 |
| C | 0 | 7 | 0 |
| D | 0 | 7 | 0 |
| Mode M0 | |||
|---|---|---|---|
| Quadrant | BADHDUFLAG | Total packets | Discarded packets |
| A | 0 | 8836 | 0 |
| B | 0 | 10101 | 0 |
| C | 0 | 9167 | 0 |
| D | 0 | 10539 | 0 |
| Quadrant | Total seconds | Saturated seconds | Saturation percentage |
|---|---|---|---|
| A | 4366 | 25 | 0.572607% |
| B | 4366 | 125 | 2.863033% |
| C | 4366 | 30 | 0.687128% |
| D | 4366 | 68 | 1.557490% |
Noise dominated data is calculated using 1-second bins in cleaned event files. If a bin has >2000 counts, and if more than 50% of those come from <1% of pixels, then it is considered to be noise-dominated and hence unusable.
| Quadrant | # 1 sec bins | Bins with >0 counts | Bins with >2000 counts | High rate bins dominated by noise | Noise dominated (total time) | Noise dominated (detector-on time) | Marked lightcurve |
|---|---|---|---|---|---|---|---|
| A | 4981 | 4367 | 3 | 3 | 0.06% | 0.07% | 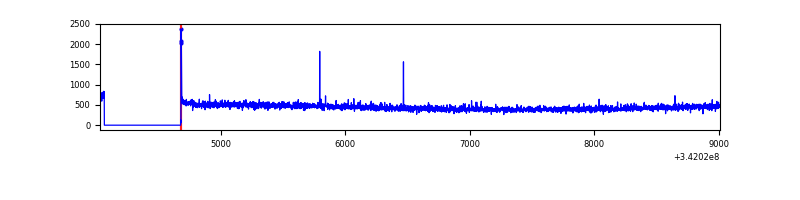 |
| B | 4981 | 4367 | 66 | 66 | 1.33% | 1.51% | 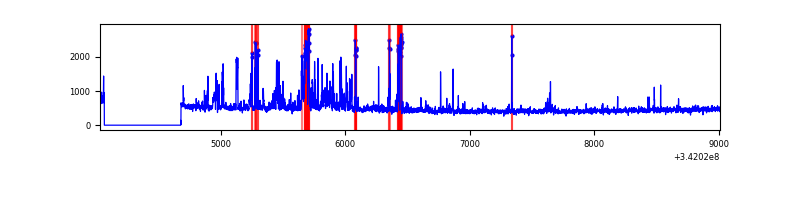 |
| C | 4981 | 4367 | 4 | 4 | 0.08% | 0.09% | 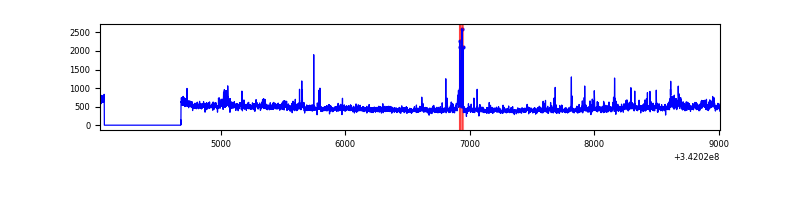 |
| D | 4981 | 4367 | 68 | 68 | 1.37% | 1.56% | 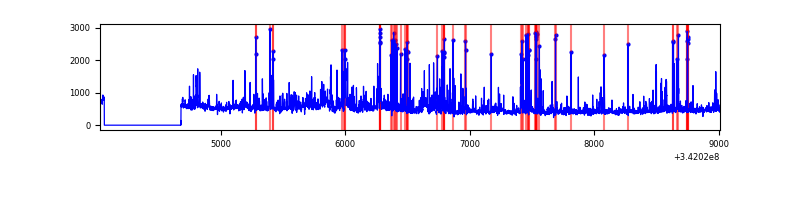 |
Top three noisy pixels from each quadrant. If the there are fewer than three noisy pixels in the level2.evt file, extra rows are filled as -1
| Pixel properties | Quadrant properties | ||||||
|---|---|---|---|---|---|---|---|
| Quadrant | DetID | PixID | Counts | Sigma | Mean | Median | Sigma |
| A | 8 | 192 | 8485 | 79.23 | 494 | 484 | 101.0 |
| A | 13 | 254 | 8310 | 77.5 | 494 | 484 | 101.0 |
| A | 13 | 248 | 5369 | 48.37 | 494 | 484 | 101.0 |
| B | 4 | 52 | 321675 | 3398.91 | 487 | 475 | 94.5 |
| B | 10 | 245 | 102545 | 1080.1 | 487 | 475 | 94.5 |
| B | 15 | 32 | 17926 | 184.67 | 487 | 475 | 94.5 |
| C | 15 | 208 | 102414 | 917.15 | 468 | 469 | 111.2 |
| C | 14 | 238 | 76332 | 682.5 | 468 | 469 | 111.2 |
| C | 2 | 16 | 50894 | 453.65 | 468 | 469 | 111.2 |
| D | 1 | 52 | 569916 | 5039.76 | 468 | 455 | 113.0 |
| D | 7 | 80 | 81640 | 718.49 | 468 | 455 | 113.0 |
| D | 2 | 250 | 62553 | 549.57 | 468 | 455 | 113.0 |
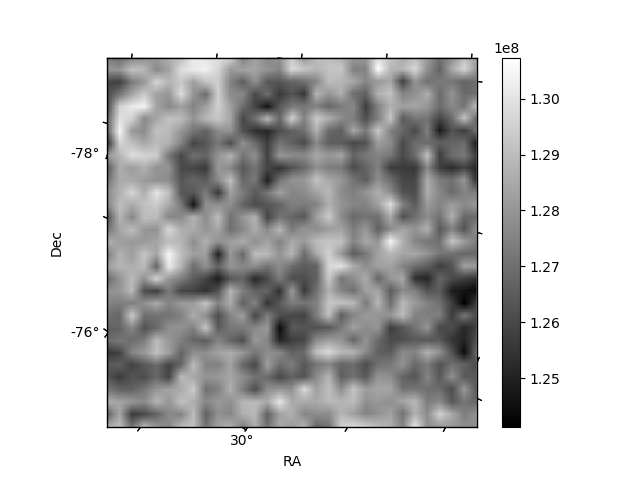
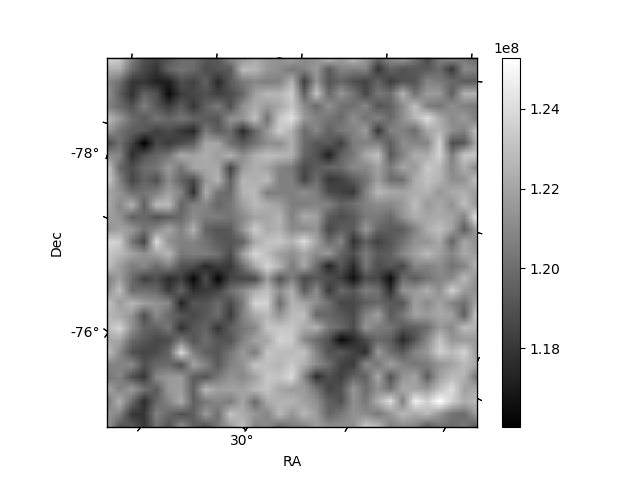
Histogram calculated using DETX and DETY for each event in the final _common_clean file
| Quadrant A | 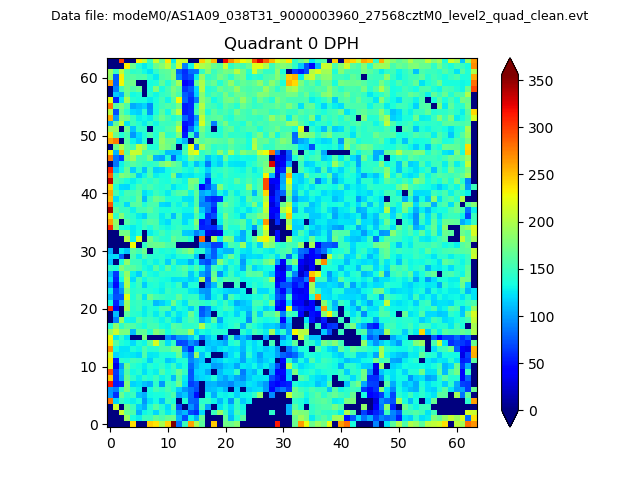 |
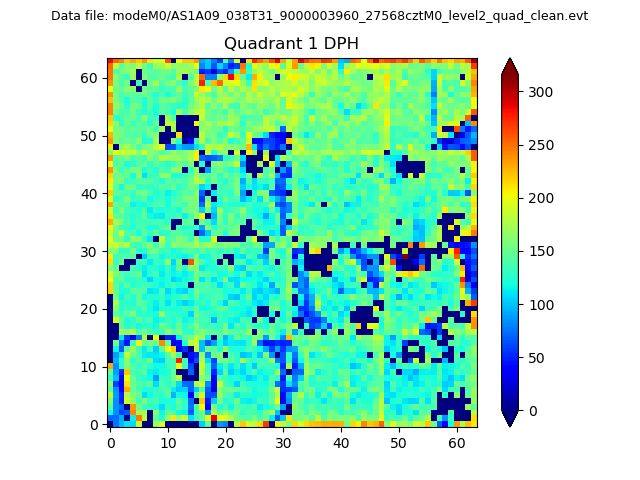 |
Quadrant B |
|---|---|---|---|
| Quadrant D | 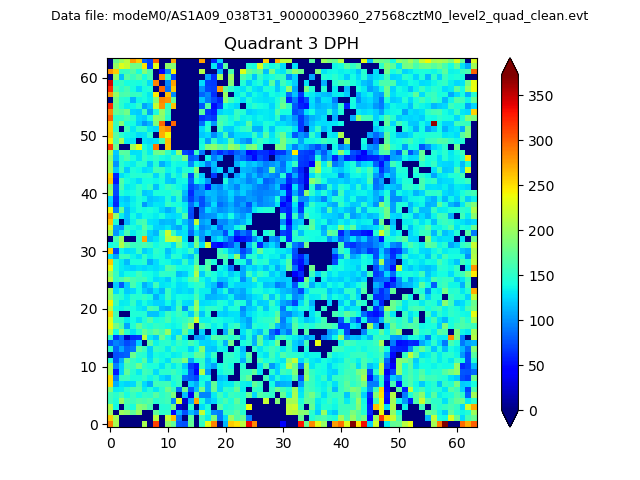 |
 |
Quadrant C |
| Plot type | Count rate plots | Images |
|---|---|---|
| Comparison with Poisson distribution Blue bars denote a histogram of data divided into 1 sec bins. Red curve is a Poisson curve with rate = median count rate of data. |
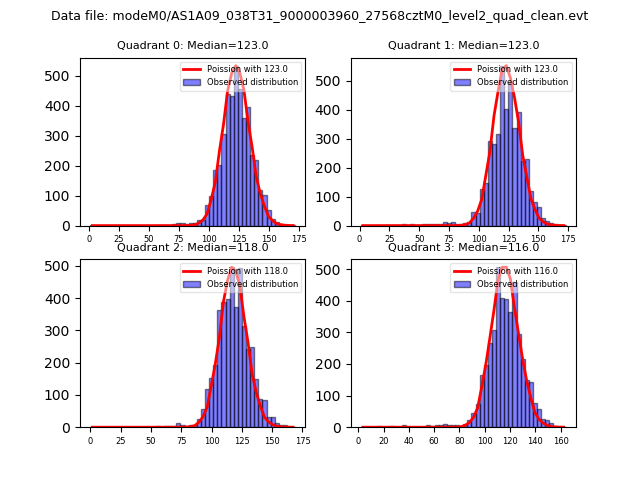 |
 |
| Quadrant-wise count rates Data is divided into 100 sec bins |
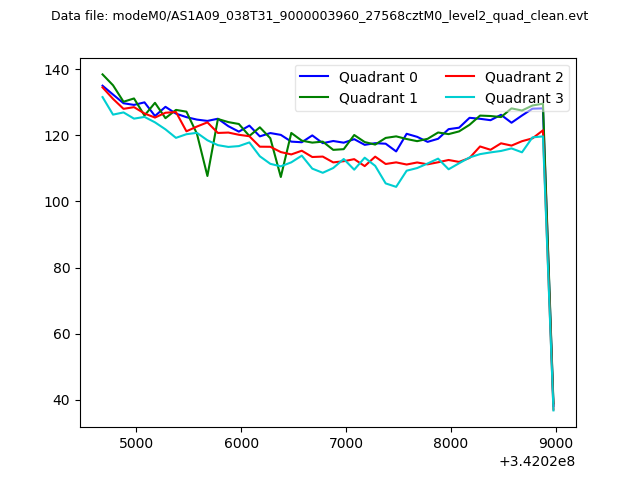 |
|
| Module-wise count rates for Quadrant A Data is divided into 100 sec bins |
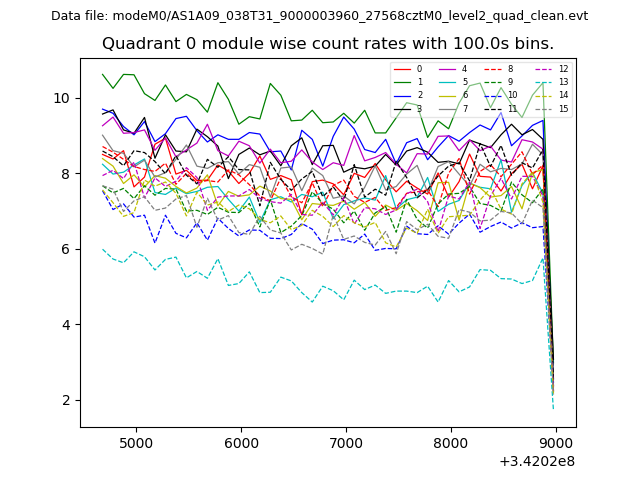 |
 |
| Module-wise count rates for Quadrant B Data is divided into 100 sec bins |
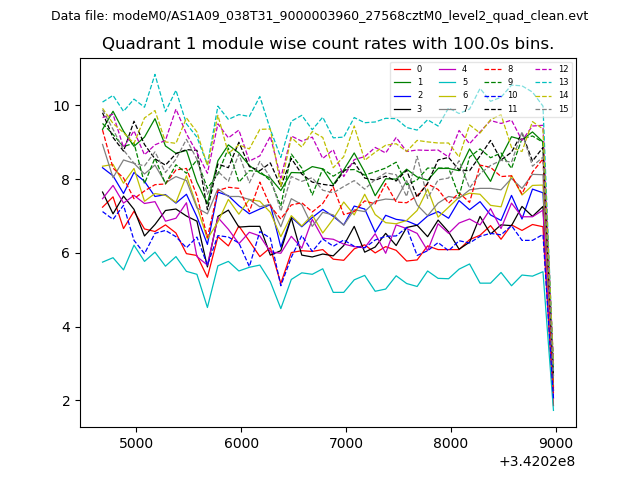 |
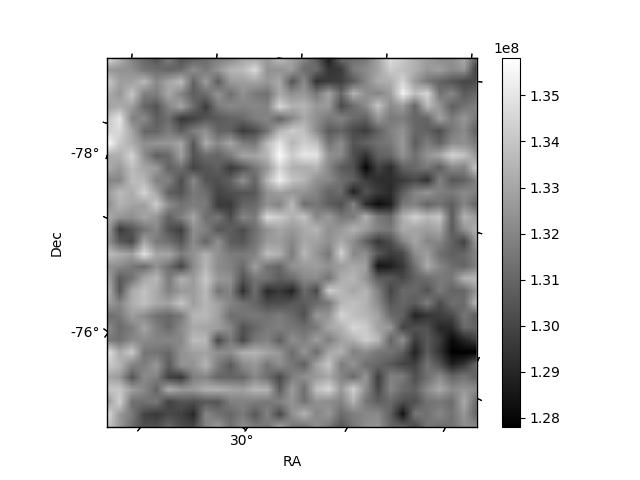 |
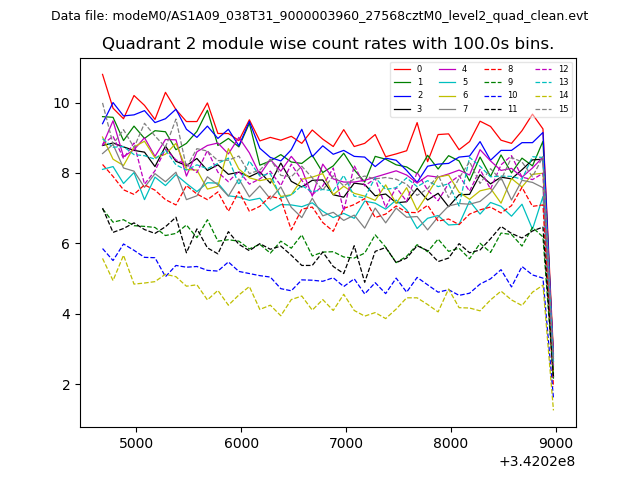
| Module-wise count rates for Quadrant C Data is divided into 100 sec bins |
 |
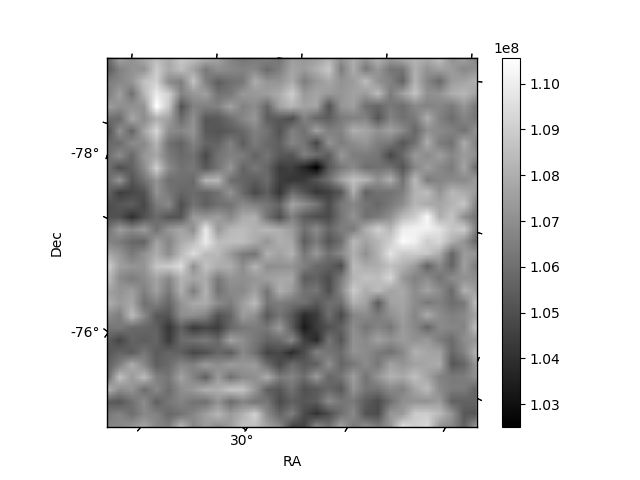 |
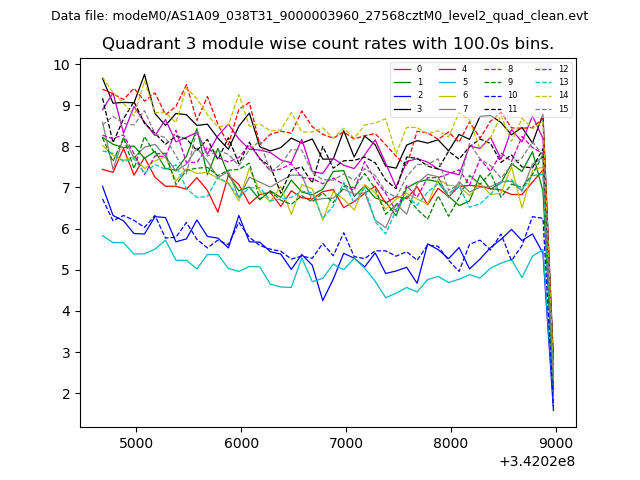
| Module-wise count rates for Quadrant D Data is divided into 100 sec bins |
 |
 |
| Parameter | Plot |
|---|---|
| CZT HV Monitor | 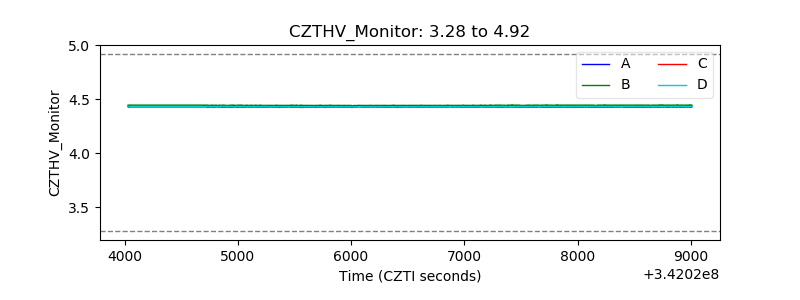 |
| D_VDD | 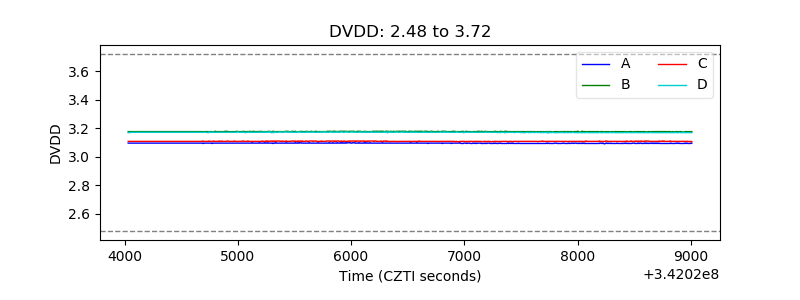 |
| Temperature 1 | 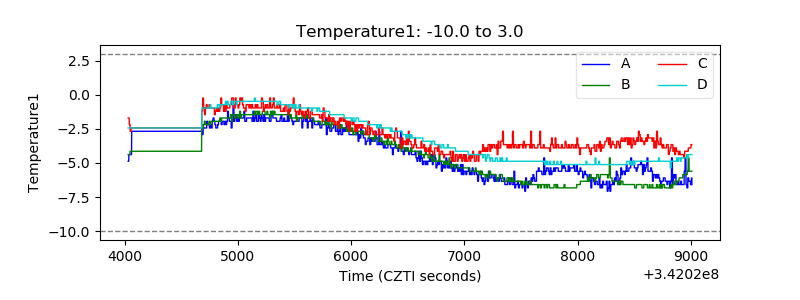 |
| Veto HV Monitor | 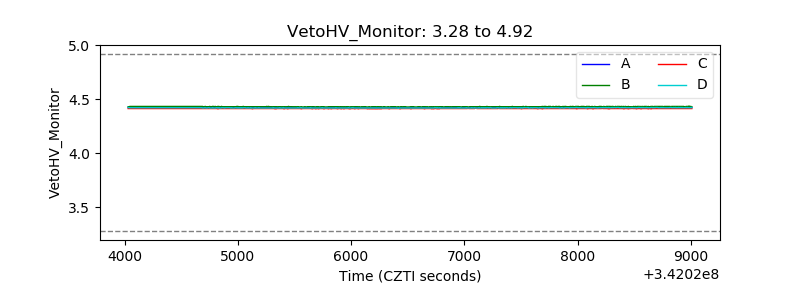 |
| Veto LLD | 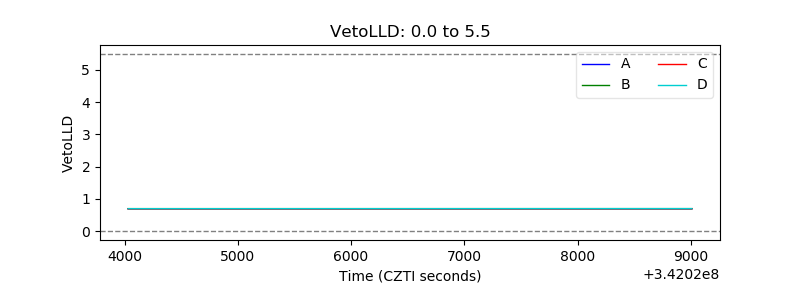 |
| Alpha Counter | 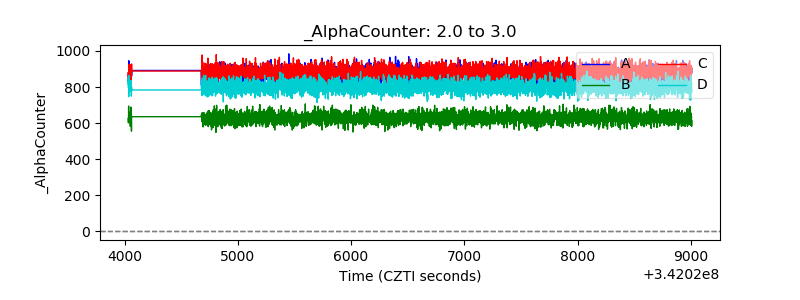 |
| _CPM_Rate | 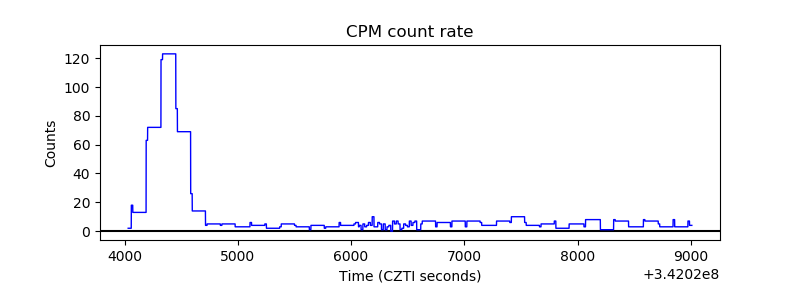 |
| CZT Counter |  |
| +2.5 Volts monitor |  |
| +5 Volts monitor |  |
| _ROLL_ROT | 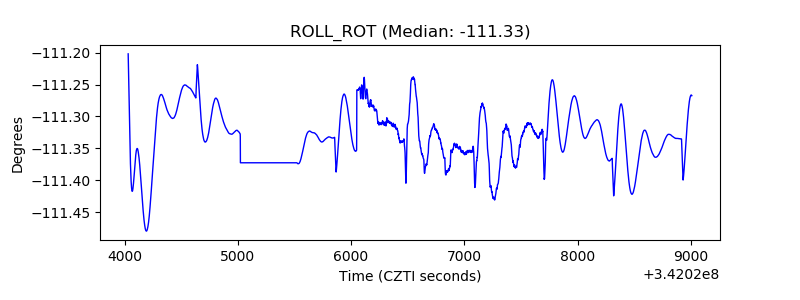 |
| _Roll_DEC | 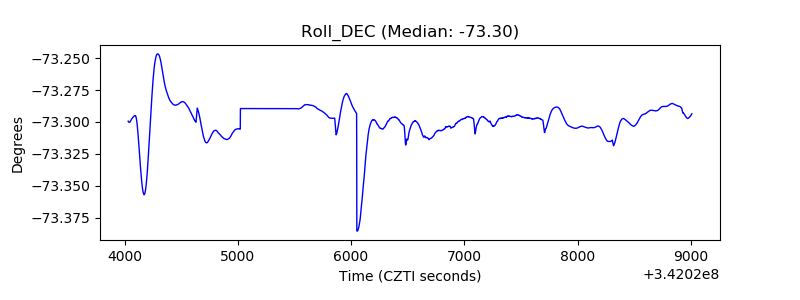 |
| _Roll_RA | 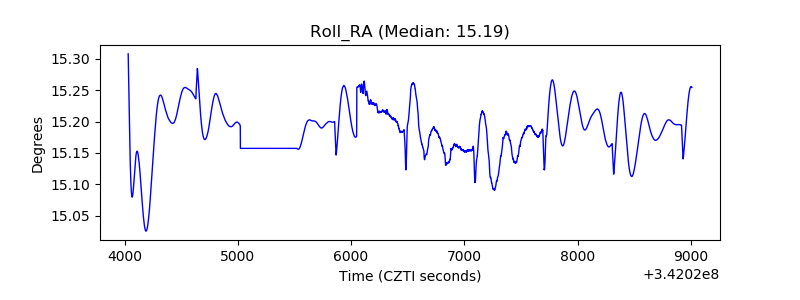 |
| Veto Counter | 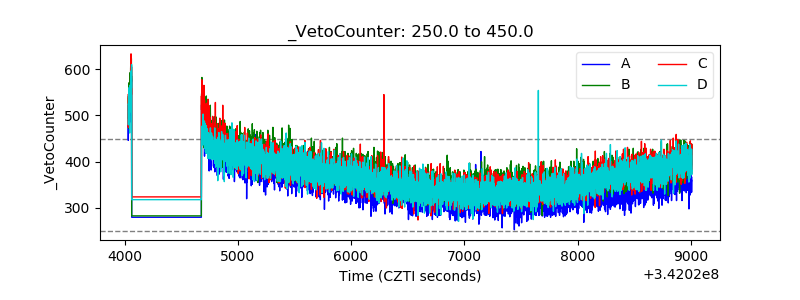 |