| Param | Original file | Final file |
|---|---|---|
| Filename | modeM0/AS1A09_038T32_9000003962cztM0_level2.fits | modeM0/AS1A09_038T32_9000003962cztM0_level2_quad_clean.evt |
| Size (bytes) | 49,000,320 | 42,022,080 |
| Size | 46.7 MB | 40.1 MB |
| Events in quadrant A | 296,678 | 240,601 |
| Events in quadrant B | 285,268 | 238,623 |
| Events in quadrant C | 286,182 | 219,996 |
| Events in quadrant D | 248,246 | 204,694 |
| Mode M0 | |||
|---|---|---|---|
| Quadrant | BADHDUFLAG | Total packets | Discarded packets |
| A | 0 | 10705 | 0 |
| B | 0 | 10801 | 0 |
| C | 0 | 11438 | 0 |
| D | 0 | 13721 | 0 |
| Mode M9 | |||
|---|---|---|---|
| Quadrant | BADHDUFLAG | Total packets | Discarded packets |
| A | 0 | 7 | 0 |
| B | 0 | 7 | 0 |
| C | 0 | 7 | 0 |
| D | 0 | 7 | 0 |
| Mode SS | |||
|---|---|---|---|
| Quadrant | BADHDUFLAG | Total packets | Discarded packets |
| A | 0 | 108 | 0 |
| B | 0 | 108 | 0 |
| C | 0 | 108 | 0 |
| D | 0 | 108 | 0 |
| Quadrant | Total seconds | Saturated seconds | Saturation percentage |
|---|---|---|---|
| A | 5246 | 36 | 0.686237% |
| B | 5246 | 33 | 0.629051% |
| C | 5246 | 78 | 1.486847% |
| D | 5246 | 178 | 3.393061% |
Noise dominated data is calculated using 1-second bins in cleaned event files. If a bin has >2000 counts, and if more than 50% of those come from <1% of pixels, then it is considered to be noise-dominated and hence unusable.
| Quadrant | # 1 sec bins | Bins with >0 counts | Bins with >2000 counts | High rate bins dominated by noise | Noise dominated (total time) | Noise dominated (detector-on time) | Marked lightcurve |
|---|---|---|---|---|---|---|---|
| A | 5981 | 5246 | 0 | 0 | 0.00% | 0.00% | 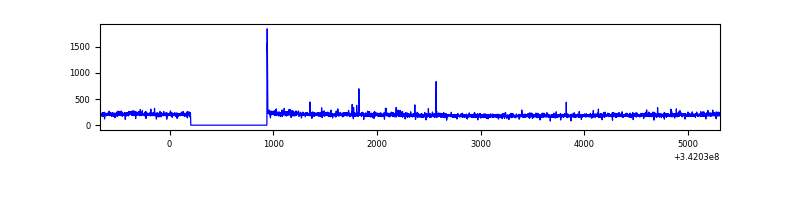 |
| B | 5980 | 5245 | 0 | 0 | 0.00% | 0.00% | 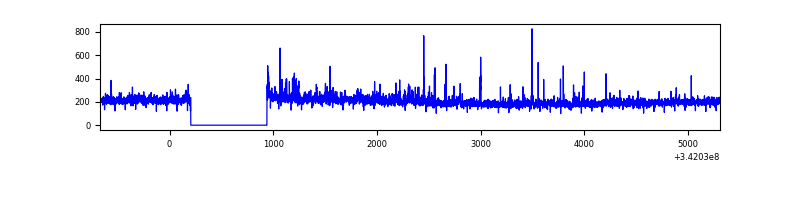 |
| C | 5980 | 5245 | 0 | 0 | 0.00% | 0.00% |  |
| D | 5980 | 5242 | 0 | 0 | 0.00% | 0.00% | 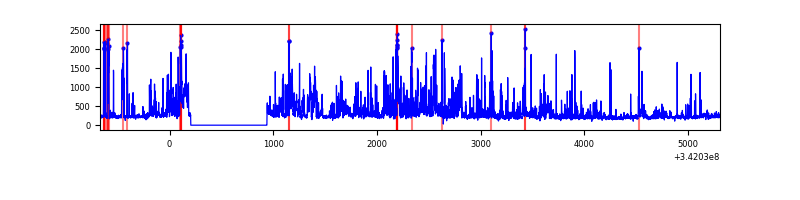 |
Top three noisy pixels from each quadrant. If the there are fewer than three noisy pixels in the level2.evt file, extra rows are filled as -1
| Pixel properties | Quadrant properties | ||||||
|---|---|---|---|---|---|---|---|
| Quadrant | DetID | PixID | Counts | Sigma | Mean | Median | Sigma |
| A | 0 | 29 | 308 | 11.13 | 77 | 72 | 21.2 |
| A | 0 | 30 | 254 | 8.58 | 77 | 72 | 21.2 |
| A | 7 | 110 | 235 | 7.69 | 77 | 72 | 21.2 |
| B | 2 | 9 | 211 | 7.88 | 75 | 72 | 17.6 |
| B | 2 | 245 | 197 | 7.09 | 75 | 72 | 17.6 |
| B | 14 | 254 | 193 | 6.86 | 75 | 72 | 17.6 |
| C | 3 | 202 | 230 | 7.65 | 75 | 71 | 20.8 |
| C | 12 | 241 | 221 | 7.21 | 75 | 71 | 20.8 |
| C | 12 | 249 | 217 | 7.02 | 75 | 71 | 20.8 |
| D | 7 | 5 | 188 | 5.93 | 70 | 64 | 20.9 |
| D | 3 | 31 | 182 | 5.64 | 70 | 64 | 20.9 |
| D | 15 | 46 | 179 | 5.5 | 70 | 64 | 20.9 |
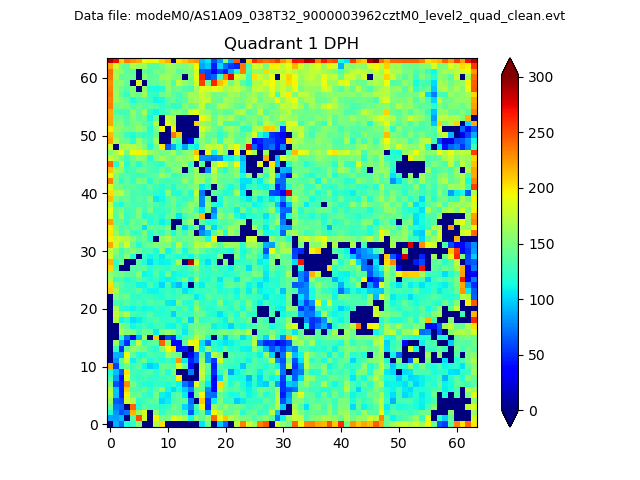
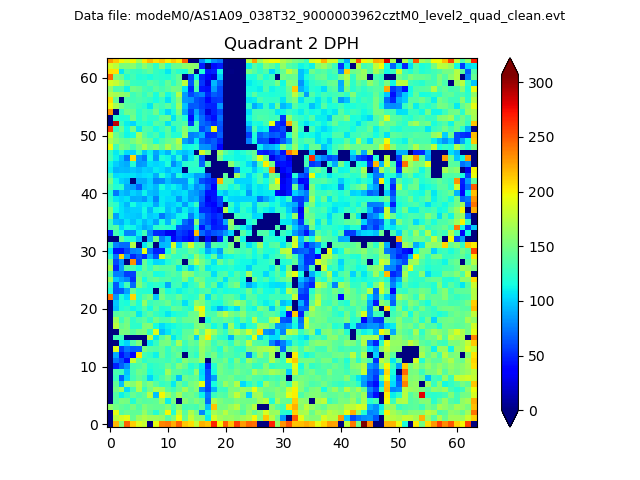
Histogram calculated using DETX and DETY for each event in the final _common_clean file
| Quadrant A | 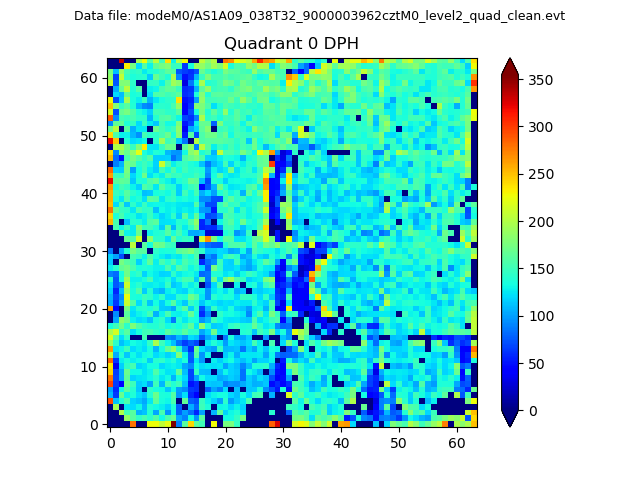 |
 |
Quadrant B |
|---|---|---|---|
| Quadrant D | 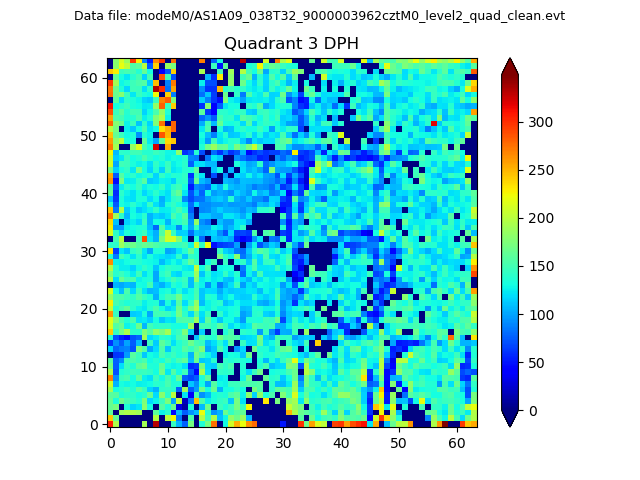 |
 |
Quadrant C |
| Plot type | Count rate plots | Images |
|---|---|---|
| Comparison with Poisson distribution Blue bars denote a histogram of data divided into 1 sec bins. Red curve is a Poisson curve with rate = median count rate of data. |
 |
 |
| Quadrant-wise count rates Data is divided into 100 sec bins |
 |
|
| Module-wise count rates for Quadrant A Data is divided into 100 sec bins |
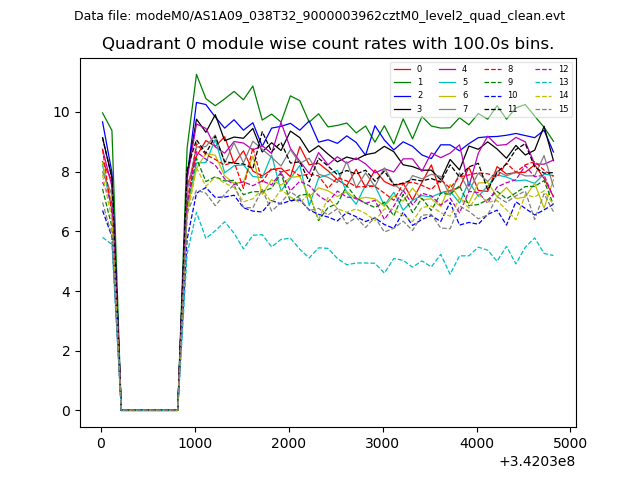 |
 |
| Module-wise count rates for Quadrant B Data is divided into 100 sec bins |
 |
 |
| Module-wise count rates for Quadrant C Data is divided into 100 sec bins |
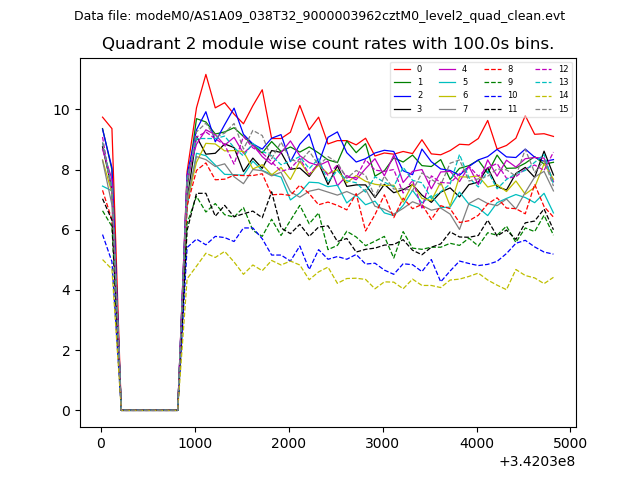 |
 |
| Module-wise count rates for Quadrant D Data is divided into 100 sec bins |
 |
 |
| Parameter | Plot |
|---|---|
| CZT HV Monitor |  |
| D_VDD | 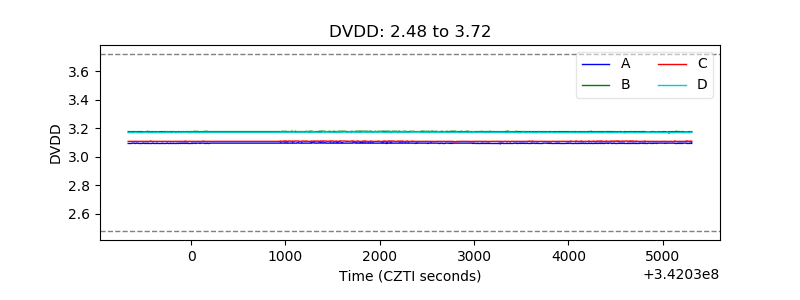 |
| Temperature 1 | 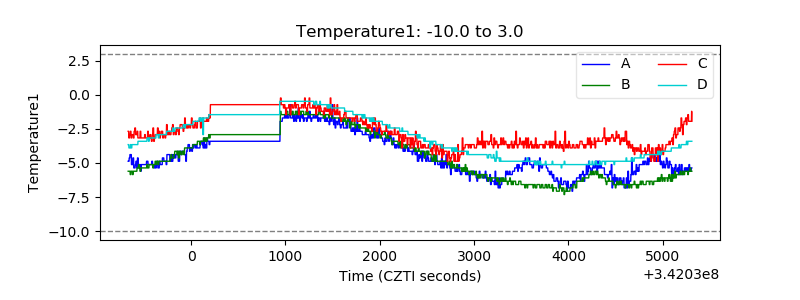 |
| Veto HV Monitor | 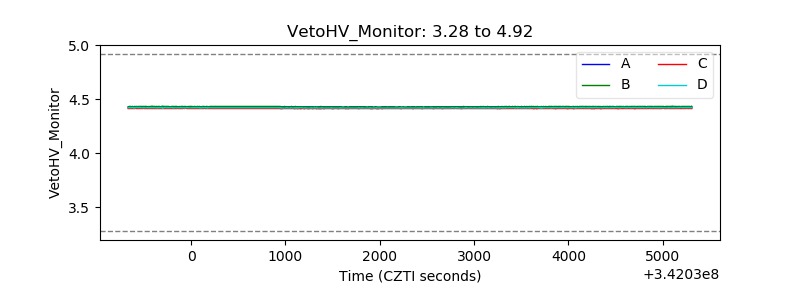 |
| Veto LLD |  |
| Alpha Counter | 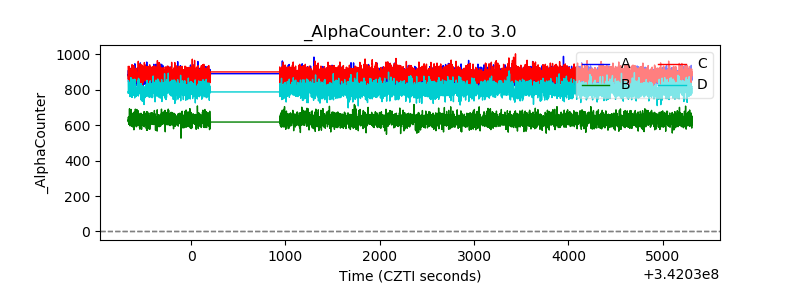 |
| _CPM_Rate |  |
| CZT Counter | 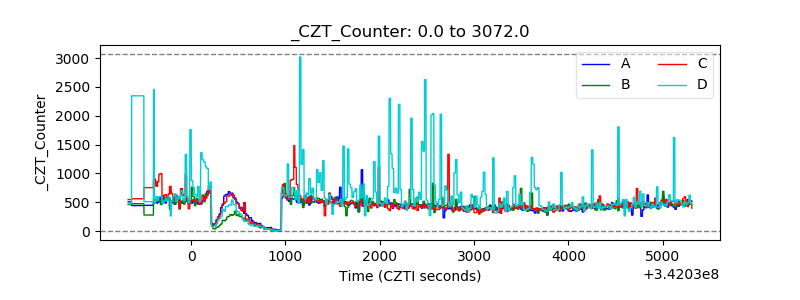 |
| +2.5 Volts monitor |  |
| +5 Volts monitor |  |
| _ROLL_ROT | 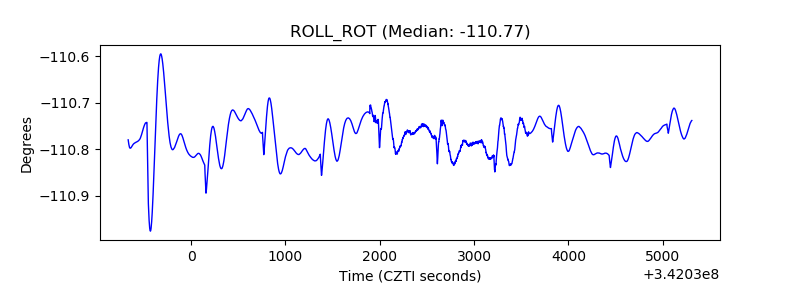 |
| _Roll_DEC |  |
| _Roll_RA | 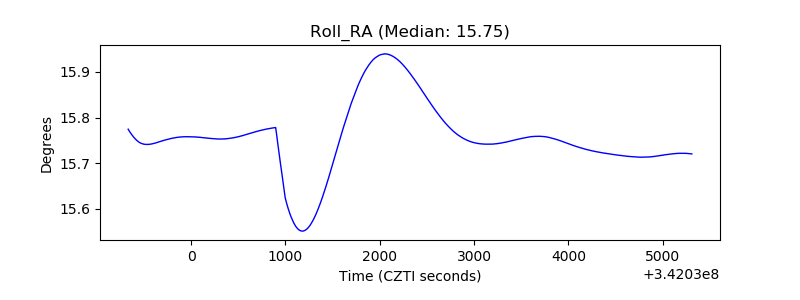 |
| Veto Counter |  |