| Param | Original file | Final file |
|---|---|---|
| Filename | modeM0/AS1A09_038T32_9000003962_27568cztM0_level2.evt | modeM0/AS1A09_038T32_9000003962_27568cztM0_level2_quad_clean.evt |
| Size (bytes) | 74,476,800 | 5,451,840 |
| Size | 71.0 MB | 5.2 MB |
| Events in quadrant A | 457,439 | 24,379 |
| Events in quadrant B | 466,462 | 24,823 |
| Events in quadrant C | 557,838 | 24,110 |
| Events in quadrant D | 711,134 | 22,370 |
| Mode M0 | |||
|---|---|---|---|
| Quadrant | BADHDUFLAG | Total packets | Discarded packets |
| A | 0 | 1831 | 0 |
| B | 0 | 1851 | 0 |
| C | 0 | 2267 | 0 |
| D | 0 | 2653 | 0 |
| Mode M9 | |||
|---|---|---|---|
| Quadrant | BADHDUFLAG | Total packets | Discarded packets |
| A | 0 | 5 | 0 |
| B | 0 | 5 | 0 |
| C | 0 | 5 | 0 |
| D | 0 | 5 | 0 |
| Quadrant | Total seconds | Saturated seconds | Saturation percentage |
|---|---|---|---|
| A | 875 | 23 | 2.628571% |
| B | 875 | 23 | 2.628571% |
| C | 875 | 35 | 4.000000% |
| D | 875 | 88 | 10.057143% |
Noise dominated data is calculated using 1-second bins in cleaned event files. If a bin has >2000 counts, and if more than 50% of those come from <1% of pixels, then it is considered to be noise-dominated and hence unusable.
| Quadrant | # 1 sec bins | Bins with >0 counts | Bins with >2000 counts | High rate bins dominated by noise | Noise dominated (total time) | Noise dominated (detector-on time) | Marked lightcurve |
|---|---|---|---|---|---|---|---|
| A | 875 | 875 | 0 | 0 | 0.00% | 0.00% | 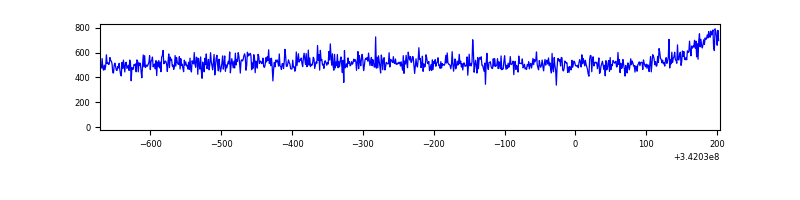 |
| B | 875 | 875 | 0 | 0 | 0.00% | 0.00% | 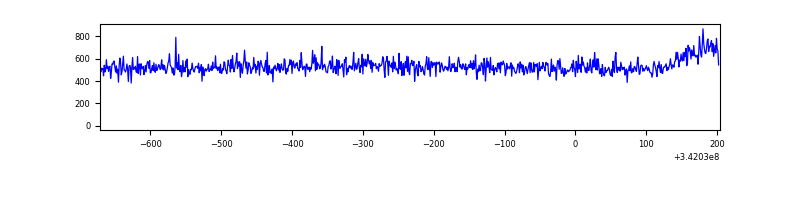 |
| C | 875 | 875 | 0 | 0 | 0.00% | 0.00% | 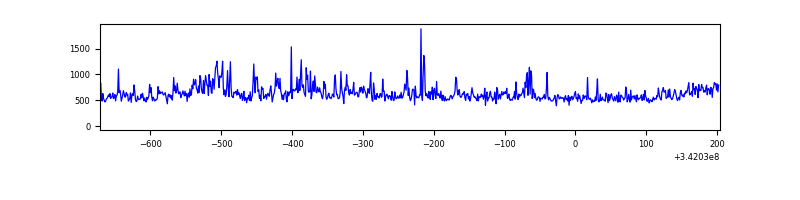 |
| D | 875 | 875 | 54 | 54 | 6.17% | 6.17% | 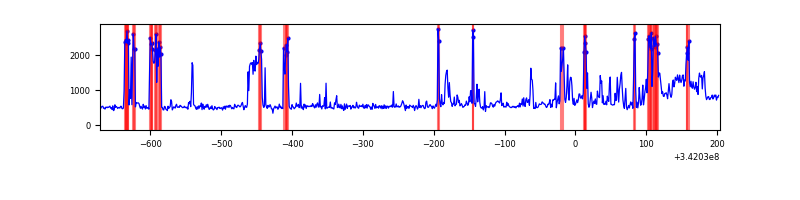 |
Top three noisy pixels from each quadrant. If the there are fewer than three noisy pixels in the level2.evt file, extra rows are filled as -1
| Pixel properties | Quadrant properties | ||||||
|---|---|---|---|---|---|---|---|
| Quadrant | DetID | PixID | Counts | Sigma | Mean | Median | Sigma |
| A | 13 | 254 | 1193 | 40.7 | 118 | 115 | 26.5 |
| A | 3 | 137 | 1184 | 40.36 | 118 | 115 | 26.5 |
| A | 0 | 226 | 981 | 32.69 | 118 | 115 | 26.5 |
| B | 12 | 111 | 2944 | 115.53 | 117 | 114 | 24.5 |
| B | 11 | 111 | 2672 | 104.42 | 117 | 114 | 24.5 |
| B | 14 | 111 | 2562 | 99.93 | 117 | 114 | 24.5 |
| C | 15 | 208 | 51217 | 1727.15 | 116 | 116 | 29.6 |
| C | 2 | 16 | 33378 | 1124.22 | 116 | 116 | 29.6 |
| C | 14 | 238 | 17813 | 598.14 | 116 | 116 | 29.6 |
| D | 1 | 52 | 239136 | 8295.55 | 115 | 112 | 28.8 |
| D | 7 | 80 | 26097 | 901.83 | 115 | 112 | 28.8 |
| D | 12 | 233 | 6489 | 221.32 | 115 | 112 | 28.8 |
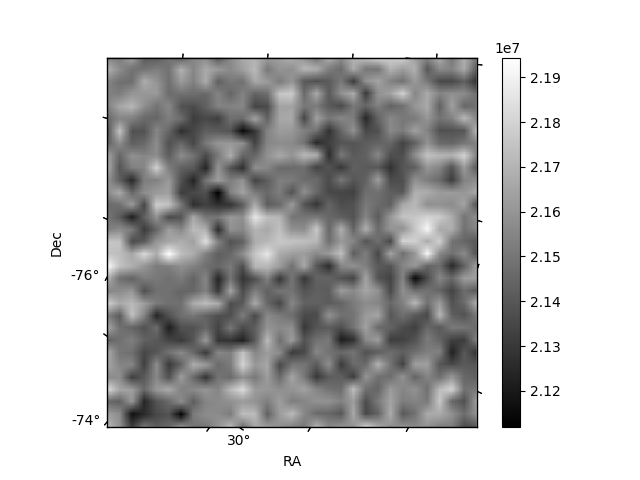
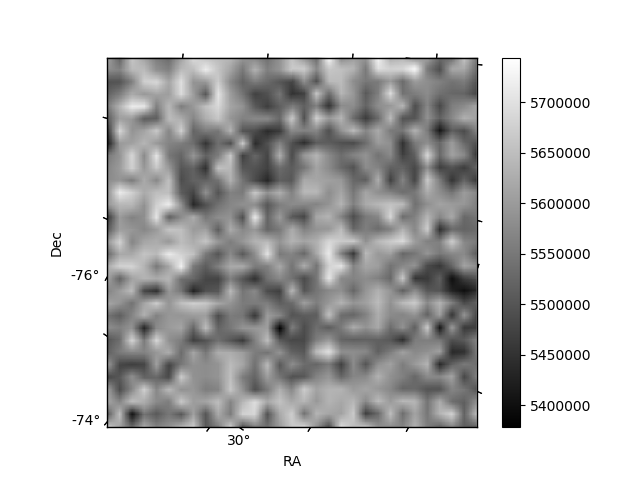
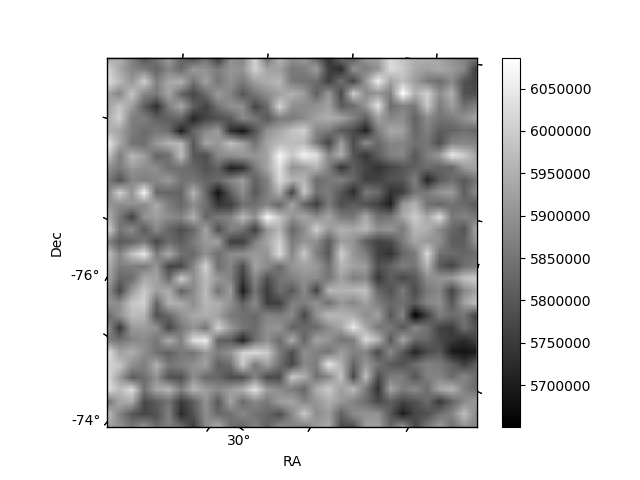
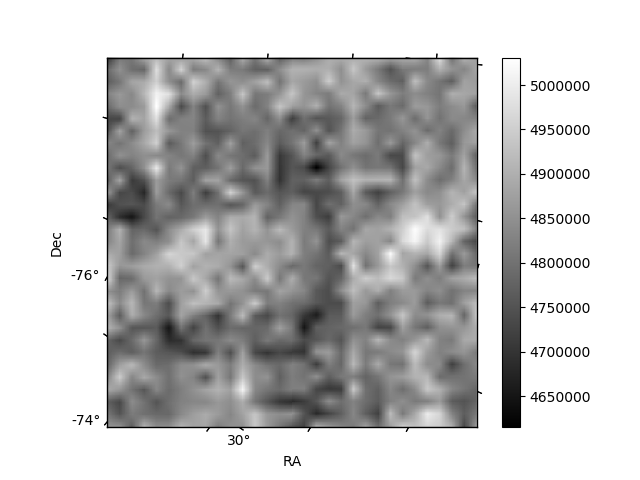
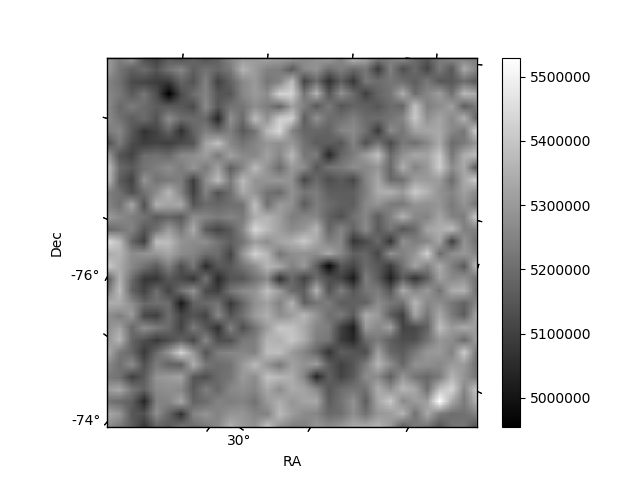
Histogram calculated using DETX and DETY for each event in the final _common_clean file
| Quadrant A | 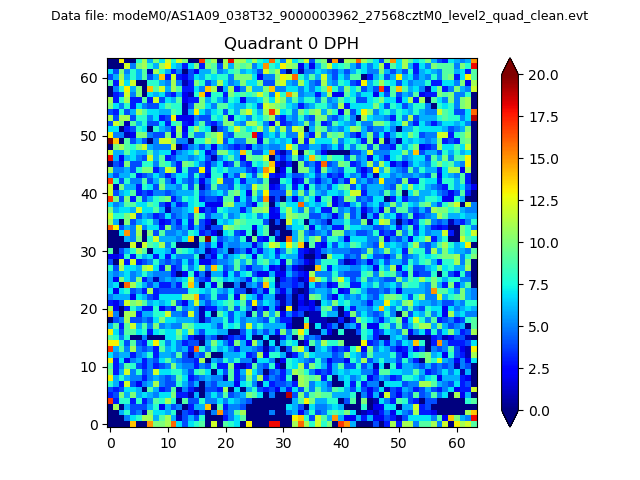 |
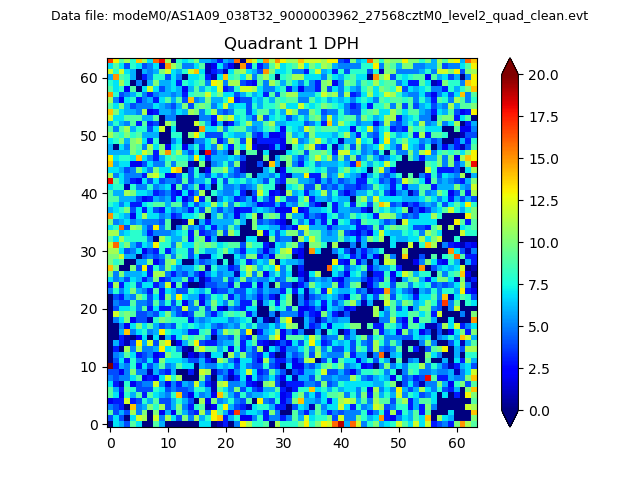 |
Quadrant B |
|---|---|---|---|
| Quadrant D | 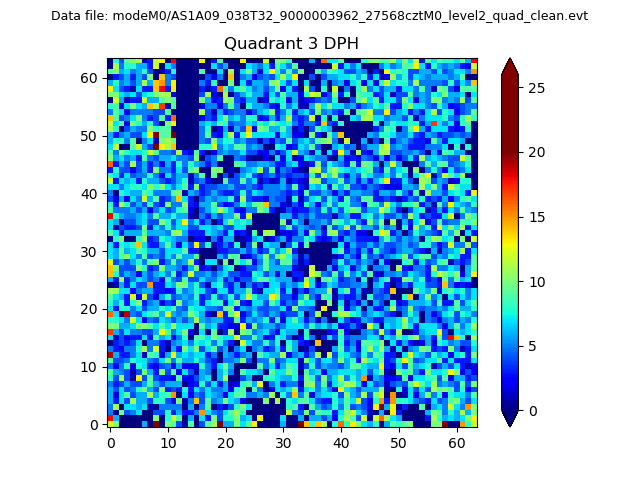 |
 |
Quadrant C |
| Plot type | Count rate plots | Images |
|---|---|---|
| Comparison with Poisson distribution Blue bars denote a histogram of data divided into 1 sec bins. Red curve is a Poisson curve with rate = median count rate of data. |
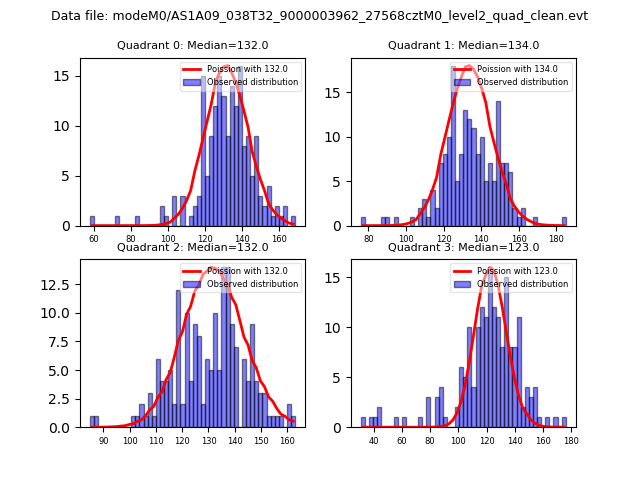 |
 |
| Quadrant-wise count rates Data is divided into 100 sec bins |
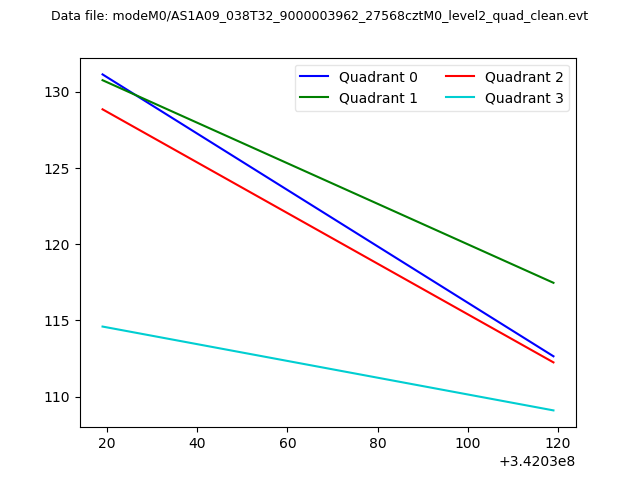 |
|
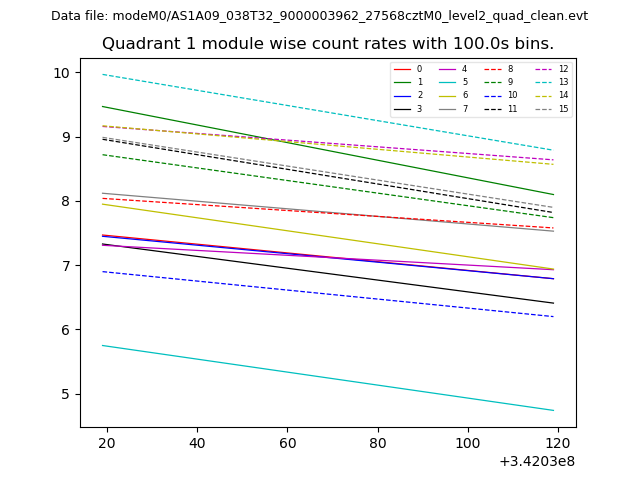
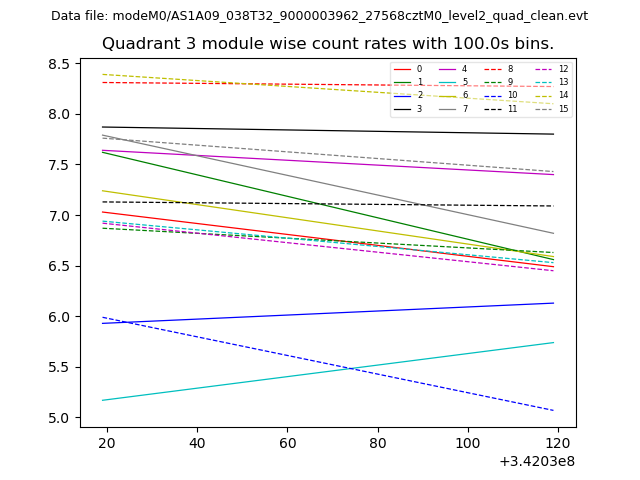
| Module-wise count rates for Quadrant A Data is divided into 100 sec bins |
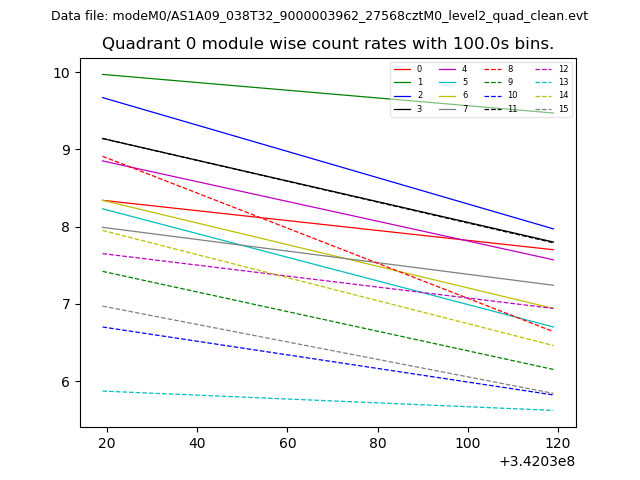 |
 |
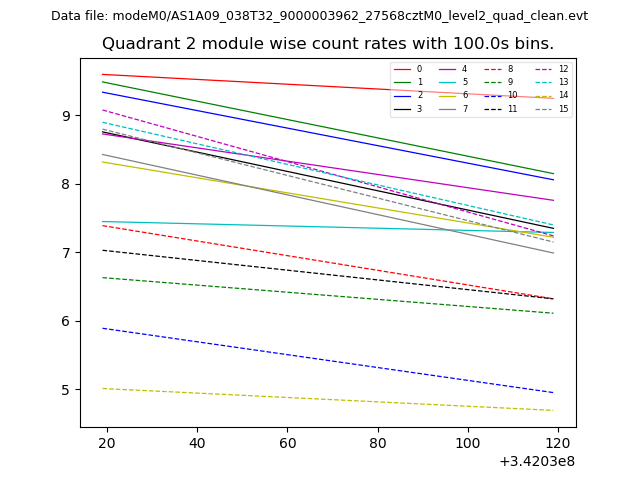
| Module-wise count rates for Quadrant B Data is divided into 100 sec bins |
 |
 |
| Module-wise count rates for Quadrant C Data is divided into 100 sec bins |
 |
 |
| Module-wise count rates for Quadrant D Data is divided into 100 sec bins |
 |
 |
| Parameter | Plot |
|---|---|
| CZT HV Monitor | 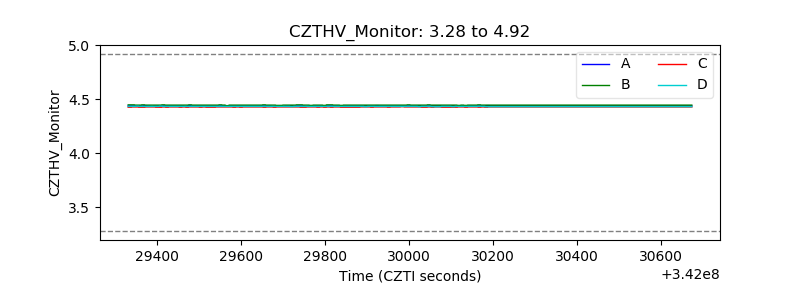 |
| D_VDD | 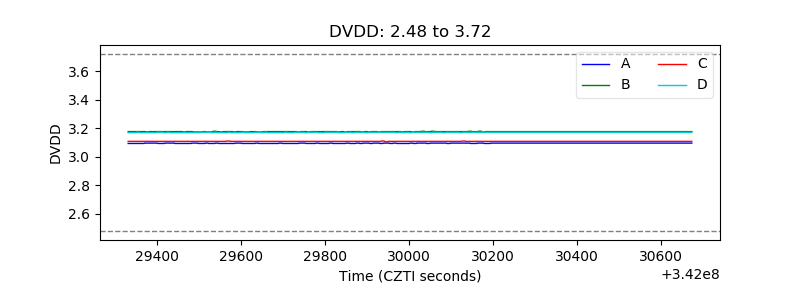 |
| Temperature 1 | 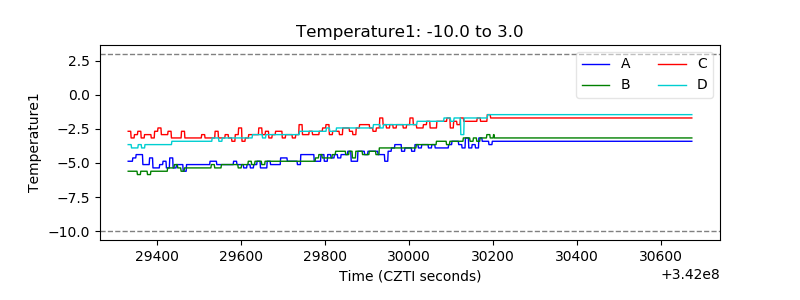 |
| Veto HV Monitor |  |
| Veto LLD | 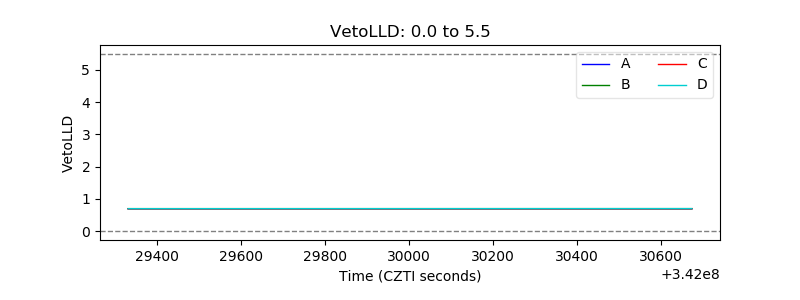 |
| Alpha Counter | 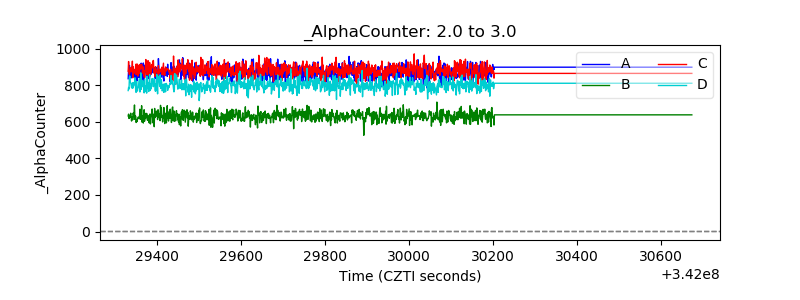 |
| _CPM_Rate | 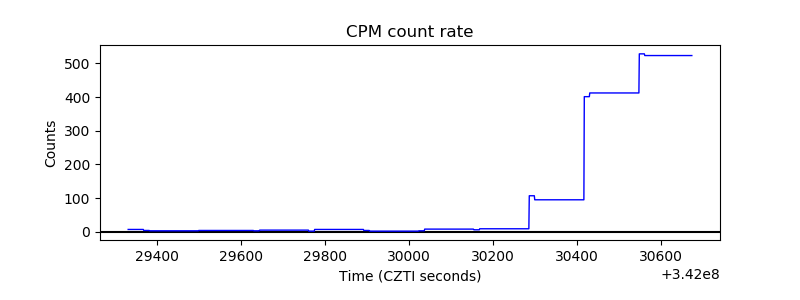 |
| CZT Counter | 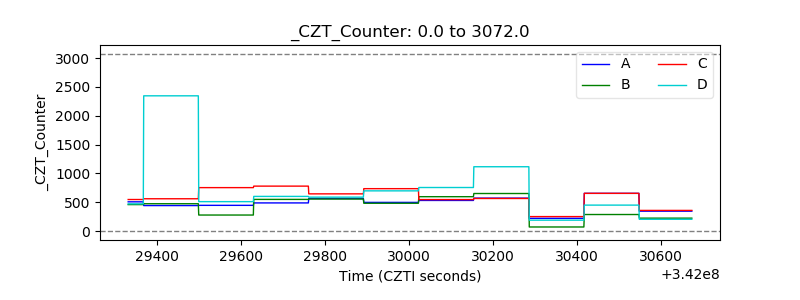 |
| +2.5 Volts monitor |  |
| +5 Volts monitor |  |
| _ROLL_ROT | 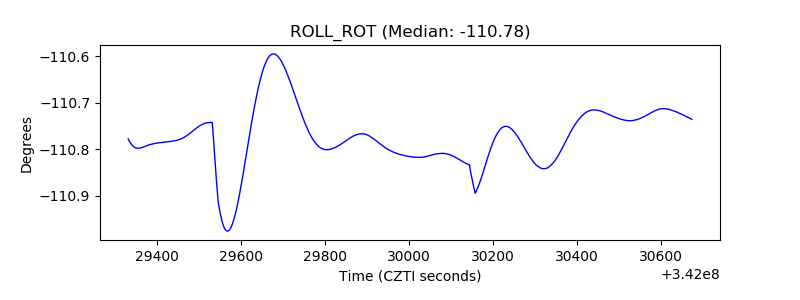 |
| _Roll_DEC | 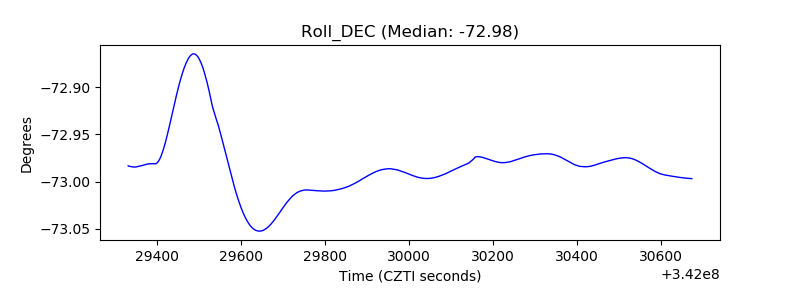 |
| _Roll_RA | 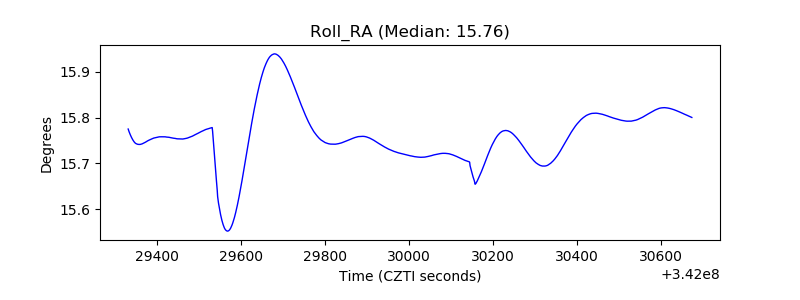 |
| Veto Counter | 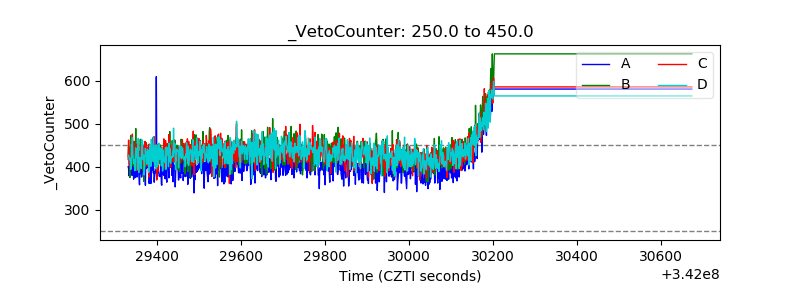 |