| Param | Original file | Final file |
|---|---|---|
| Filename | modeM0/AS1A09_038T32_9000003962_27569cztM0_level2.evt | modeM0/AS1A09_038T32_9000003962_27569cztM0_level2_quad_clean.evt |
| Size (bytes) | 297,345,600 | 73,776,960 |
| Size | 283.6 MB | 70.4 MB |
| Events in quadrant A | 1,933,068 | 495,617 |
| Events in quadrant B | 2,015,845 | 500,599 |
| Events in quadrant C | 2,053,124 | 470,635 |
| Events in quadrant D | 2,704,072 | 459,220 |
| Mode M0 | |||
|---|---|---|---|
| Quadrant | BADHDUFLAG | Total packets | Discarded packets |
| A | 0 | 8892 | 0 |
| B | 0 | 8970 | 0 |
| C | 0 | 9192 | 0 |
| D | 0 | 11089 | 0 |
| Mode M9 | |||
|---|---|---|---|
| Quadrant | BADHDUFLAG | Total packets | Discarded packets |
| A | 0 | 7 | 0 |
| B | 0 | 7 | 0 |
| C | 0 | 7 | 0 |
| D | 0 | 7 | 0 |
| Quadrant | Total seconds | Saturated seconds | Saturation percentage |
|---|---|---|---|
| A | 4377 | 18 | 0.411241% |
| B | 4378 | 17 | 0.388305% |
| C | 4378 | 49 | 1.119233% |
| D | 4378 | 93 | 2.124258% |
Noise dominated data is calculated using 1-second bins in cleaned event files. If a bin has >2000 counts, and if more than 50% of those come from <1% of pixels, then it is considered to be noise-dominated and hence unusable.
| Quadrant | # 1 sec bins | Bins with >0 counts | Bins with >2000 counts | High rate bins dominated by noise | Noise dominated (total time) | Noise dominated (detector-on time) | Marked lightcurve |
|---|---|---|---|---|---|---|---|
| A | 5112 | 4378 | 1 | 1 | 0.02% | 0.02% | 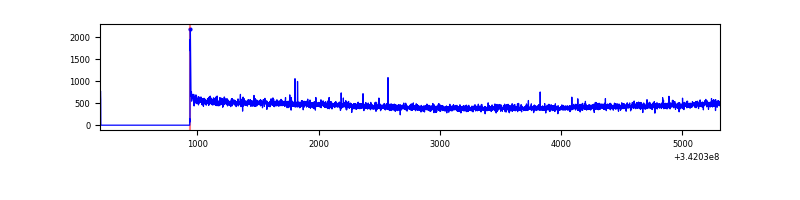 |
| B | 5113 | 4379 | 1 | 1 | 0.02% | 0.02% | 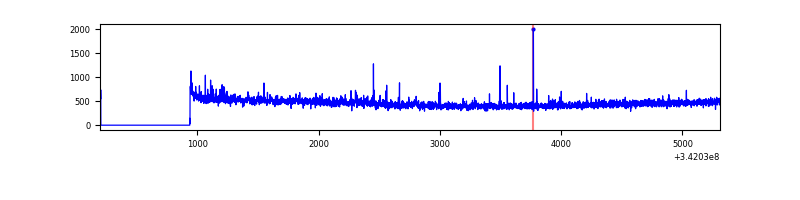 |
| C | 5113 | 4379 | 5 | 5 | 0.10% | 0.11% | 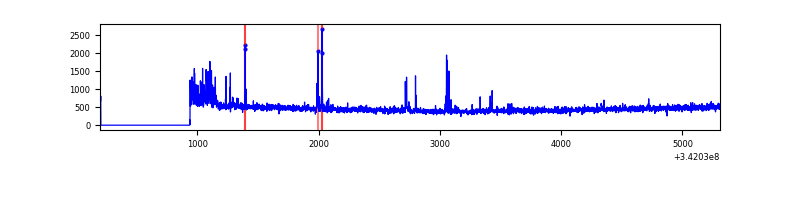 |
| D | 5113 | 4379 | 84 | 84 | 1.64% | 1.92% | 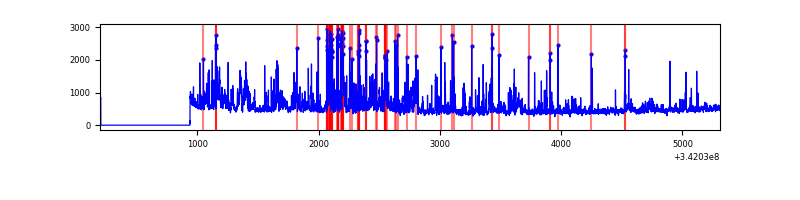 |
Top three noisy pixels from each quadrant. If the there are fewer than three noisy pixels in the level2.evt file, extra rows are filled as -1
| Pixel properties | Quadrant properties | ||||||
|---|---|---|---|---|---|---|---|
| Quadrant | DetID | PixID | Counts | Sigma | Mean | Median | Sigma |
| A | 8 | 192 | 9244 | 86.66 | 497 | 487 | 101.0 |
| A | 13 | 254 | 7591 | 70.31 | 497 | 487 | 101.0 |
| A | 3 | 137 | 4808 | 42.76 | 497 | 487 | 101.0 |
| B | 15 | 32 | 17829 | 180.48 | 498 | 486 | 96.1 |
| B | 10 | 245 | 14061 | 141.27 | 498 | 486 | 96.1 |
| B | 12 | 111 | 11766 | 117.38 | 498 | 486 | 96.1 |
| C | 15 | 208 | 98720 | 878.77 | 474 | 475 | 111.8 |
| C | 14 | 238 | 77360 | 687.71 | 474 | 475 | 111.8 |
| C | 2 | 16 | 17653 | 153.65 | 474 | 475 | 111.8 |
| D | 1 | 52 | 732084 | 6435.89 | 470 | 456 | 113.7 |
| D | 2 | 250 | 47083 | 410.16 | 470 | 456 | 113.7 |
| D | 12 | 233 | 32450 | 281.44 | 470 | 456 | 113.7 |
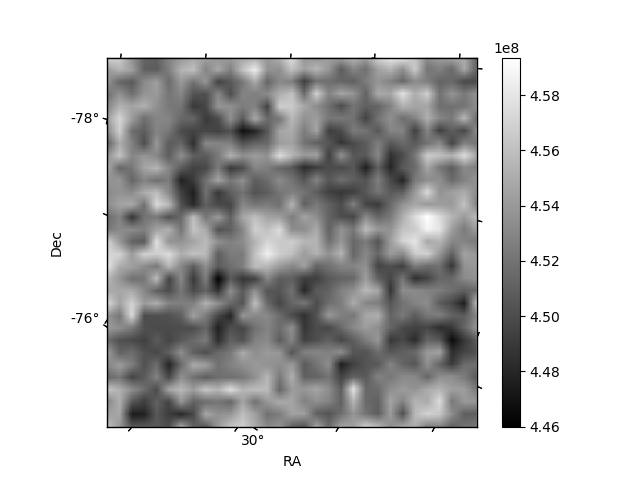
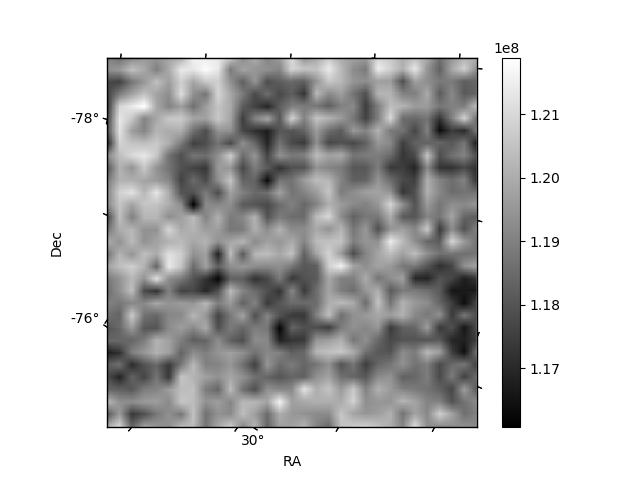
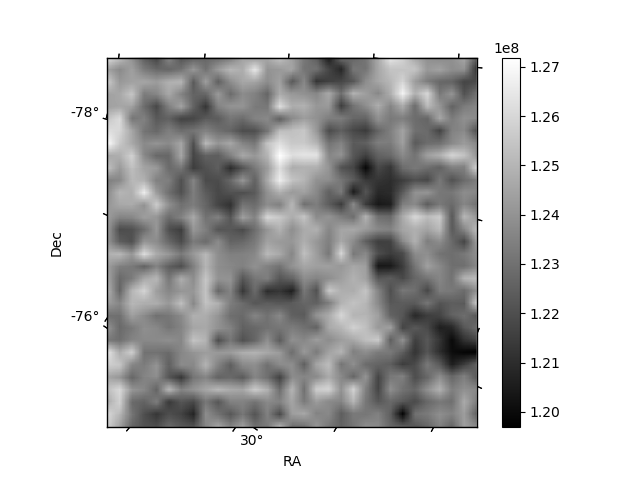
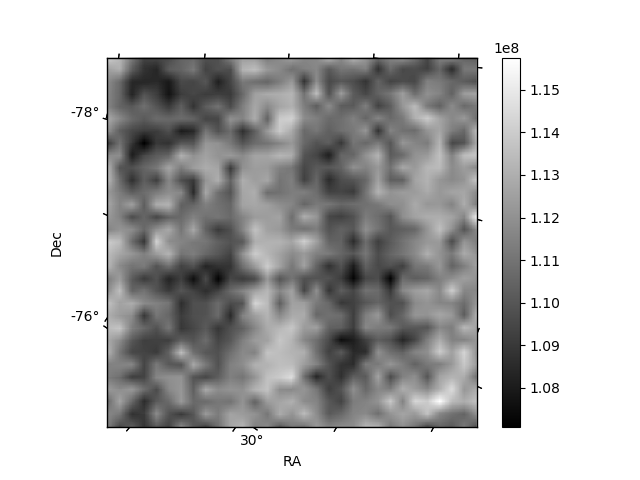
Histogram calculated using DETX and DETY for each event in the final _common_clean file
| Quadrant A | 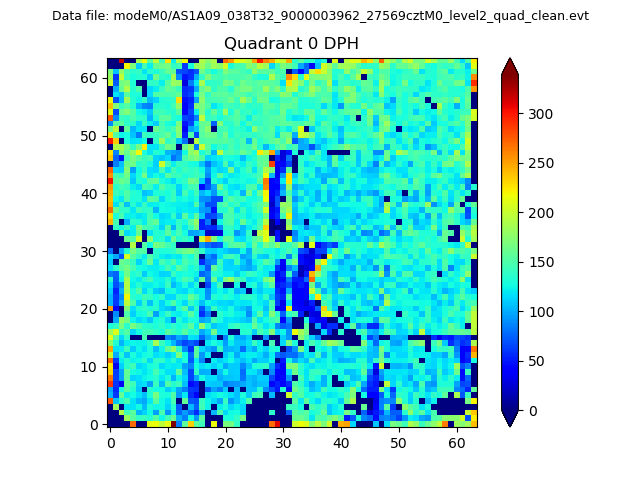 |
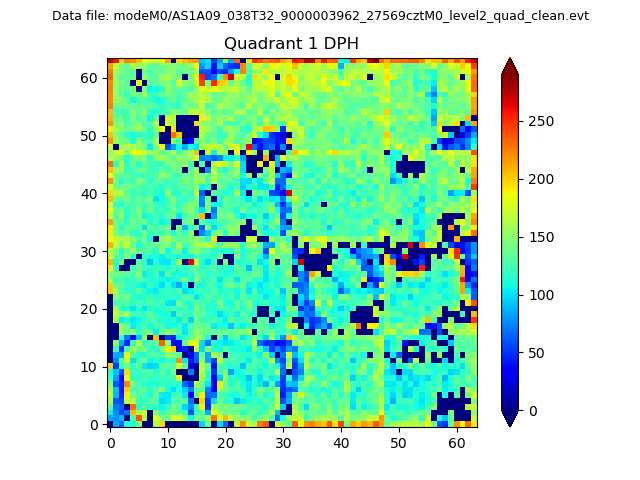 |
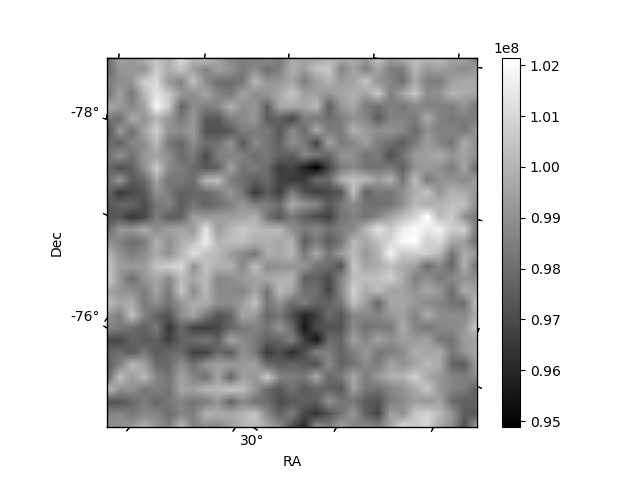
Quadrant B |
|---|---|---|---|
| Quadrant D | 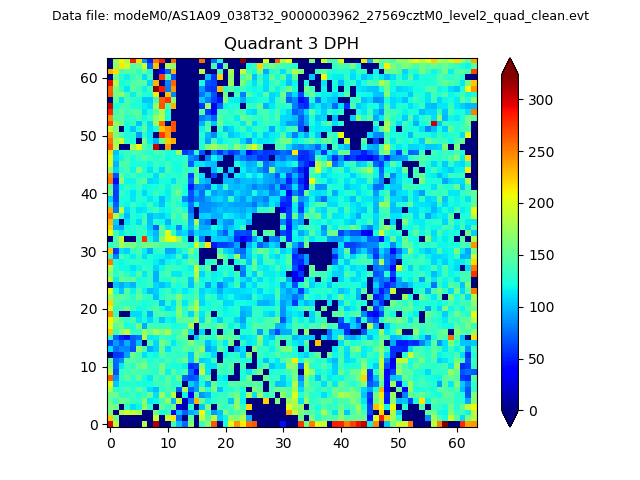 |
 |
Quadrant C |
| Plot type | Count rate plots | Images |
|---|---|---|
| Comparison with Poisson distribution Blue bars denote a histogram of data divided into 1 sec bins. Red curve is a Poisson curve with rate = median count rate of data. |
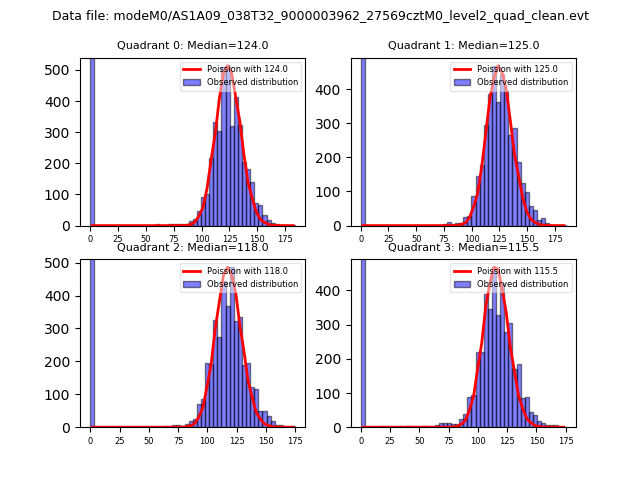 |
 |
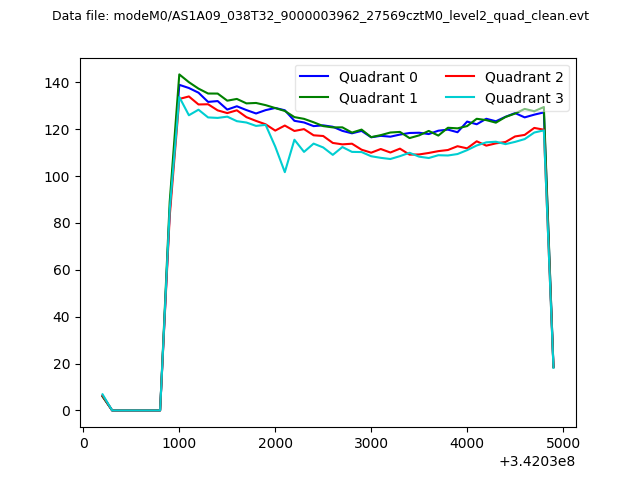
| Quadrant-wise count rates Data is divided into 100 sec bins |
 |
|
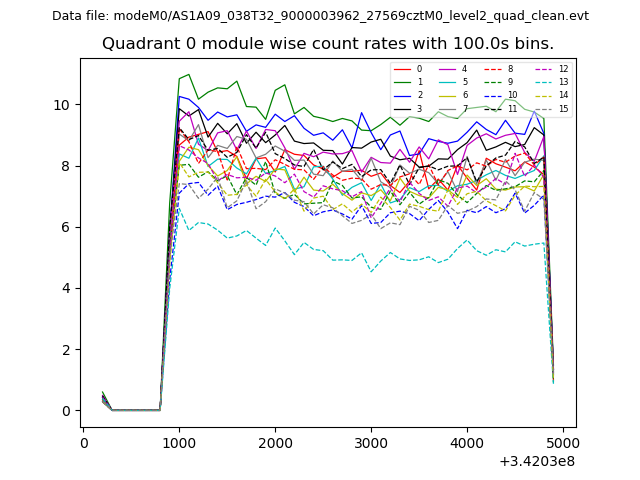
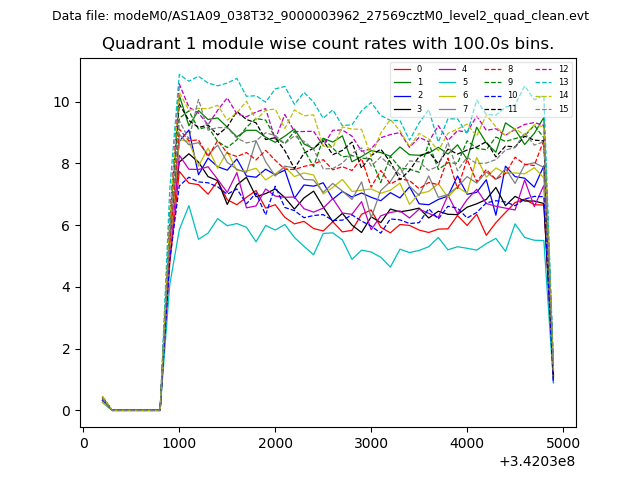
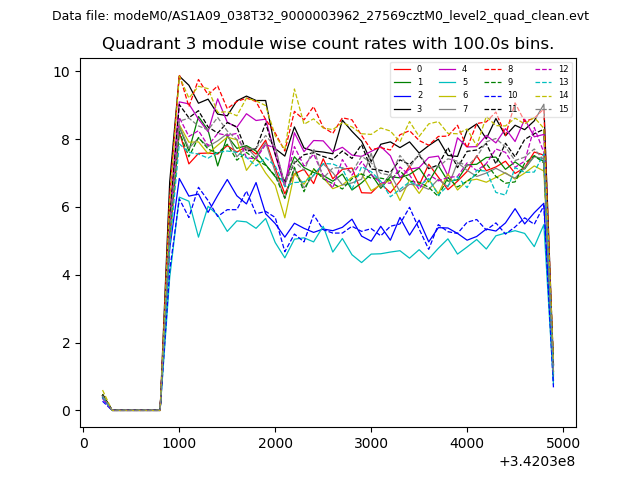
| Module-wise count rates for Quadrant A Data is divided into 100 sec bins |
 |
 |
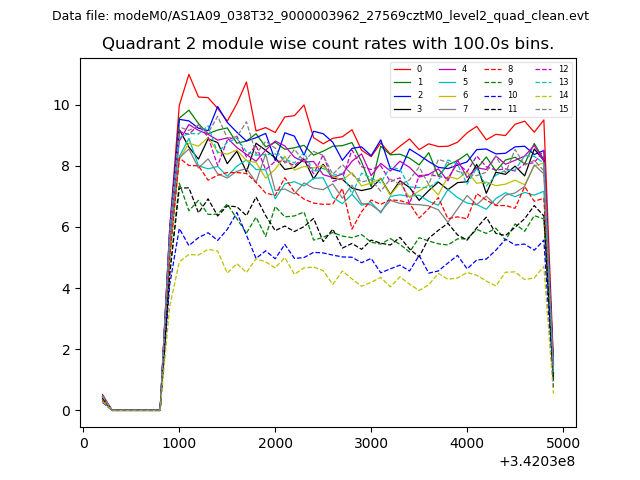
| Module-wise count rates for Quadrant B Data is divided into 100 sec bins |
 |
 |
| Module-wise count rates for Quadrant C Data is divided into 100 sec bins |
 |
 |
| Module-wise count rates for Quadrant D Data is divided into 100 sec bins |
 |
 |
| Parameter | Plot |
|---|---|
| CZT HV Monitor | 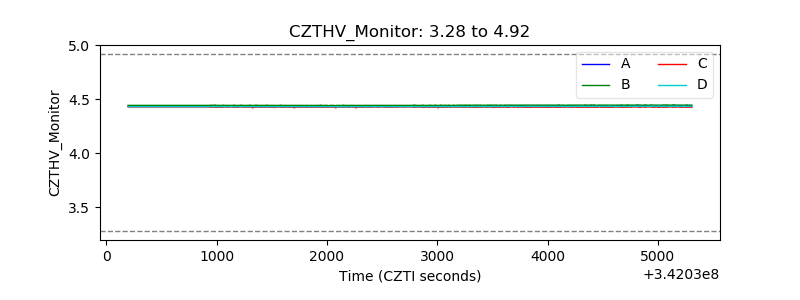 |
| D_VDD | 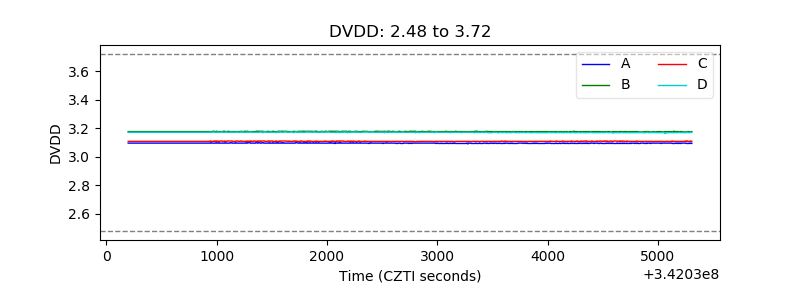 |
| Temperature 1 | 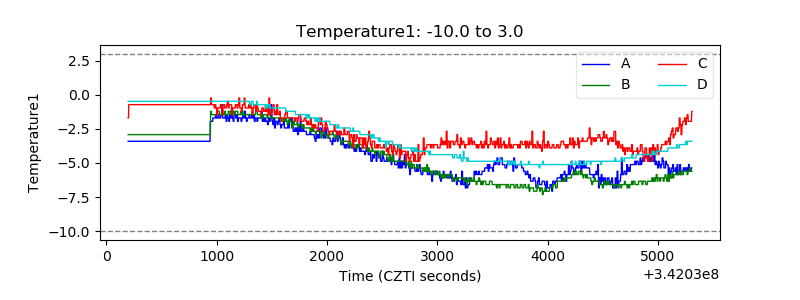 |
| Veto HV Monitor | 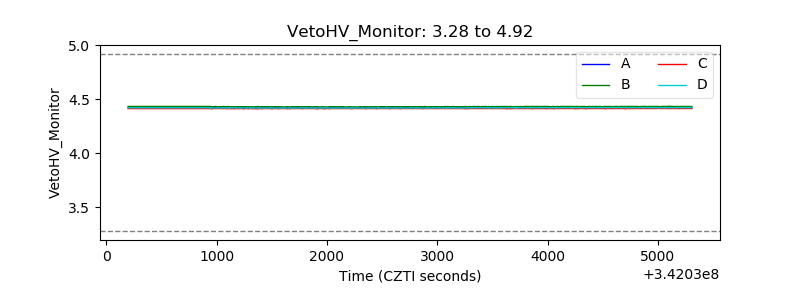 |
| Veto LLD | 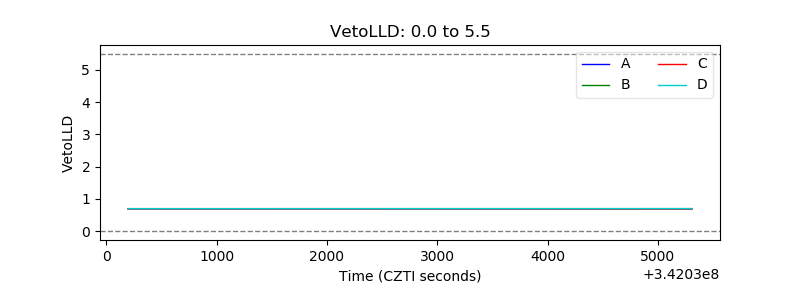 |
| Alpha Counter | 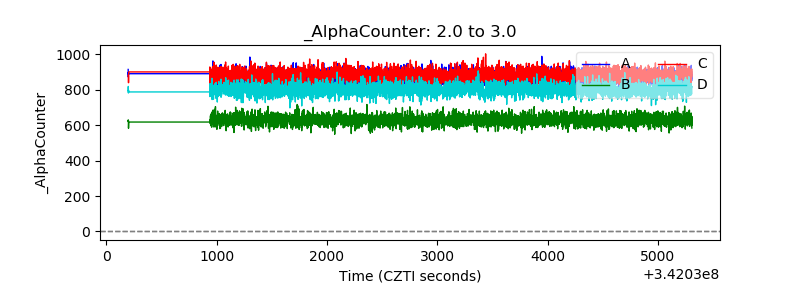 |
| _CPM_Rate | 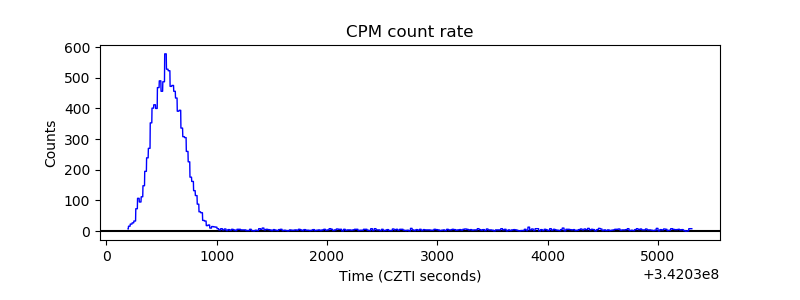 |
| CZT Counter | 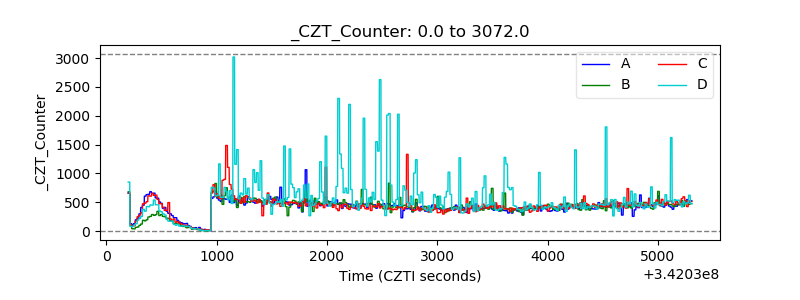 |
| +2.5 Volts monitor |  |
| +5 Volts monitor | 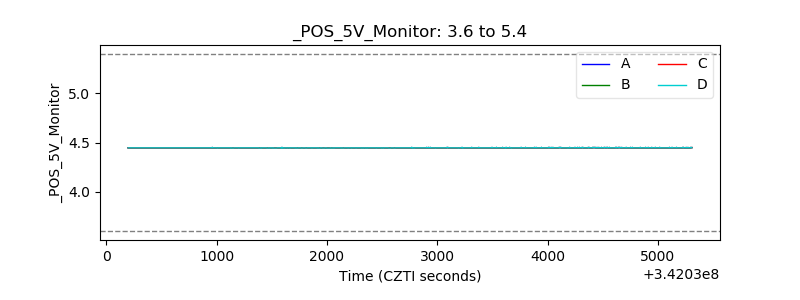 |
| _ROLL_ROT | 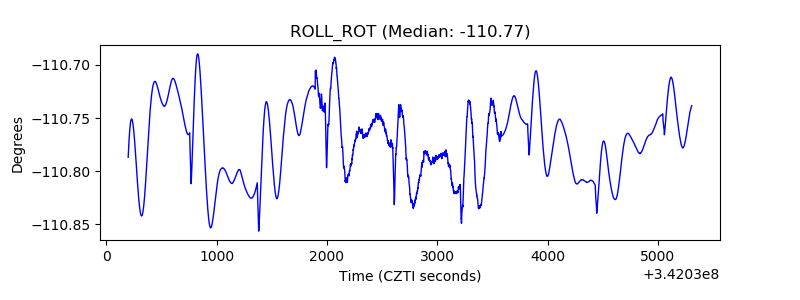 |
| _Roll_DEC |  |
| _Roll_RA | 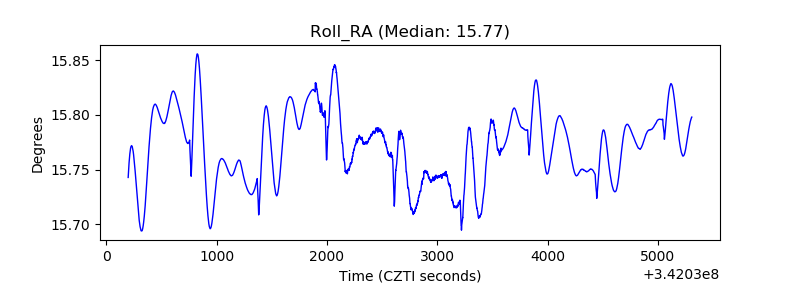 |
| Veto Counter | 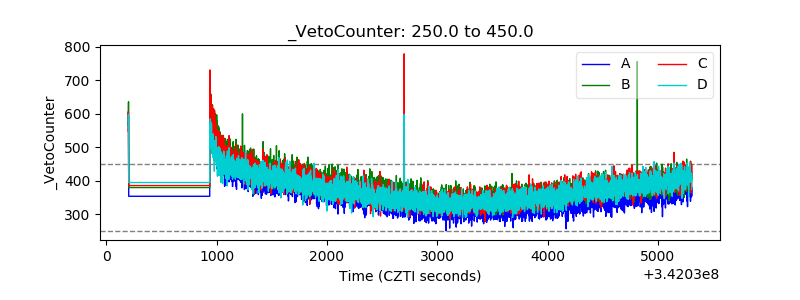 |