| Param | Original file | Final file |
|---|---|---|
| Filename | modeM0/AS1A09_038T33_9000003970cztM0_level2.fits | modeM0/AS1A09_038T33_9000003970cztM0_level2_quad_clean.evt |
| Size (bytes) | 95,731,200 | 47,687,040 |
| Size | 91.3 MB | 45.5 MB |
| Events in quadrant A | 604,268 | 221,951 |
| Events in quadrant B | 589,166 | 226,898 |
| Events in quadrant C | 605,568 | 212,877 |
| Events in quadrant D | 499,104 | 179,178 |
| Mode M9 | |||
|---|---|---|---|
| Quadrant | BADHDUFLAG | Total packets | Discarded packets |
| A | 0 | 27 | 0 |
| B | 0 | 27 | 0 |
| C | 0 | 27 | 0 |
| D | 0 | 27 | 0 |
| Mode M0 | |||
|---|---|---|---|
| Quadrant | BADHDUFLAG | Total packets | Discarded packets |
| A | 0 | 18258 | 0 |
| B | 0 | 18915 | 0 |
| C | 0 | 18801 | 0 |
| D | 0 | 28309 | 0 |
| Mode SS | |||
|---|---|---|---|
| Quadrant | BADHDUFLAG | Total packets | Discarded packets |
| A | 0 | 178 | 0 |
| B | 0 | 178 | 0 |
| C | 0 | 178 | 0 |
| D | 0 | 178 | 0 |
| Quadrant | Total seconds | Saturated seconds | Saturation percentage |
|---|---|---|---|
| A | 8663 | 26 | 0.300127% |
| B | 8663 | 48 | 0.554081% |
| C | 8663 | 86 | 0.992728% |
| D | 8663 | 734 | 8.472815% |
Noise dominated data is calculated using 1-second bins in cleaned event files. If a bin has >2000 counts, and if more than 50% of those come from <1% of pixels, then it is considered to be noise-dominated and hence unusable.
| Quadrant | # 1 sec bins | Bins with >0 counts | Bins with >2000 counts | High rate bins dominated by noise | Noise dominated (total time) | Noise dominated (detector-on time) | Marked lightcurve |
|---|---|---|---|---|---|---|---|
| A | 11347 | 8661 | 0 | 0 | 0.00% | 0.00% |  |
| B | 11348 | 8663 | 0 | 0 | 0.00% | 0.00% | 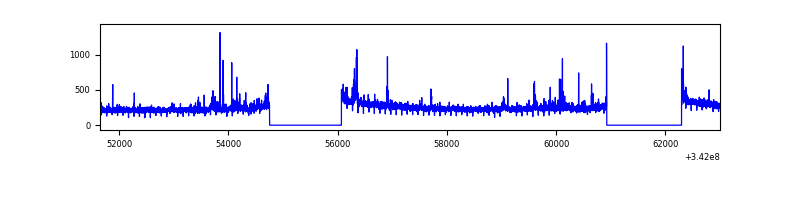 |
| C | 11348 | 8663 | 0 | 0 | 0.00% | 0.00% |  |
| D | 11348 | 8628 | 0 | 0 | 0.00% | 0.00% |  |
Top three noisy pixels from each quadrant. If the there are fewer than three noisy pixels in the level2.evt file, extra rows are filled as -1
| Pixel properties | Quadrant properties | ||||||
|---|---|---|---|---|---|---|---|
| Quadrant | DetID | PixID | Counts | Sigma | Mean | Median | Sigma |
| A | 0 | 29 | 537 | 9.68 | 157 | 149 | 40.1 |
| A | 7 | 110 | 476 | 8.16 | 157 | 149 | 40.1 |
| A | 9 | 239 | 450 | 7.51 | 157 | 149 | 40.1 |
| B | 2 | 9 | 474 | 9.86 | 156 | 150 | 32.9 |
| B | 5 | 128 | 404 | 7.73 | 156 | 150 | 32.9 |
| B | 2 | 8 | 394 | 7.42 | 156 | 150 | 32.9 |
| C | 9 | 209 | 451 | 7.07 | 160 | 152 | 42.3 |
| C | 9 | 233 | 411 | 6.12 | 160 | 152 | 42.3 |
| C | 3 | 126 | 410 | 6.1 | 160 | 152 | 42.3 |
| D | 10 | 189 | 369 | 6.23 | 142 | 130 | 38.4 |
| D | 3 | 14 | 363 | 6.07 | 142 | 130 | 38.4 |
| D | 15 | 46 | 351 | 5.76 | 142 | 130 | 38.4 |
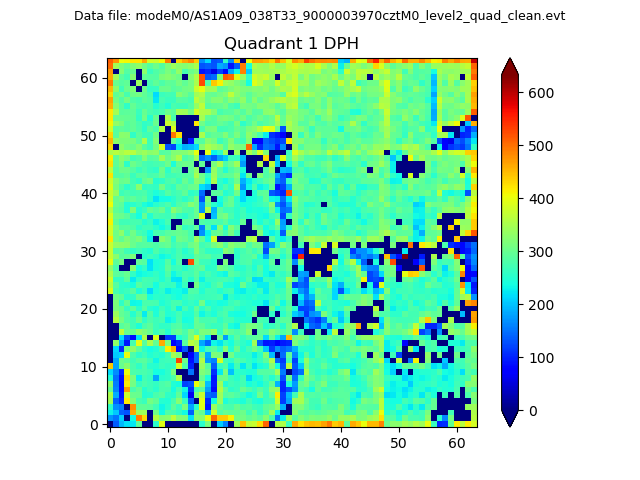
Histogram calculated using DETX and DETY for each event in the final _common_clean file
| Quadrant A |  |
 |
Quadrant B |
|---|---|---|---|
| Quadrant D | 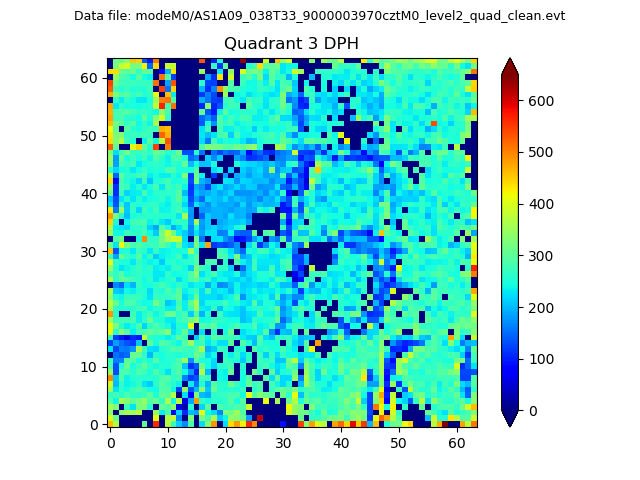 |
 |
Quadrant C |
| Plot type | Count rate plots | Images |
|---|---|---|
| Comparison with Poisson distribution Blue bars denote a histogram of data divided into 1 sec bins. Red curve is a Poisson curve with rate = median count rate of data. |
 |
 |
| Quadrant-wise count rates Data is divided into 100 sec bins |
 |
|
| Module-wise count rates for Quadrant A Data is divided into 100 sec bins |
 |
 |
| Module-wise count rates for Quadrant B Data is divided into 100 sec bins |
 |
 |
| Module-wise count rates for Quadrant C Data is divided into 100 sec bins |
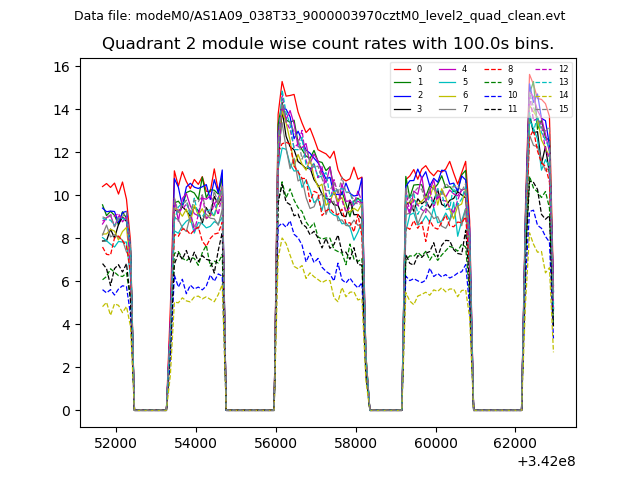 |
 |
| Module-wise count rates for Quadrant D Data is divided into 100 sec bins |
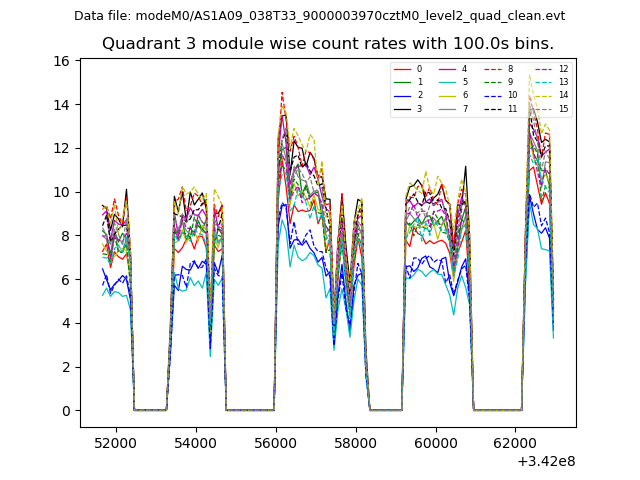 |
 |
| Parameter | Plot |
|---|---|
| CZT HV Monitor |  |
| D_VDD |  |
| Temperature 1 |  |
| Veto HV Monitor |  |
| Veto LLD |  |
| Alpha Counter |  |
| _CPM_Rate | 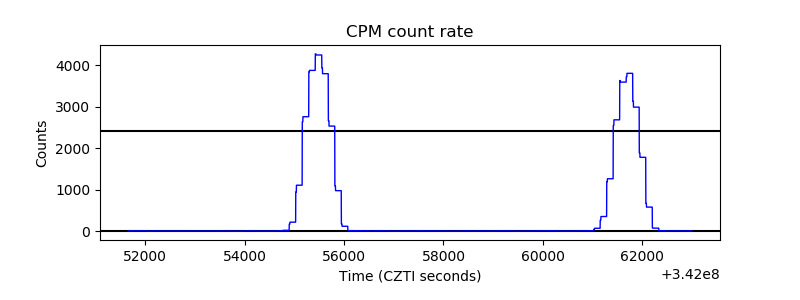 |
| CZT Counter |  |
| +2.5 Volts monitor | 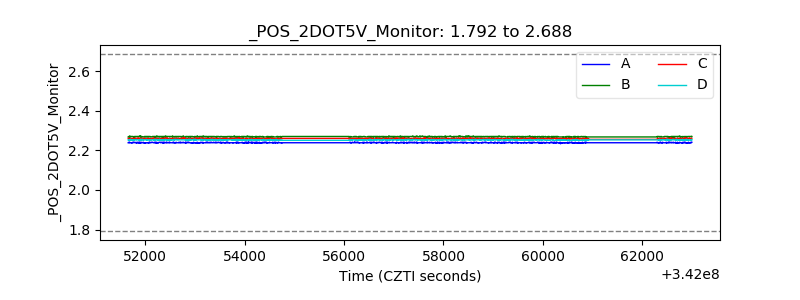 |
| +5 Volts monitor |  |
| _ROLL_ROT | 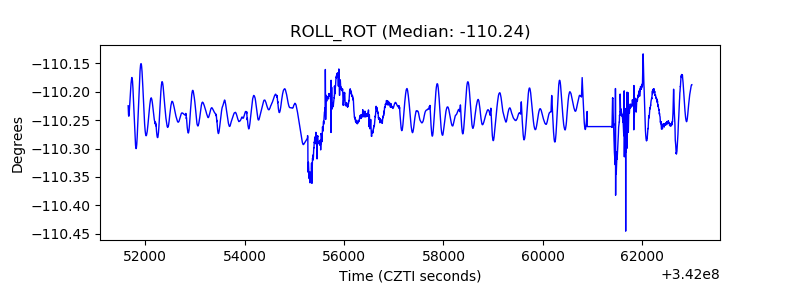 |
| _Roll_DEC | 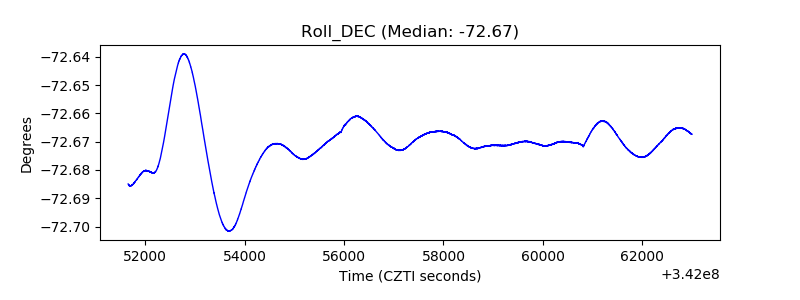 |
| _Roll_RA |  |
| Veto Counter |  |