| Param | Original file | Final file |
|---|---|---|
| Filename | modeM0/AS1A09_038T33_9000003970_27575cztM0_level2.evt | modeM0/AS1A09_038T33_9000003970_27575cztM0_level2_quad_clean.evt |
| Size (bytes) | 715,584,960 | 153,319,680 |
| Size | 682.4 MB | 146.2 MB |
| Events in quadrant A | 4,372,093 | 1,027,859 |
| Events in quadrant B | 4,594,934 | 1,068,893 |
| Events in quadrant C | 4,597,091 | 1,023,380 |
| Events in quadrant D | 7,521,318 | 922,012 |
| Mode M9 | |||
|---|---|---|---|
| Quadrant | BADHDUFLAG | Total packets | Discarded packets |
| A | 0 | 27 | 0 |
| B | 0 | 27 | 0 |
| C | 0 | 27 | 0 |
| D | 0 | 27 | 0 |
| Mode M0 | |||
|---|---|---|---|
| Quadrant | BADHDUFLAG | Total packets | Discarded packets |
| A | 0 | 18258 | 0 |
| B | 0 | 18915 | 0 |
| C | 0 | 18801 | 0 |
| D | 0 | 28309 | 0 |
| Quadrant | Total seconds | Saturated seconds | Saturation percentage |
|---|---|---|---|
| A | 8663 | 26 | 0.300127% |
| B | 8663 | 48 | 0.554081% |
| C | 8663 | 86 | 0.992728% |
| D | 8663 | 734 | 8.472815% |
Noise dominated data is calculated using 1-second bins in cleaned event files. If a bin has >2000 counts, and if more than 50% of those come from <1% of pixels, then it is considered to be noise-dominated and hence unusable.
| Quadrant | # 1 sec bins | Bins with >0 counts | Bins with >2000 counts | High rate bins dominated by noise | Noise dominated (total time) | Noise dominated (detector-on time) | Marked lightcurve |
|---|---|---|---|---|---|---|---|
| A | 11348 | 8665 | 3 | 3 | 0.03% | 0.03% | 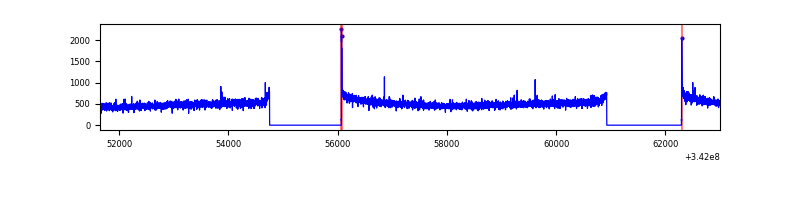 |
| B | 11348 | 8665 | 3 | 3 | 0.03% | 0.03% | 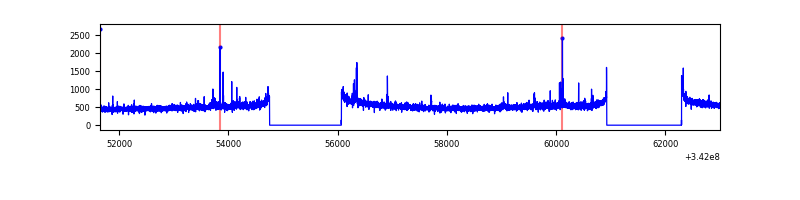 |
| C | 11348 | 8665 | 2 | 2 | 0.02% | 0.02% | 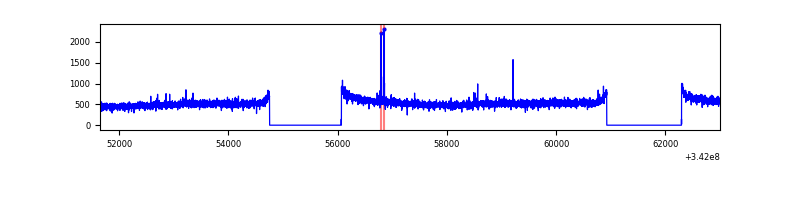 |
| D | 11348 | 8665 | 676 | 676 | 5.96% | 7.80% | 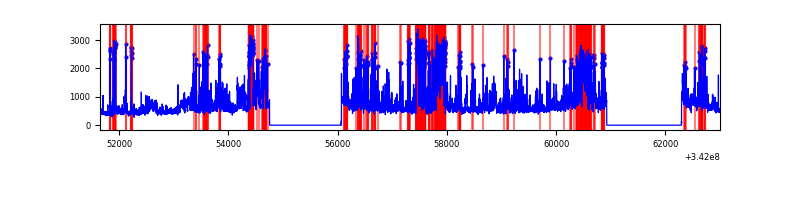 |
Top three noisy pixels from each quadrant. If the there are fewer than three noisy pixels in the level2.evt file, extra rows are filled as -1
| Pixel properties | Quadrant properties | ||||||
|---|---|---|---|---|---|---|---|
| Quadrant | DetID | PixID | Counts | Sigma | Mean | Median | Sigma |
| A | 8 | 192 | 15723 | 65.0 | 1129 | 1110 | 224.8 |
| A | 13 | 254 | 14500 | 59.56 | 1129 | 1110 | 224.8 |
| A | 3 | 137 | 9908 | 39.13 | 1129 | 1110 | 224.8 |
| B | 3 | 64 | 34037 | 158.58 | 1138 | 1113 | 207.6 |
| B | 0 | 230 | 31147 | 144.66 | 1138 | 1113 | 207.6 |
| B | 4 | 52 | 26568 | 122.61 | 1138 | 1113 | 207.6 |
| C | 14 | 238 | 181714 | 704.68 | 1114 | 1121 | 256.3 |
| C | 10 | 22 | 22525 | 83.52 | 1114 | 1121 | 256.3 |
| C | 14 | 67 | 16184 | 58.78 | 1114 | 1121 | 256.3 |
| D | 1 | 52 | 2053044 | 8296.25 | 1063 | 1035 | 247.3 |
| D | 6 | 112 | 971790 | 3924.75 | 1063 | 1035 | 247.3 |
| D | 7 | 80 | 346057 | 1394.92 | 1063 | 1035 | 247.3 |
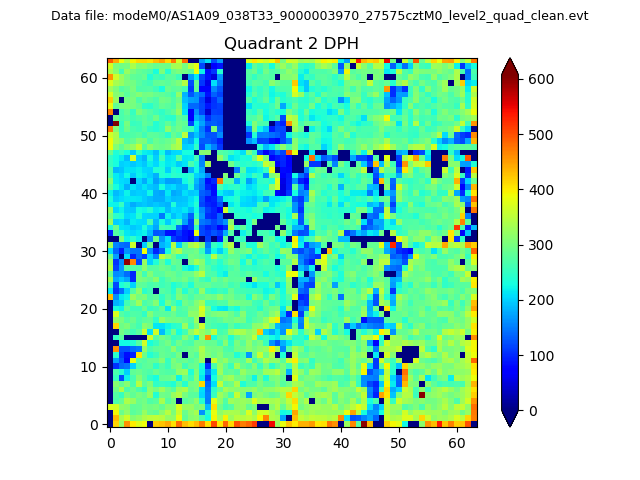
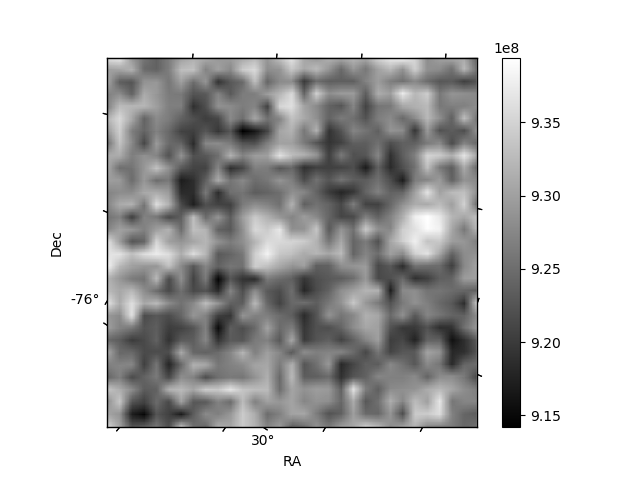
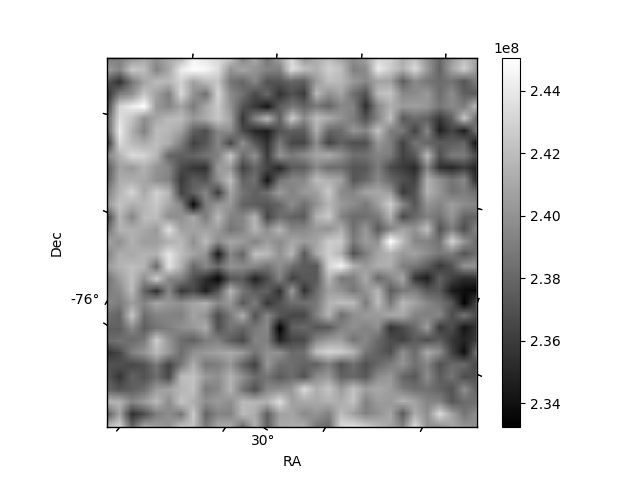
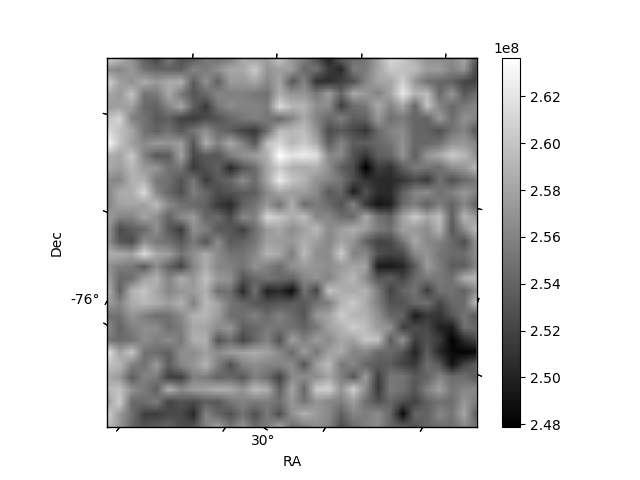
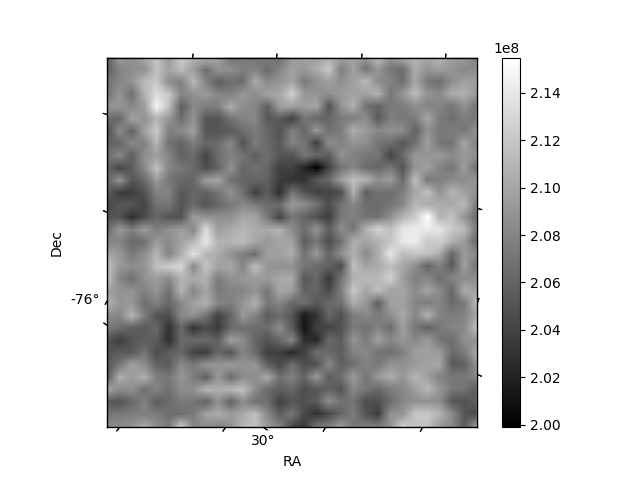
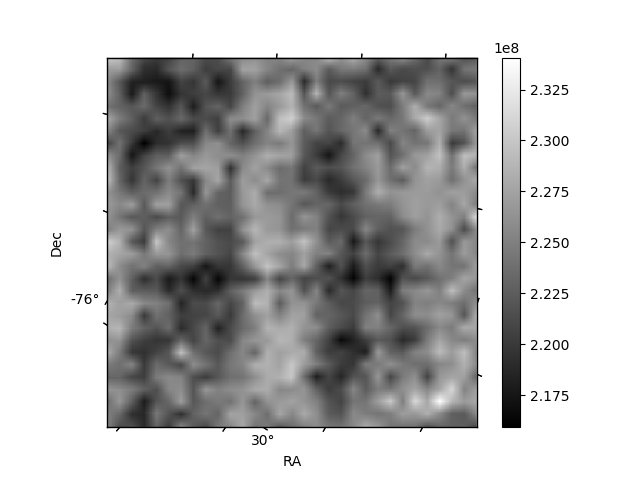
Histogram calculated using DETX and DETY for each event in the final _common_clean file
| Quadrant A | 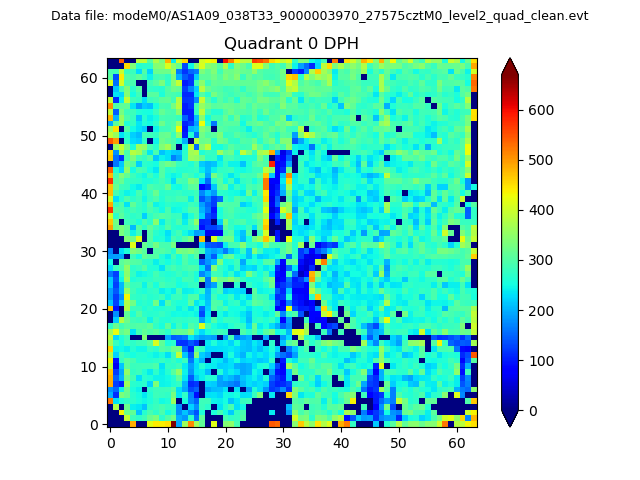 |
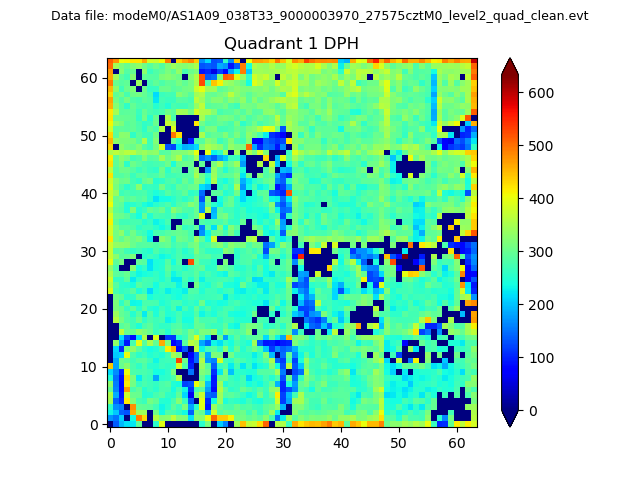 |
Quadrant B |
|---|---|---|---|
| Quadrant D | 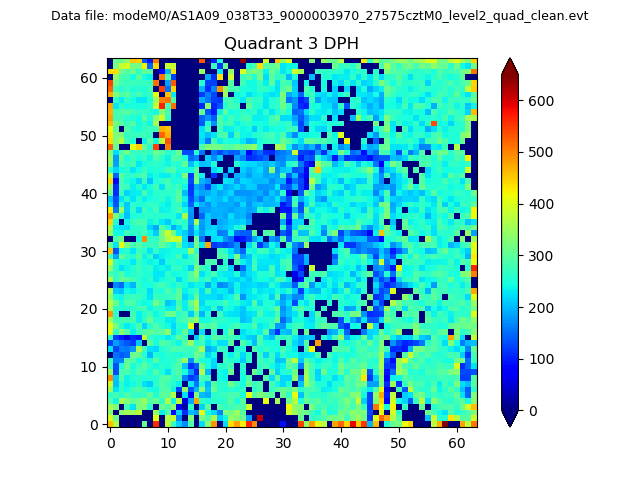 |
 |
Quadrant C |
| Plot type | Count rate plots | Images |
|---|---|---|
| Comparison with Poisson distribution Blue bars denote a histogram of data divided into 1 sec bins. Red curve is a Poisson curve with rate = median count rate of data. |
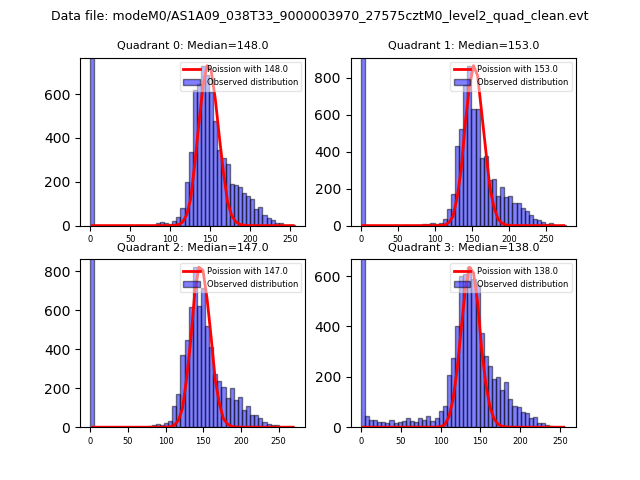 |
 |
| Quadrant-wise count rates Data is divided into 100 sec bins |
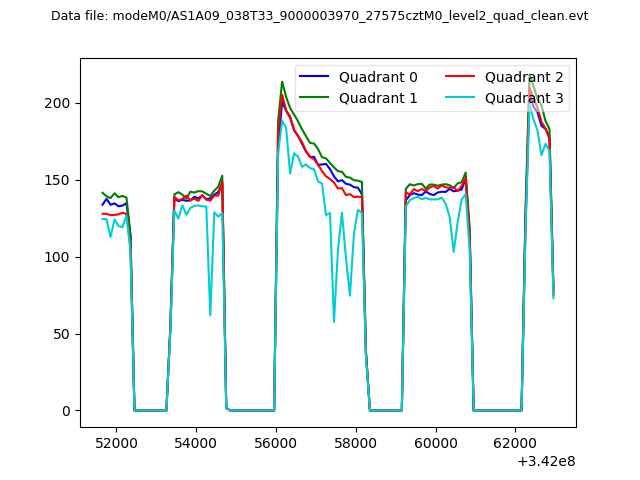 |
|
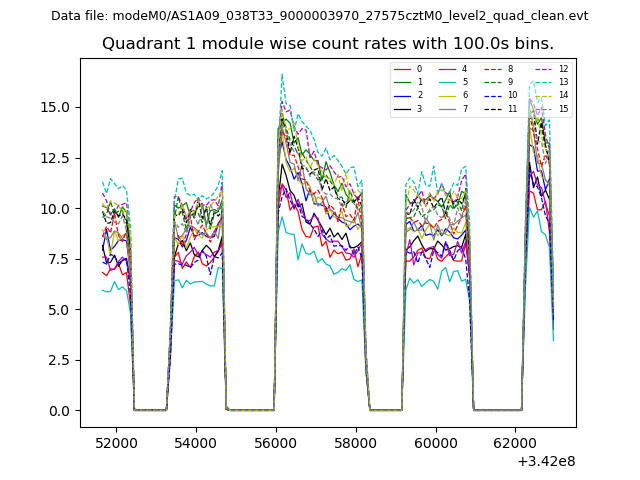
| Module-wise count rates for Quadrant A Data is divided into 100 sec bins |
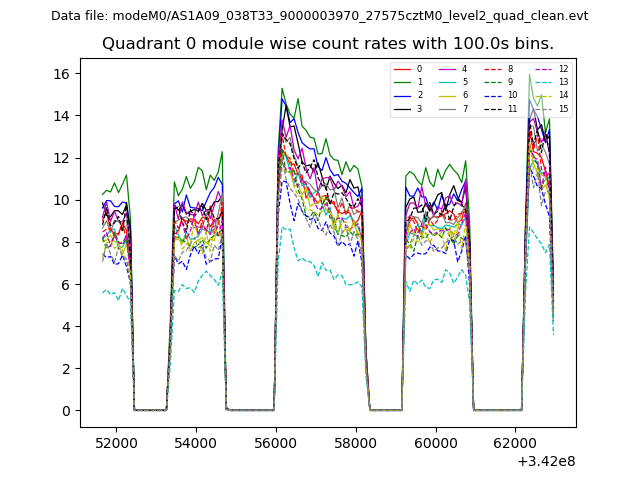 |
 |
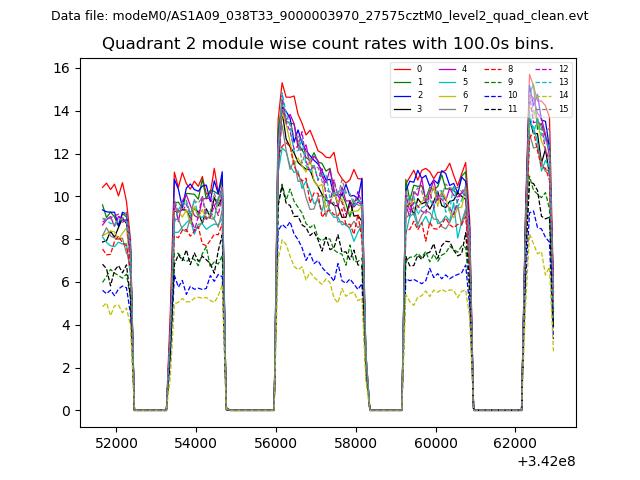
| Module-wise count rates for Quadrant B Data is divided into 100 sec bins |
 |
 |
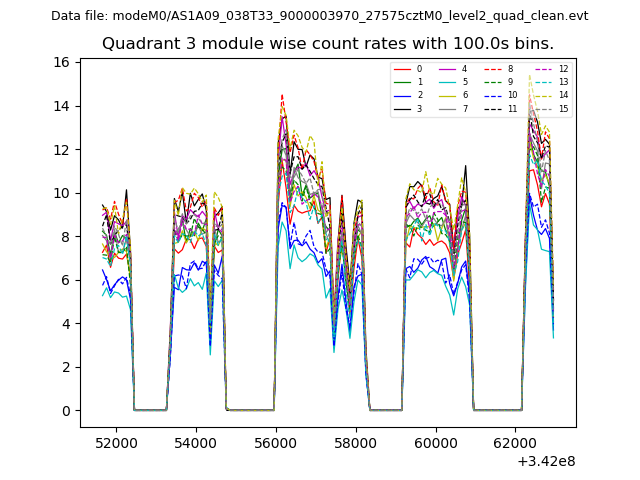
| Module-wise count rates for Quadrant C Data is divided into 100 sec bins |
 |
 |
| Module-wise count rates for Quadrant D Data is divided into 100 sec bins |
 |
 |
| Parameter | Plot |
|---|---|
| CZT HV Monitor | 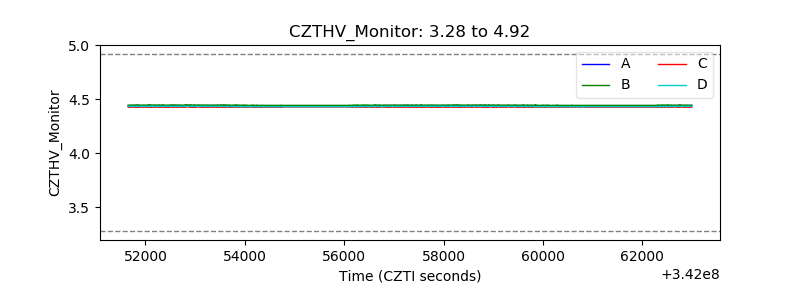 |
| D_VDD | 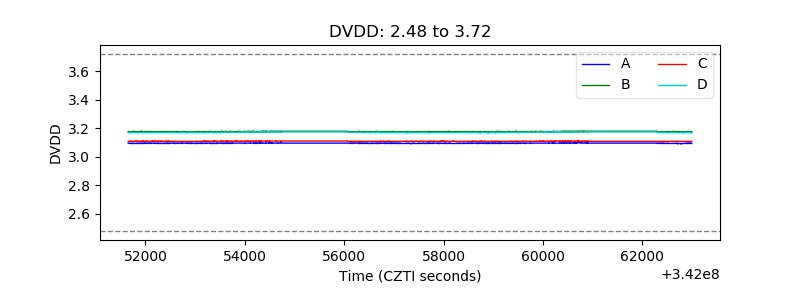 |
| Temperature 1 | 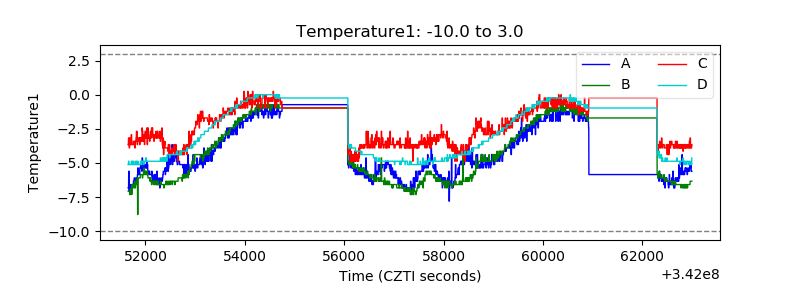 |
| Veto HV Monitor | 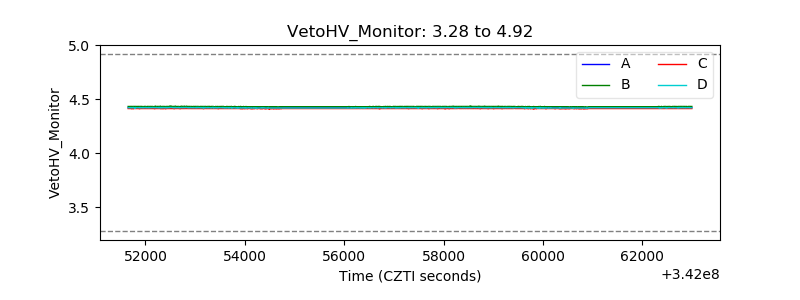 |
| Veto LLD | 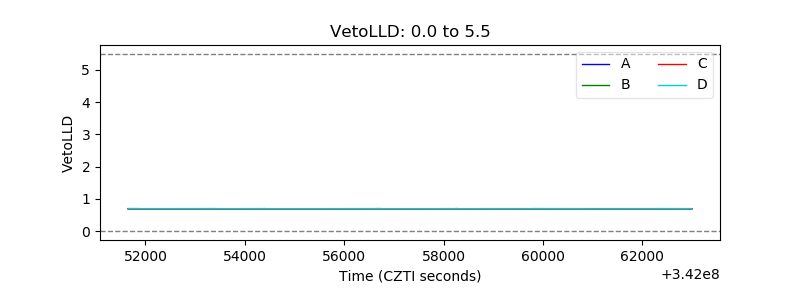 |
| Alpha Counter | 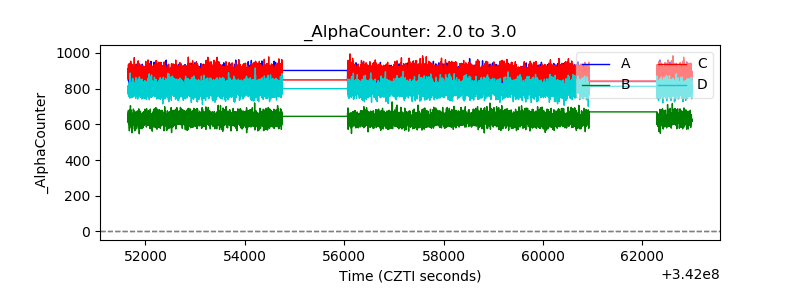 |
| _CPM_Rate |  |
| CZT Counter | 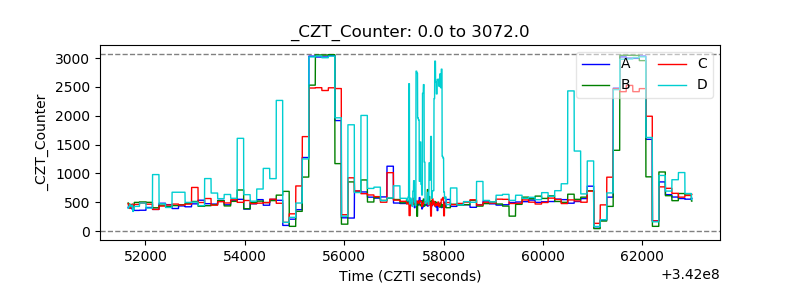 |
| +2.5 Volts monitor |  |
| +5 Volts monitor |  |
| _ROLL_ROT | 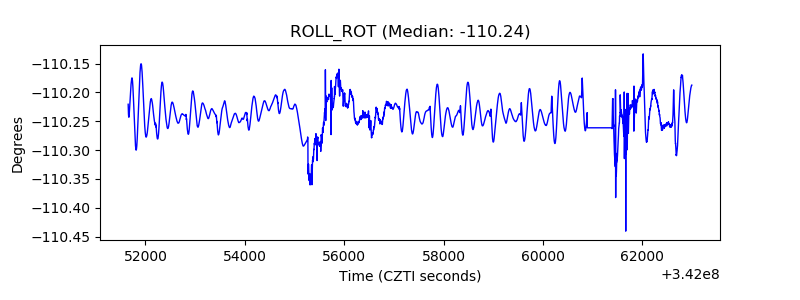 |
| _Roll_DEC | 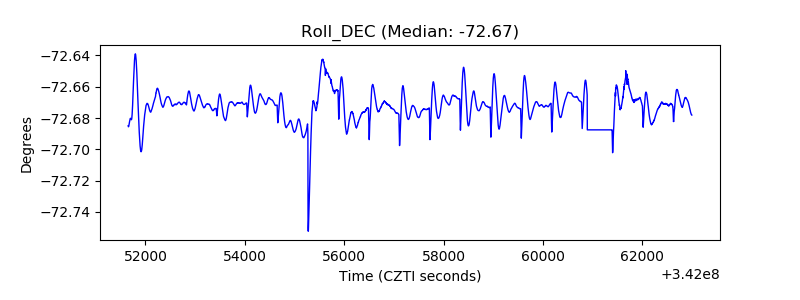 |
| _Roll_RA | 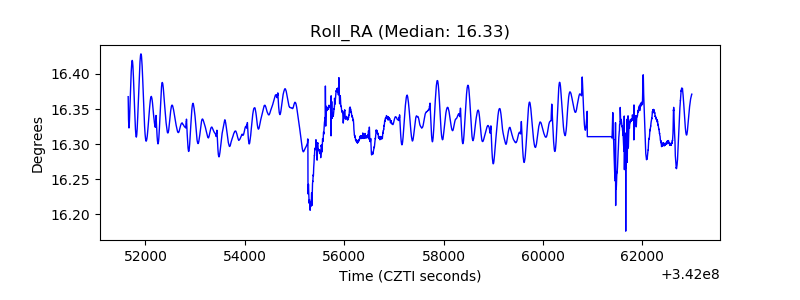 |
| Veto Counter | 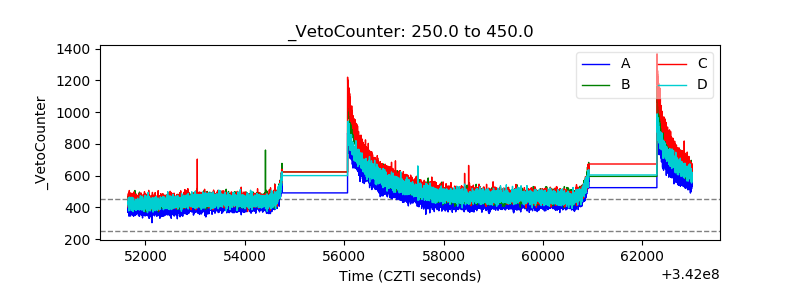 |