| Param | Original file | Final file |
|---|---|---|
| Filename | modeM0/AS1C05_019T04_9000003974cztM0_level2.fits | modeM0/AS1C05_019T04_9000003974cztM0_level2_quad_clean.evt |
| Size (bytes) | 461,206,080 | 515,655,360 |
| Size | 439.8 MB | 491.8 MB |
| Events in quadrant A | 2,872,972 | 3,262,522 |
| Events in quadrant B | 2,753,656 | 3,279,660 |
| Events in quadrant C | 2,793,314 | 3,147,324 |
| Events in quadrant D | 2,365,792 | 2,746,183 |
| Mode SS | |||
|---|---|---|---|
| Quadrant | BADHDUFLAG | Total packets | Discarded packets |
| A | 0 | 874 | 0 |
| B | 0 | 874 | 0 |
| C | 0 | 874 | 0 |
| D | 0 | 874 | 0 |
| Mode M9 | |||
|---|---|---|---|
| Quadrant | BADHDUFLAG | Total packets | Discarded packets |
| A | 0 | 92 | 0 |
| B | 0 | 92 | 0 |
| C | 0 | 92 | 0 |
| D | 0 | 92 | 0 |
| Mode M0 | |||
|---|---|---|---|
| Quadrant | BADHDUFLAG | Total packets | Discarded packets |
| A | 0 | 96205 | 0 |
| B | 0 | 99835 | 0 |
| C | 0 | 98004 | 0 |
| D | 0 | 124809 | 0 |
| Quadrant | Total seconds | Saturated seconds | Saturation percentage |
|---|---|---|---|
| A | 46593 | 343 | 0.736162% |
| B | 46593 | 509 | 1.092439% |
| C | 46593 | 704 | 1.510957% |
| D | 46593 | 2695 | 5.784131% |
Noise dominated data is calculated using 1-second bins in cleaned event files. If a bin has >2000 counts, and if more than 50% of those come from <1% of pixels, then it is considered to be noise-dominated and hence unusable.
| Quadrant | # 1 sec bins | Bins with >0 counts | Bins with >2000 counts | High rate bins dominated by noise | Noise dominated (total time) | Noise dominated (detector-on time) | Marked lightcurve |
|---|---|---|---|---|---|---|---|
| A | 55974 | 46588 | 0 | 0 | 0.00% | 0.00% |  |
| B | 55974 | 46592 | 0 | 0 | 0.00% | 0.00% | 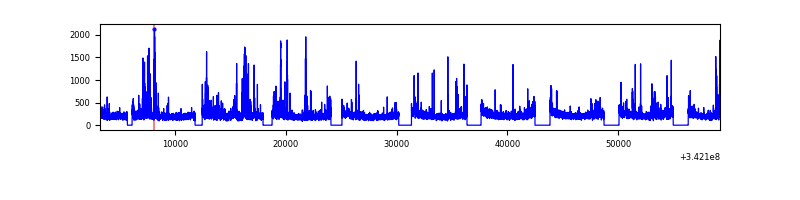 |
| C | 55974 | 46590 | 0 | 0 | 0.00% | 0.00% |  |
| D | 55974 | 45906 | 0 | 0 | 0.00% | 0.00% |  |
Top three noisy pixels from each quadrant. If the there are fewer than three noisy pixels in the level2.evt file, extra rows are filled as -1
| Pixel properties | Quadrant properties | ||||||
|---|---|---|---|---|---|---|---|
| Quadrant | DetID | PixID | Counts | Sigma | Mean | Median | Sigma |
| A | 0 | 29 | 2803 | 11.33 | 748 | 704 | 185.3 |
| A | 7 | 110 | 2277 | 8.49 | 748 | 704 | 185.3 |
| A | 0 | 30 | 2177 | 7.95 | 748 | 704 | 185.3 |
| B | 2 | 9 | 2232 | 10.64 | 729 | 698 | 144.2 |
| B | 5 | 128 | 1851 | 8.0 | 729 | 698 | 144.2 |
| B | 2 | 8 | 1838 | 7.91 | 729 | 698 | 144.2 |
| C | 12 | 241 | 1938 | 6.66 | 738 | 693 | 187.0 |
| C | 3 | 126 | 1910 | 6.51 | 738 | 693 | 187.0 |
| C | 9 | 209 | 1870 | 6.3 | 738 | 693 | 187.0 |
| D | 15 | 46 | 1742 | 6.23 | 675 | 615 | 180.8 |
| D | 6 | 67 | 1741 | 6.23 | 675 | 615 | 180.8 |
| D | 10 | 189 | 1683 | 5.91 | 675 | 615 | 180.8 |
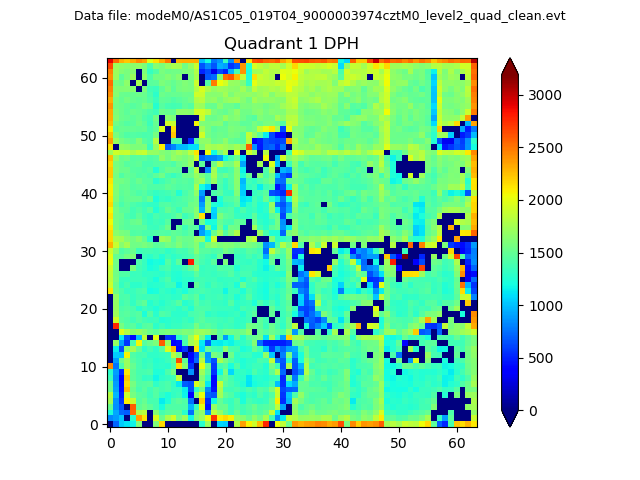
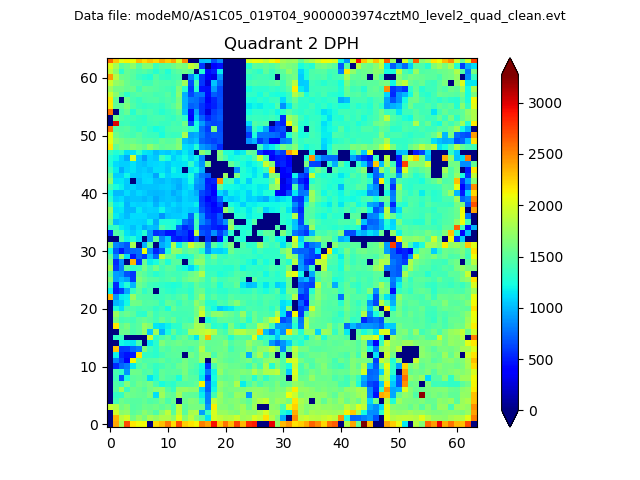
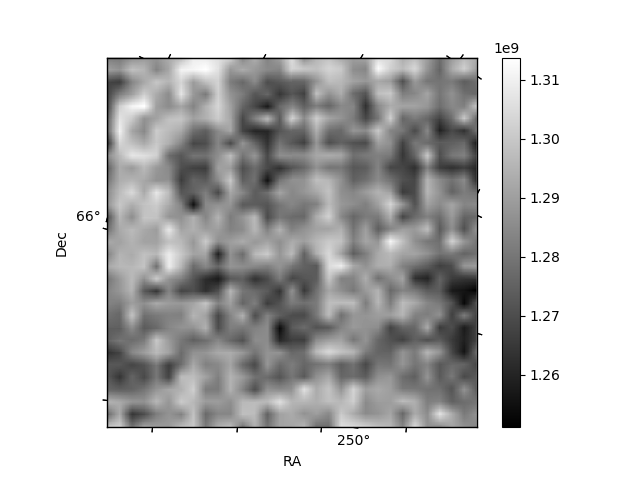
Histogram calculated using DETX and DETY for each event in the final _common_clean file
| Quadrant A |  |
 |
Quadrant B |
|---|---|---|---|
| Quadrant D | 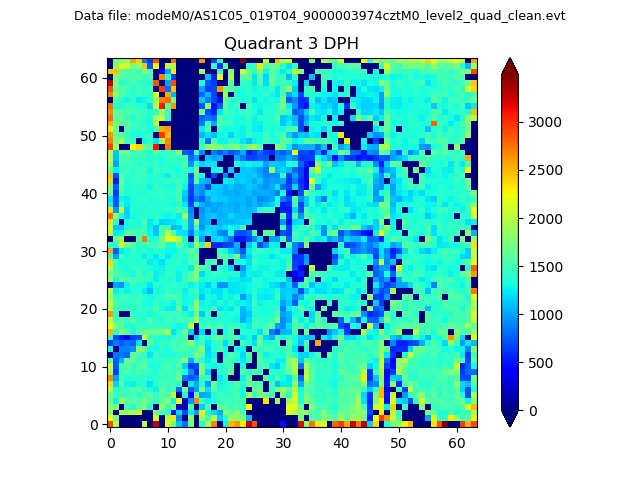 |
 |
Quadrant C |
| Plot type | Count rate plots | Images |
|---|---|---|
| Comparison with Poisson distribution Blue bars denote a histogram of data divided into 1 sec bins. Red curve is a Poisson curve with rate = median count rate of data. |
 |
 |
| Quadrant-wise count rates Data is divided into 100 sec bins |
 |
|
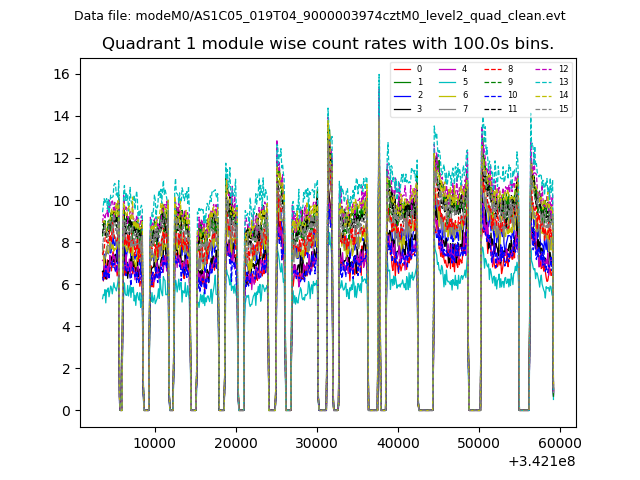
| Module-wise count rates for Quadrant A Data is divided into 100 sec bins |
 |
 |
| Module-wise count rates for Quadrant B Data is divided into 100 sec bins |
 |
 |
| Module-wise count rates for Quadrant C Data is divided into 100 sec bins |
 |
 |
| Module-wise count rates for Quadrant D Data is divided into 100 sec bins |
 |
 |
| Parameter | Plot |
|---|---|
| CZT HV Monitor |  |
| D_VDD |  |
| Temperature 1 |  |
| Veto HV Monitor |  |
| Veto LLD | 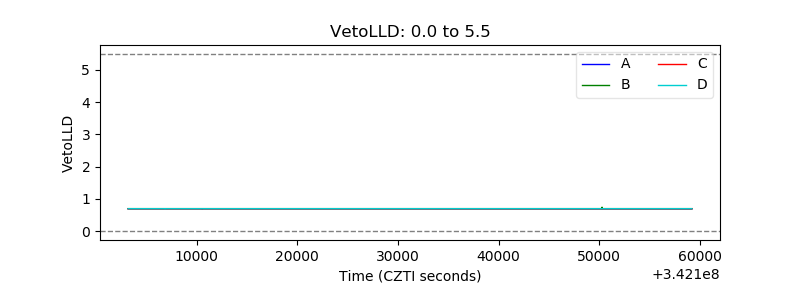 |
| Alpha Counter |  |
| _CPM_Rate |  |
| CZT Counter |  |
| +2.5 Volts monitor |  |
| +5 Volts monitor |  |
| _ROLL_ROT | 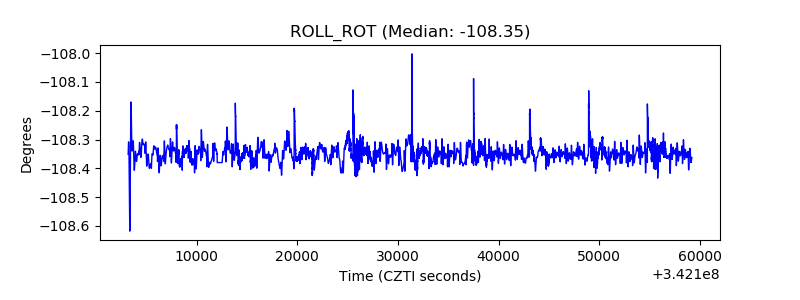 |
| _Roll_DEC |  |
| _Roll_RA |  |
| Veto Counter |  |