| Param | Original file | Final file |
|---|---|---|
| Filename | modeM0/AS1C05_019T04_9000003974_27583cztM0_level2.evt | modeM0/AS1C05_019T04_9000003974_27583cztM0_level2_quad_clean.evt |
| Size (bytes) | 1,066,527,360 | 251,585,280 |
| Size | 1017.1 MB | 239.9 MB |
| Events in quadrant A | 7,008,390 | 1,675,831 |
| Events in quadrant B | 7,835,273 | 1,692,373 |
| Events in quadrant C | 7,177,086 | 1,631,462 |
| Events in quadrant D | 9,252,403 | 1,573,698 |
| Mode M9 | |||
|---|---|---|---|
| Quadrant | BADHDUFLAG | Total packets | Discarded packets |
| A | 0 | 18 | 0 |
| B | 0 | 18 | 0 |
| C | 0 | 18 | 0 |
| D | 0 | 18 | 0 |
| Mode M0 | |||
|---|---|---|---|
| Quadrant | BADHDUFLAG | Total packets | Discarded packets |
| A | 0 | 30914 | 0 |
| B | 0 | 33077 | 0 |
| C | 0 | 31050 | 0 |
| D | 0 | 37749 | 0 |
| Quadrant | Total seconds | Saturated seconds | Saturation percentage |
|---|---|---|---|
| A | 15171 | 122 | 0.804166% |
| B | 15171 | 228 | 1.502867% |
| C | 15171 | 230 | 1.516050% |
| D | 15170 | 576 | 3.796968% |
Noise dominated data is calculated using 1-second bins in cleaned event files. If a bin has >2000 counts, and if more than 50% of those come from <1% of pixels, then it is considered to be noise-dominated and hence unusable.
| Quadrant | # 1 sec bins | Bins with >0 counts | Bins with >2000 counts | High rate bins dominated by noise | Noise dominated (total time) | Noise dominated (detector-on time) | Marked lightcurve |
|---|---|---|---|---|---|---|---|
| A | 17061 | 15174 | 3 | 3 | 0.02% | 0.02% |  |
| B | 17061 | 15174 | 70 | 70 | 0.41% | 0.46% | 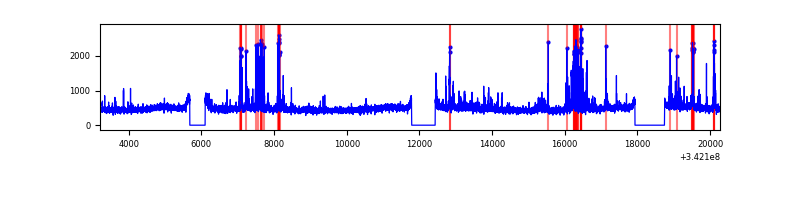 |
| C | 17061 | 15174 | 0 | 0 | 0.00% | 0.00% | 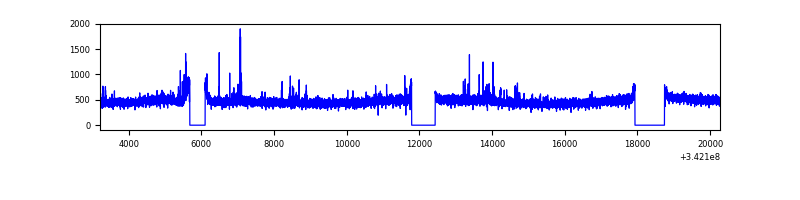 |
| D | 17060 | 15173 | 367 | 367 | 2.15% | 2.42% | 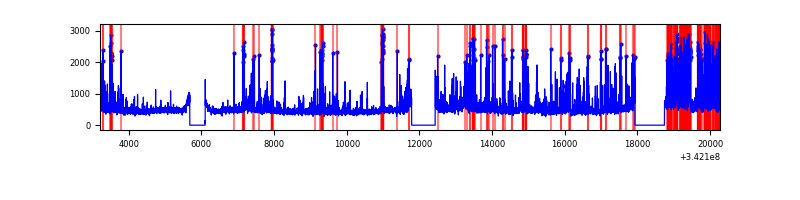 |
Top three noisy pixels from each quadrant. If the there are fewer than three noisy pixels in the level2.evt file, extra rows are filled as -1
| Pixel properties | Quadrant properties | ||||||
|---|---|---|---|---|---|---|---|
| Quadrant | DetID | PixID | Counts | Sigma | Mean | Median | Sigma |
| A | 13 | 254 | 27845 | 72.16 | 1807 | 1767 | 361.4 |
| A | 8 | 192 | 24408 | 62.65 | 1807 | 1767 | 361.4 |
| A | 3 | 137 | 17694 | 44.07 | 1807 | 1767 | 361.4 |
| B | 10 | 245 | 474565 | 1386.12 | 1794 | 1746 | 341.1 |
| B | 15 | 32 | 245940 | 715.88 | 1794 | 1746 | 341.1 |
| B | 12 | 111 | 43105 | 121.25 | 1794 | 1746 | 341.1 |
| C | 14 | 238 | 280913 | 686.64 | 1740 | 1745 | 406.6 |
| C | 15 | 208 | 63481 | 151.85 | 1740 | 1745 | 406.6 |
| C | 2 | 16 | 37929 | 89.0 | 1740 | 1745 | 406.6 |
| D | 1 | 52 | 2174644 | 5293.62 | 1730 | 1679 | 410.5 |
| D | 6 | 112 | 276303 | 669.02 | 1730 | 1679 | 410.5 |
| D | 2 | 250 | 146736 | 353.38 | 1730 | 1679 | 410.5 |
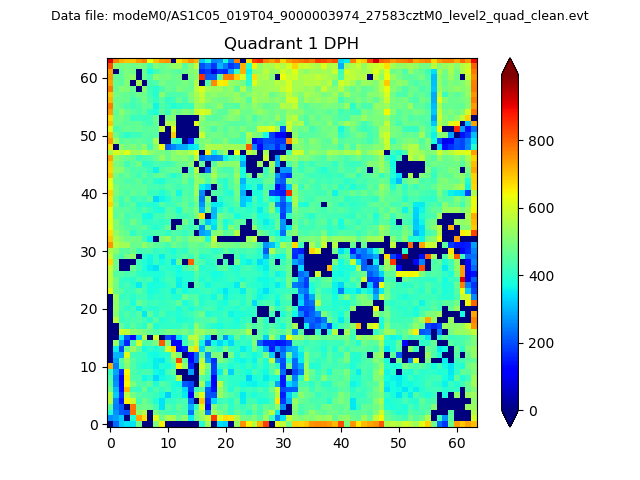
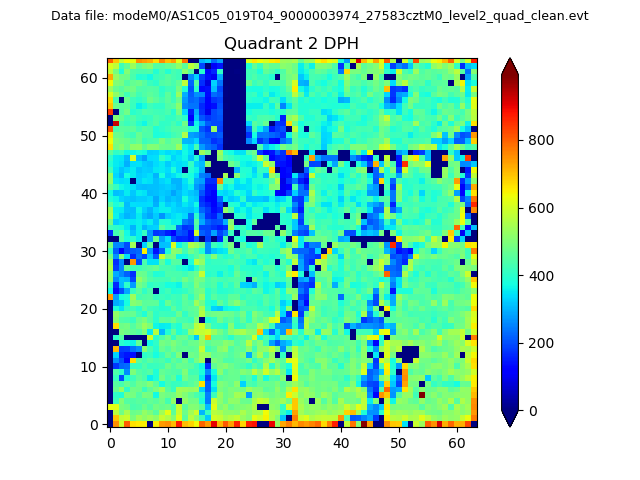
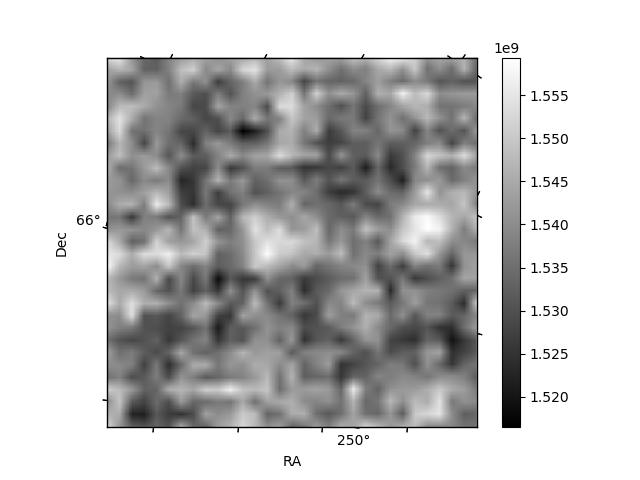
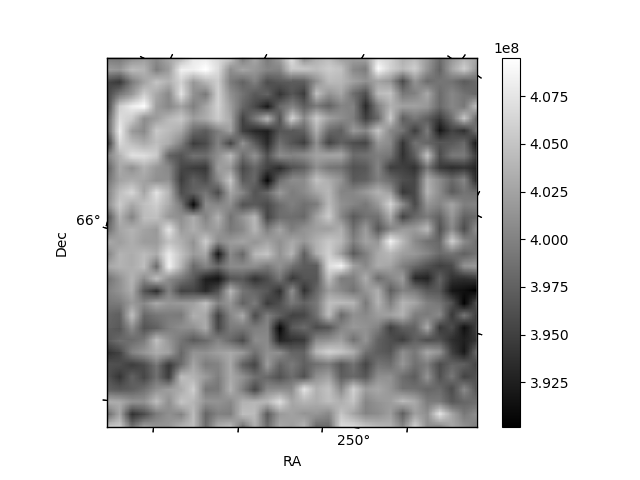
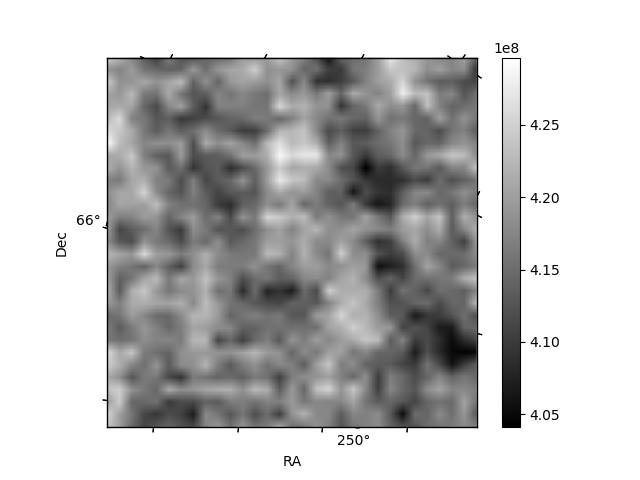
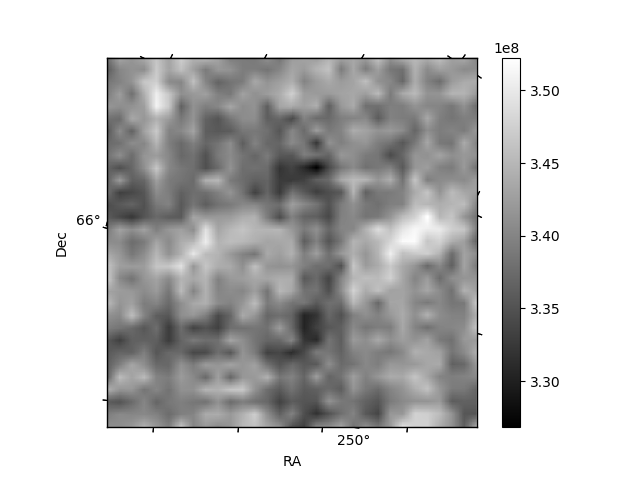
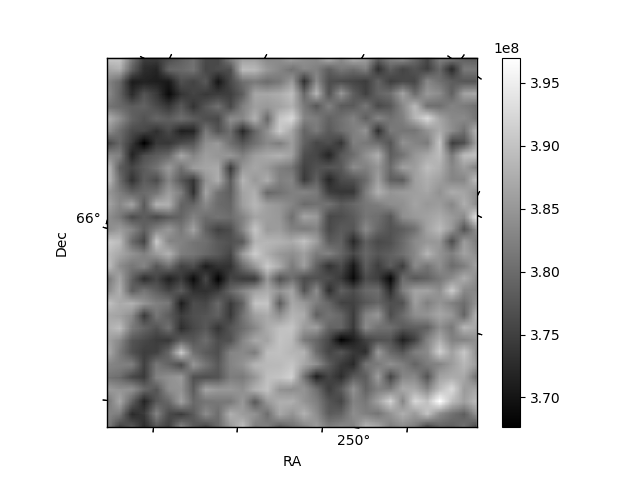
Histogram calculated using DETX and DETY for each event in the final _common_clean file
| Quadrant A | 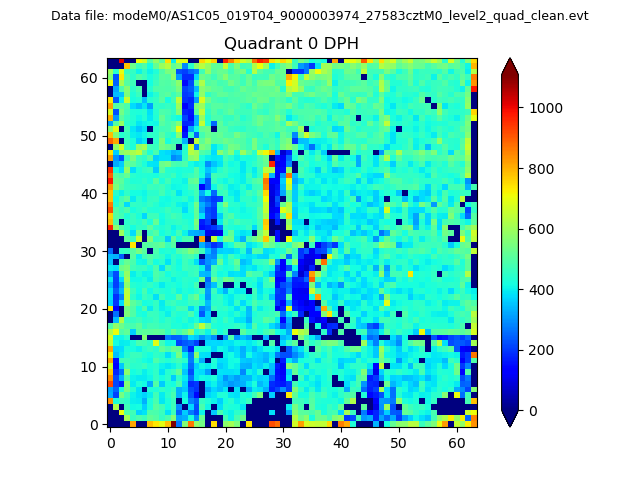 |
 |
Quadrant B |
|---|---|---|---|
| Quadrant D | 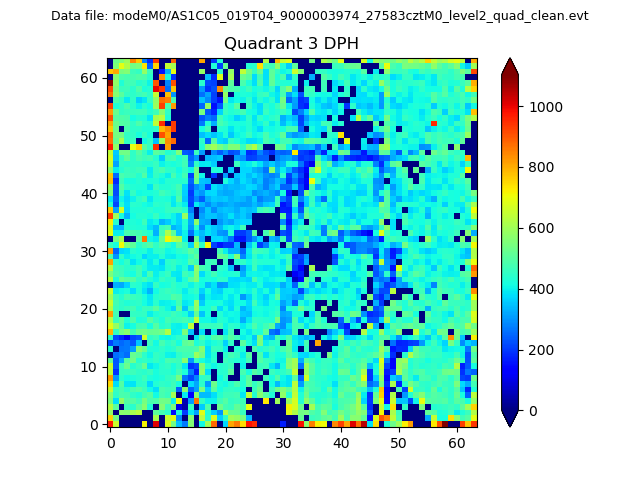 |
 |
Quadrant C |
| Plot type | Count rate plots | Images |
|---|---|---|
| Comparison with Poisson distribution Blue bars denote a histogram of data divided into 1 sec bins. Red curve is a Poisson curve with rate = median count rate of data. |
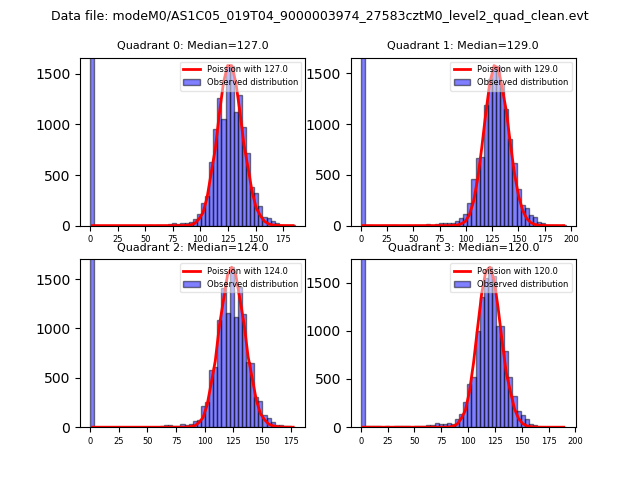 |
 |
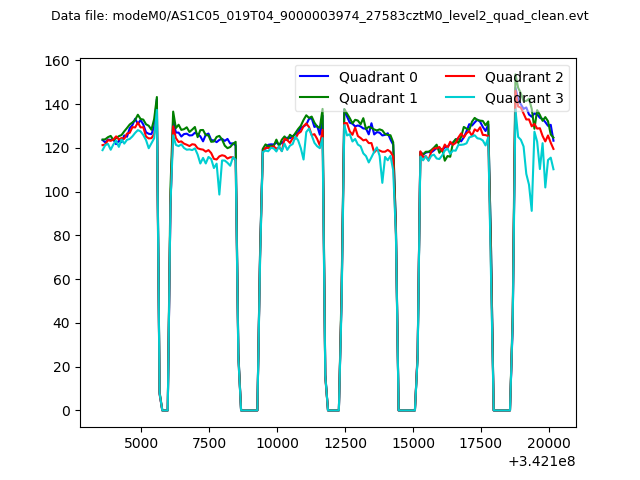
| Quadrant-wise count rates Data is divided into 100 sec bins |
 |
|
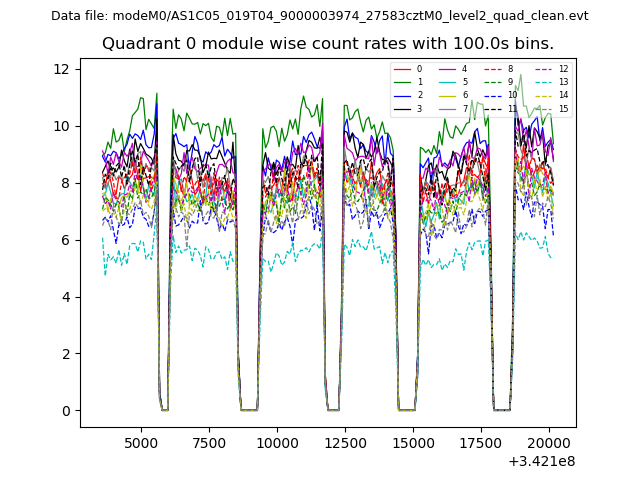
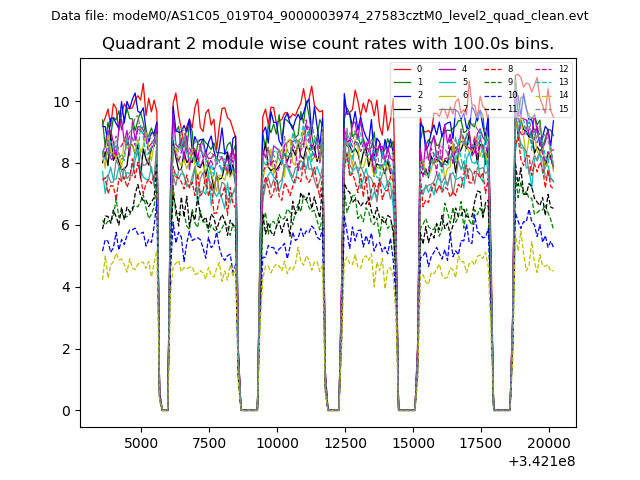
| Module-wise count rates for Quadrant A Data is divided into 100 sec bins |
 |
 |
| Module-wise count rates for Quadrant B Data is divided into 100 sec bins |
 |
 |
| Module-wise count rates for Quadrant C Data is divided into 100 sec bins |
 |
 |
| Module-wise count rates for Quadrant D Data is divided into 100 sec bins |
 |
 |
| Parameter | Plot |
|---|---|
| CZT HV Monitor | 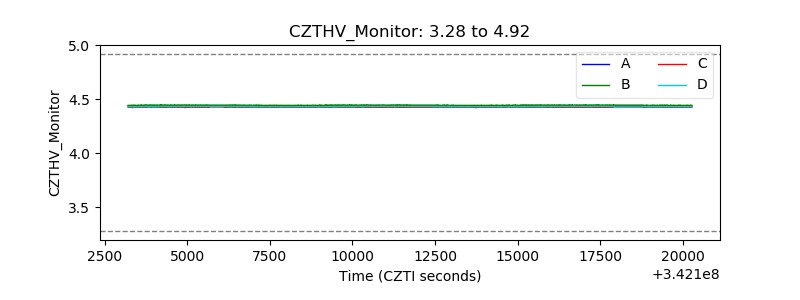 |
| D_VDD | 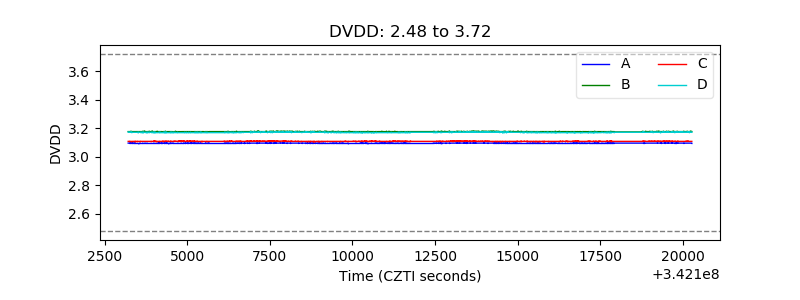 |
| Temperature 1 | 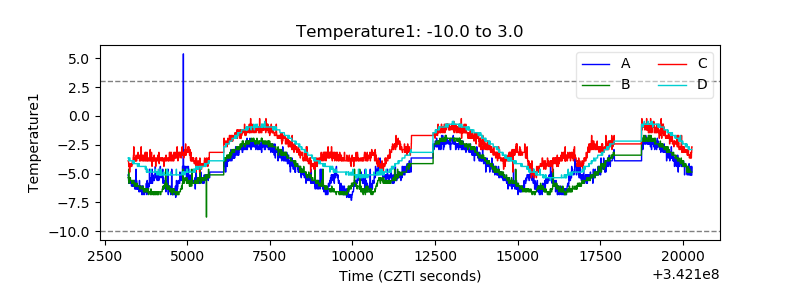 |
| Veto HV Monitor | 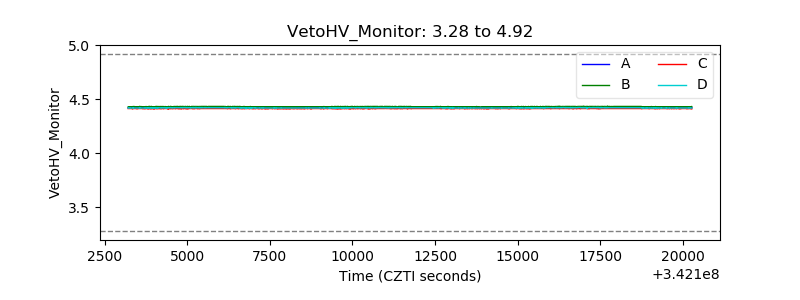 |
| Veto LLD | 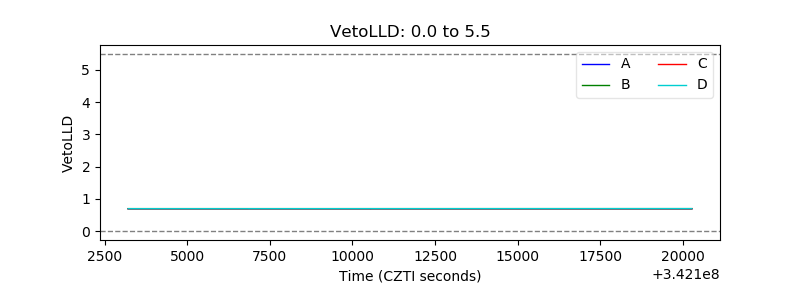 |
| Alpha Counter | 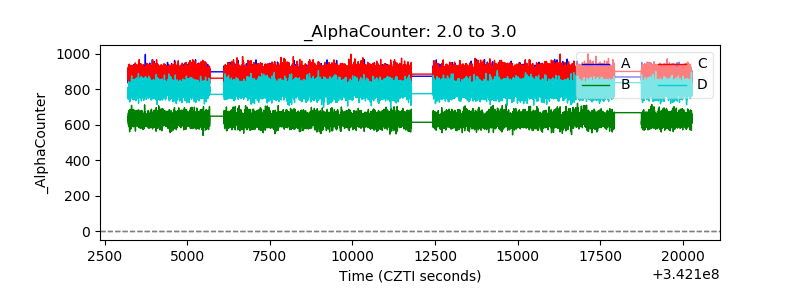 |
| _CPM_Rate | 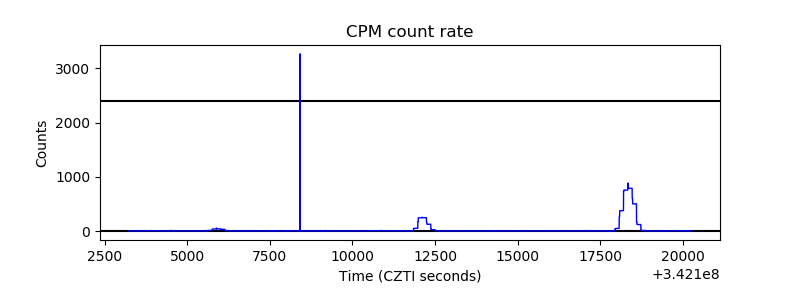 |
| CZT Counter | 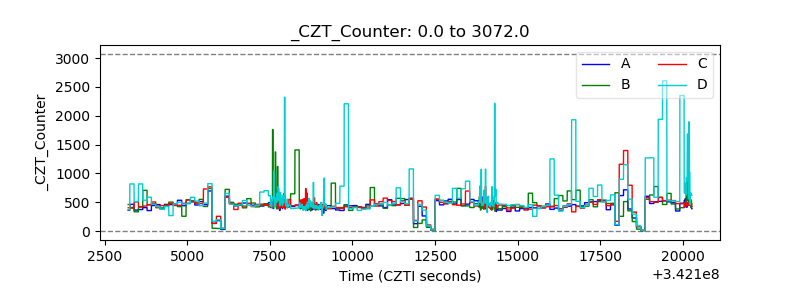 |
| +2.5 Volts monitor |  |
| +5 Volts monitor |  |
| _ROLL_ROT | 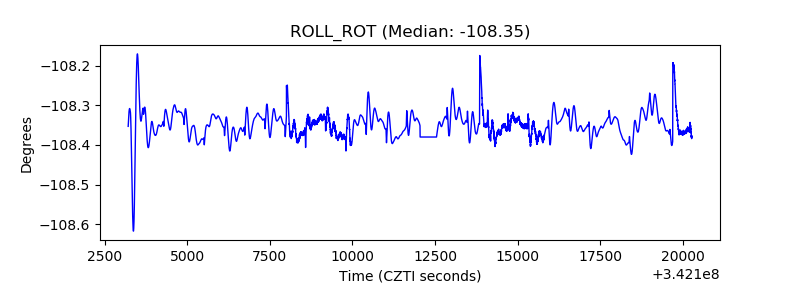 |
| _Roll_DEC | 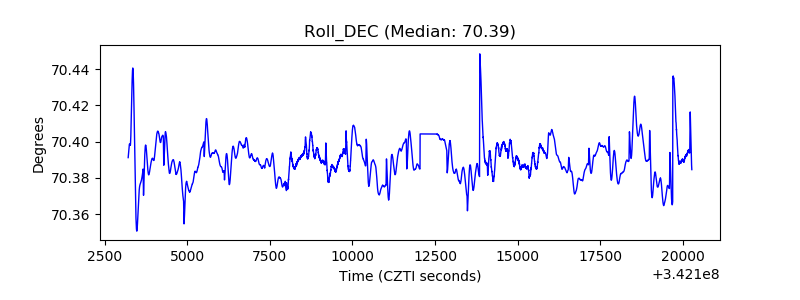 |
| _Roll_RA | 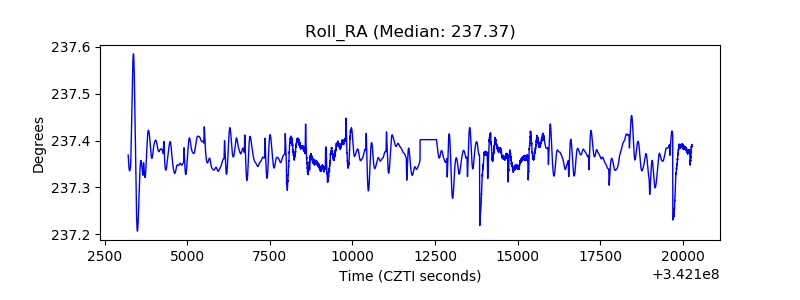 |
| Veto Counter |  |