| Param | Original file | Final file |
|---|---|---|
| Filename | modeM0/AS1C05_019T04_9000003974_27584cztM0_level2.evt | modeM0/AS1C05_019T04_9000003974_27584cztM0_level2_quad_clean.evt |
| Size (bytes) | 439,251,840 | 101,401,920 |
| Size | 418.9 MB | 96.7 MB |
| Events in quadrant A | 2,835,489 | 671,729 |
| Events in quadrant B | 3,018,329 | 682,039 |
| Events in quadrant C | 2,977,301 | 660,304 |
| Events in quadrant D | 4,057,410 | 631,448 |
| Mode M9 | |||
|---|---|---|---|
| Quadrant | BADHDUFLAG | Total packets | Discarded packets |
| A | 0 | 10 | 0 |
| B | 0 | 10 | 0 |
| C | 0 | 10 | 0 |
| D | 0 | 10 | 0 |
| Mode M0 | |||
|---|---|---|---|
| Quadrant | BADHDUFLAG | Total packets | Discarded packets |
| A | 0 | 12503 | 0 |
| B | 0 | 13008 | 0 |
| C | 0 | 12800 | 0 |
| D | 0 | 16384 | 0 |
| Quadrant | Total seconds | Saturated seconds | Saturation percentage |
|---|---|---|---|
| A | 6092 | 33 | 0.541694% |
| B | 6093 | 63 | 1.033973% |
| C | 6093 | 81 | 1.329394% |
| D | 6093 | 332 | 5.448876% |
Noise dominated data is calculated using 1-second bins in cleaned event files. If a bin has >2000 counts, and if more than 50% of those come from <1% of pixels, then it is considered to be noise-dominated and hence unusable.
| Quadrant | # 1 sec bins | Bins with >0 counts | Bins with >2000 counts | High rate bins dominated by noise | Noise dominated (total time) | Noise dominated (detector-on time) | Marked lightcurve |
|---|---|---|---|---|---|---|---|
| A | 7092 | 6093 | 0 | 0 | 0.00% | 0.00% |  |
| B | 7093 | 6094 | 16 | 16 | 0.23% | 0.26% |  |
| C | 7093 | 6094 | 3 | 3 | 0.04% | 0.05% |  |
| D | 7093 | 6094 | 253 | 253 | 3.57% | 4.15% | 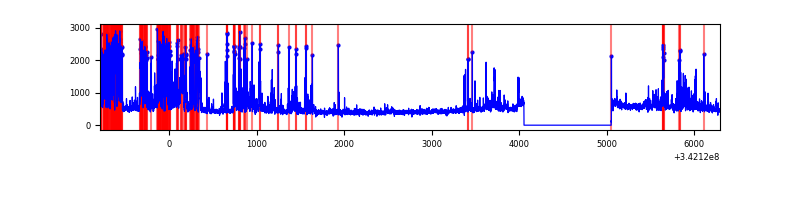 |
Top three noisy pixels from each quadrant. If the there are fewer than three noisy pixels in the level2.evt file, extra rows are filled as -1
| Pixel properties | Quadrant properties | ||||||
|---|---|---|---|---|---|---|---|
| Quadrant | DetID | PixID | Counts | Sigma | Mean | Median | Sigma |
| A | 13 | 254 | 10783 | 68.54 | 731 | 715 | 146.9 |
| A | 8 | 192 | 7209 | 44.21 | 731 | 715 | 146.9 |
| A | 3 | 137 | 7105 | 43.5 | 731 | 715 | 146.9 |
| B | 15 | 32 | 81650 | 579.96 | 726 | 705 | 139.6 |
| B | 3 | 64 | 46747 | 329.88 | 726 | 705 | 139.6 |
| B | 10 | 245 | 17265 | 118.65 | 726 | 705 | 139.6 |
| C | 14 | 238 | 115134 | 687.54 | 712 | 716 | 166.4 |
| C | 2 | 16 | 33404 | 196.42 | 712 | 716 | 166.4 |
| C | 10 | 22 | 33290 | 195.74 | 712 | 716 | 166.4 |
| D | 1 | 52 | 1196595 | 7103.67 | 701 | 681 | 168.4 |
| D | 2 | 250 | 90883 | 535.8 | 701 | 681 | 168.4 |
| D | 6 | 112 | 90249 | 532.03 | 701 | 681 | 168.4 |
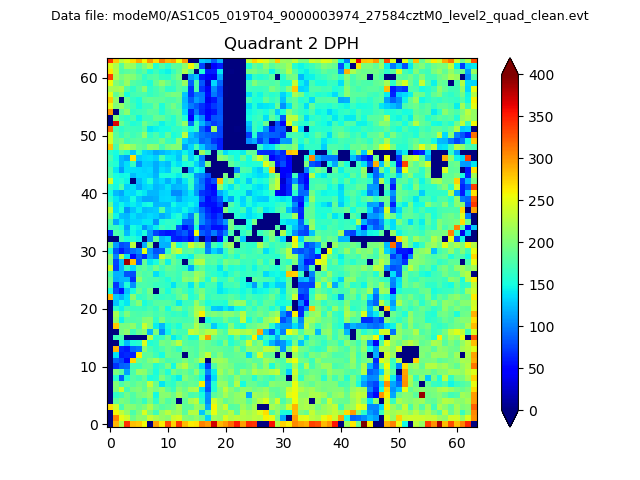
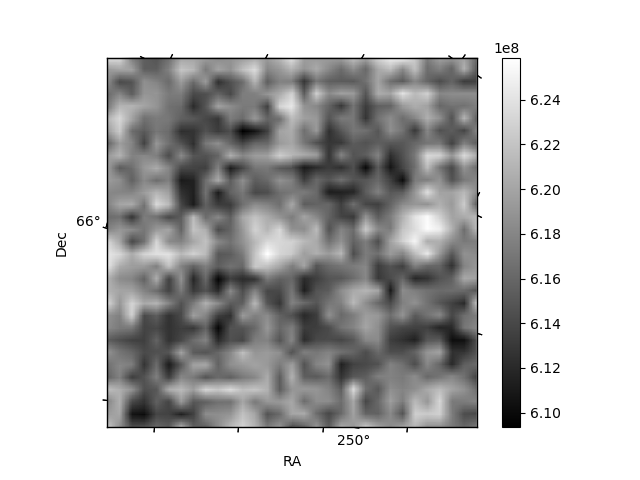
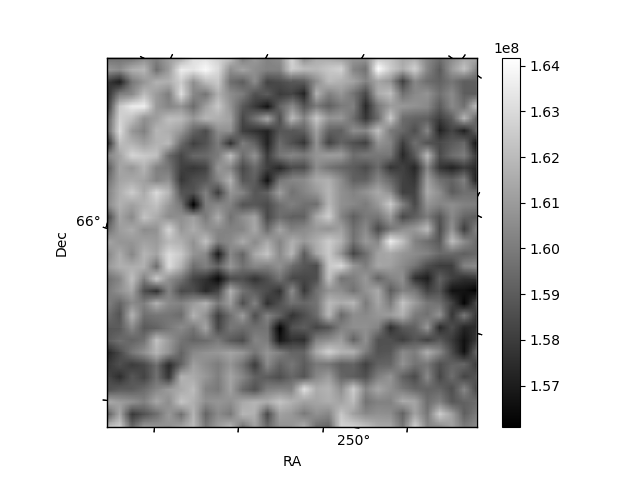
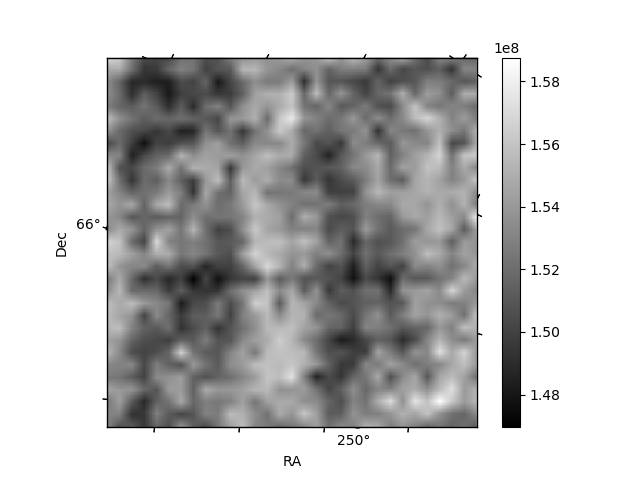
Histogram calculated using DETX and DETY for each event in the final _common_clean file
| Quadrant A | 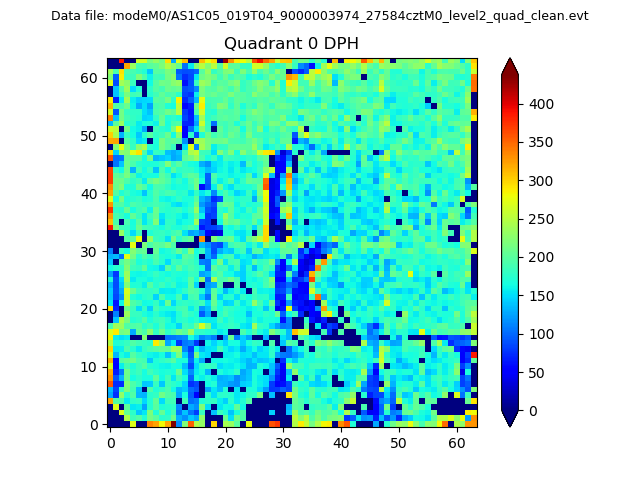 |
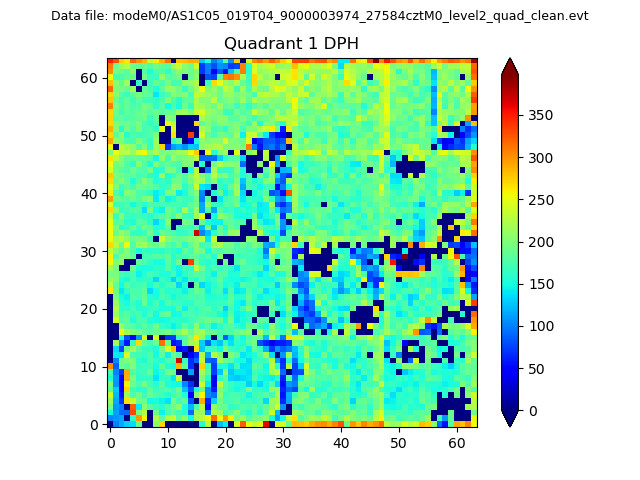 |
Quadrant B |
|---|---|---|---|
| Quadrant D | 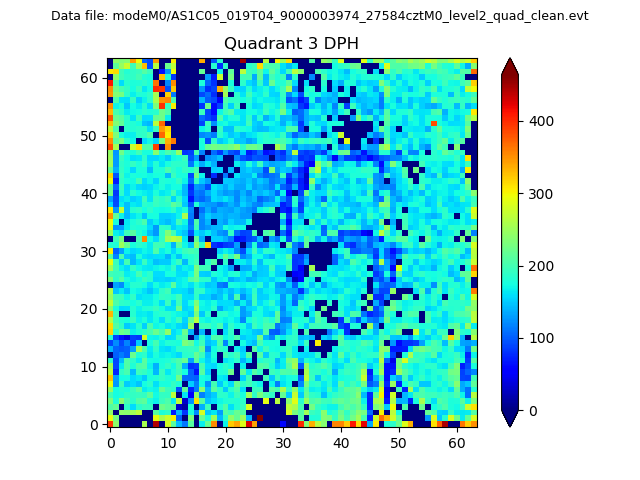 |
 |
Quadrant C |
| Plot type | Count rate plots | Images |
|---|---|---|
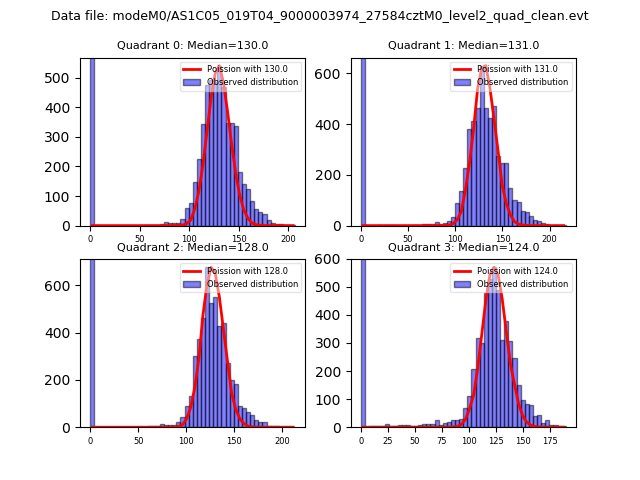
| Comparison with Poisson distribution Blue bars denote a histogram of data divided into 1 sec bins. Red curve is a Poisson curve with rate = median count rate of data. |
 |
 |
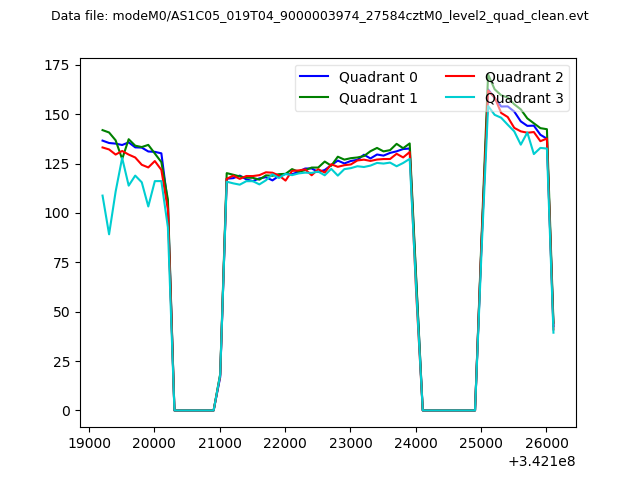
| Quadrant-wise count rates Data is divided into 100 sec bins |
 |
|
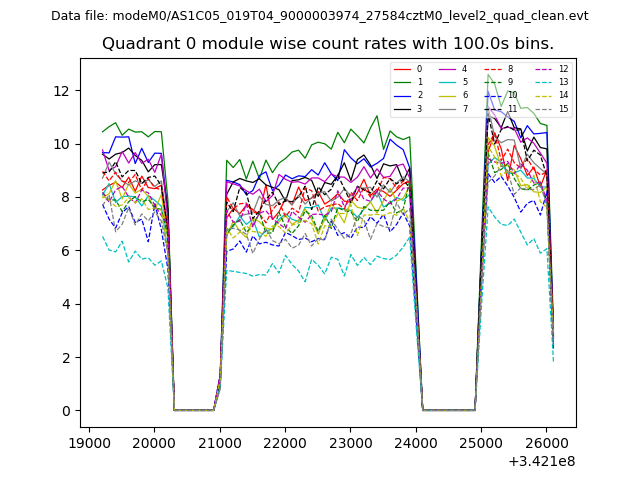
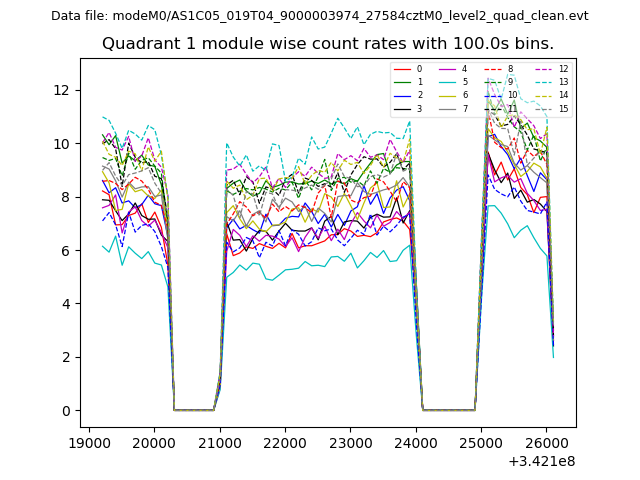
| Module-wise count rates for Quadrant A Data is divided into 100 sec bins |
 |
 |
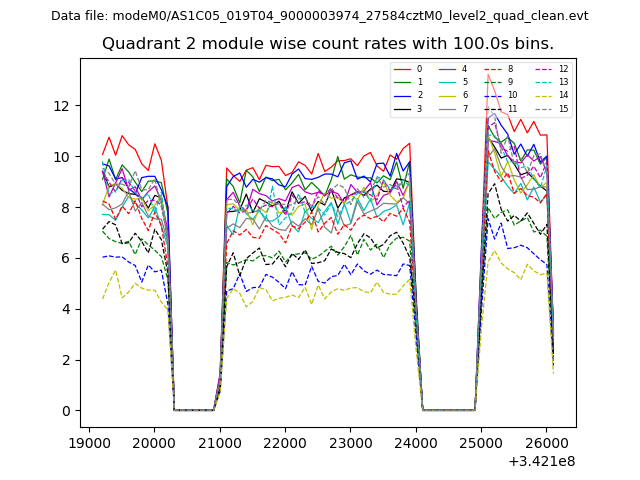
| Module-wise count rates for Quadrant B Data is divided into 100 sec bins |
 |
 |
| Module-wise count rates for Quadrant C Data is divided into 100 sec bins |
 |
 |
| Module-wise count rates for Quadrant D Data is divided into 100 sec bins |
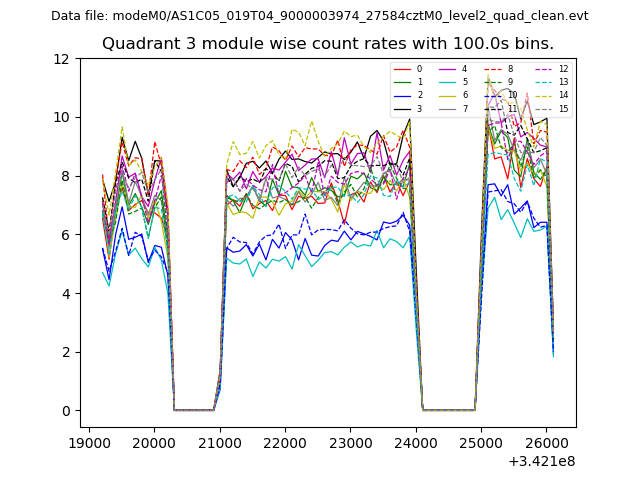 |
 |
| Parameter | Plot |
|---|---|
| CZT HV Monitor | 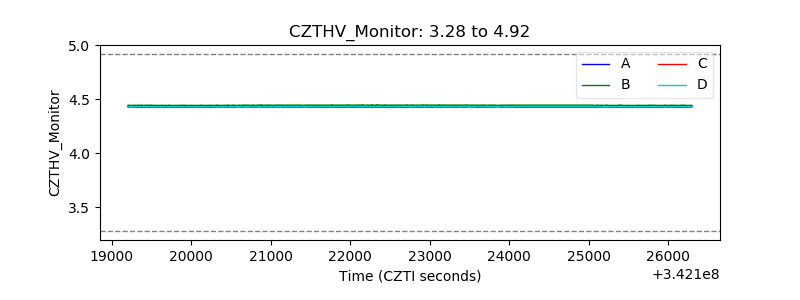 |
| D_VDD | 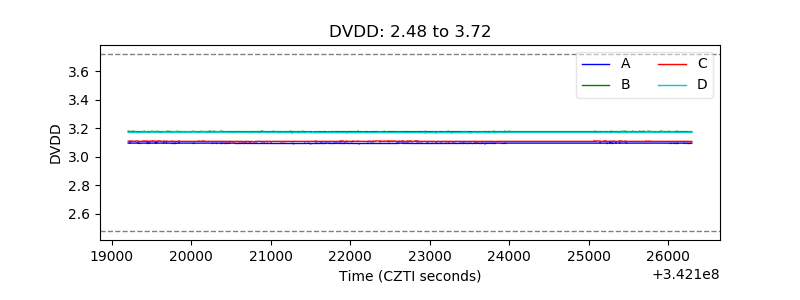 |
| Temperature 1 |  |
| Veto HV Monitor | 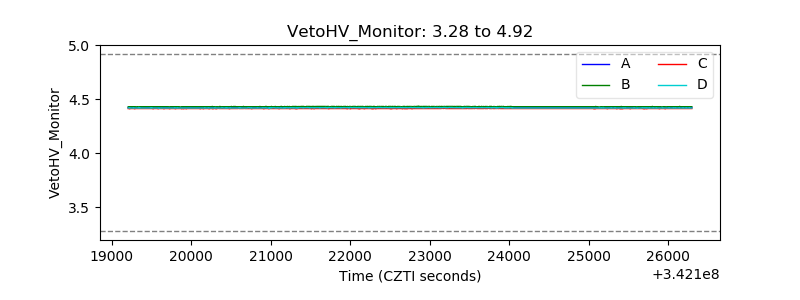 |
| Veto LLD | 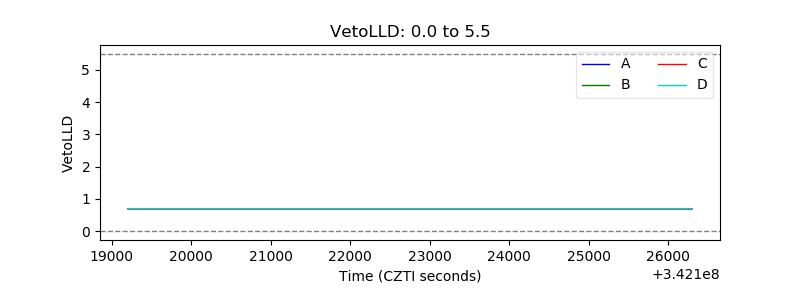 |
| Alpha Counter | 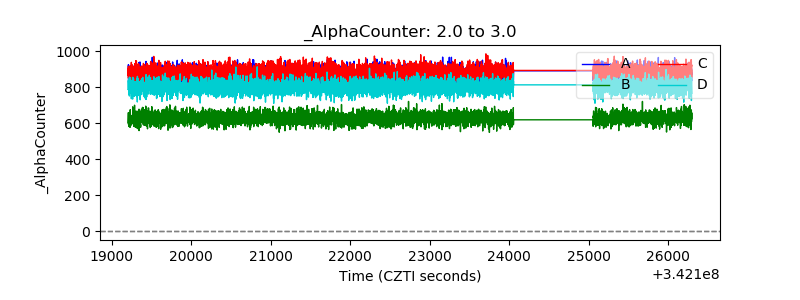 |
| _CPM_Rate | 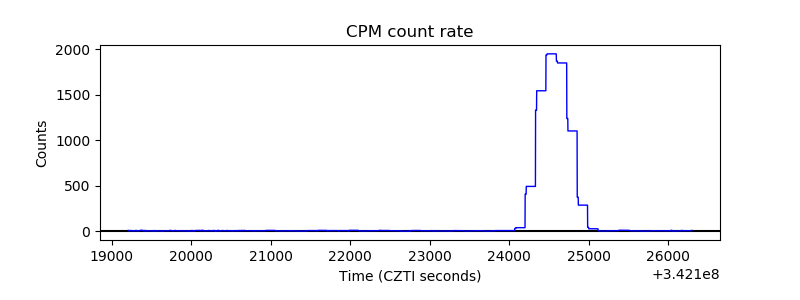 |
| CZT Counter | 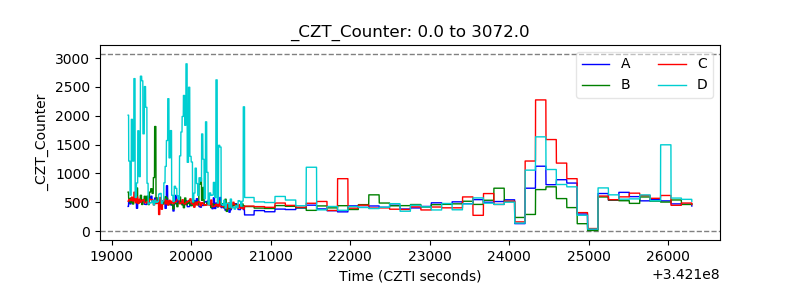 |
| +2.5 Volts monitor |  |
| +5 Volts monitor |  |
| _ROLL_ROT |  |
| _Roll_DEC | 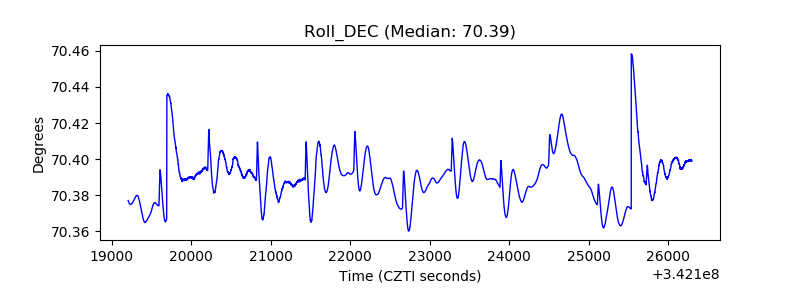 |
| _Roll_RA | 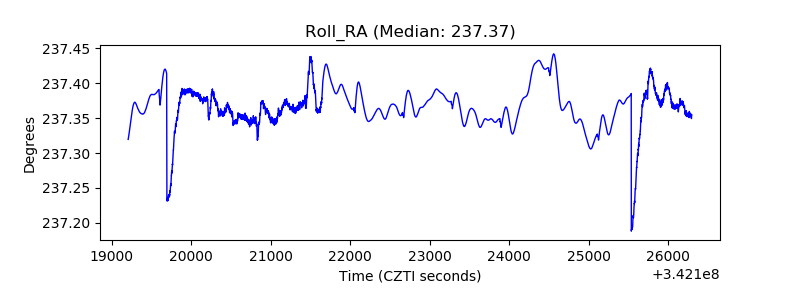 |
| Veto Counter | 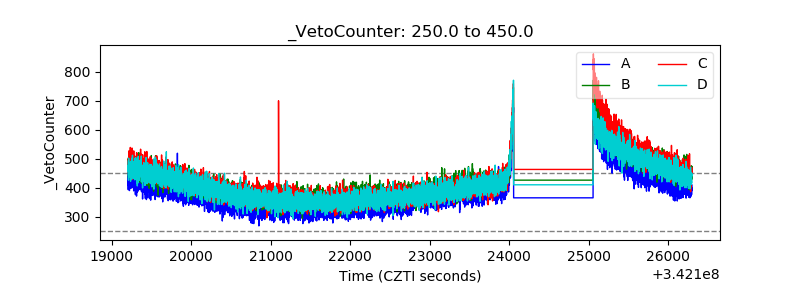 |