| Param | Original file | Final file |
|---|---|---|
| Filename | modeM0/AS1C05_019T04_9000003974_27586cztM0_level2.evt | modeM0/AS1C05_019T04_9000003974_27586cztM0_level2_quad_clean.evt |
| Size (bytes) | 505,195,200 | 100,287,360 |
| Size | 481.8 MB | 95.6 MB |
| Events in quadrant A | 3,052,871 | 682,040 |
| Events in quadrant B | 3,148,398 | 700,246 |
| Events in quadrant C | 3,202,116 | 677,303 |
| Events in quadrant D | 5,463,403 | 532,458 |
| Mode M9 | |||
|---|---|---|---|
| Quadrant | BADHDUFLAG | Total packets | Discarded packets |
| A | 0 | 13 | 0 |
| B | 0 | 14 | 0 |
| C | 0 | 14 | 0 |
| D | 0 | 14 | 0 |
| Mode M0 | |||
|---|---|---|---|
| Quadrant | BADHDUFLAG | Total packets | Discarded packets |
| A | 0 | 13328 | 0 |
| B | 0 | 13602 | 0 |
| C | 0 | 13805 | 0 |
| D | 0 | 20613 | 0 |
| Quadrant | Total seconds | Saturated seconds | Saturation percentage |
|---|---|---|---|
| A | 6369 | 28 | 0.439629% |
| B | 6369 | 32 | 0.502434% |
| C | 6368 | 75 | 1.177764% |
| D | 6368 | 1223 | 19.205402% |
Noise dominated data is calculated using 1-second bins in cleaned event files. If a bin has >2000 counts, and if more than 50% of those come from <1% of pixels, then it is considered to be noise-dominated and hence unusable.
| Quadrant | # 1 sec bins | Bins with >0 counts | Bins with >2000 counts | High rate bins dominated by noise | Noise dominated (total time) | Noise dominated (detector-on time) | Marked lightcurve |
|---|---|---|---|---|---|---|---|
| A | 7519 | 6370 | 1 | 1 | 0.01% | 0.02% | 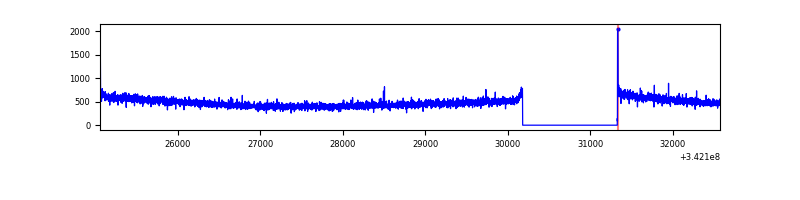 |
| B | 7519 | 6370 | 2 | 2 | 0.03% | 0.03% | 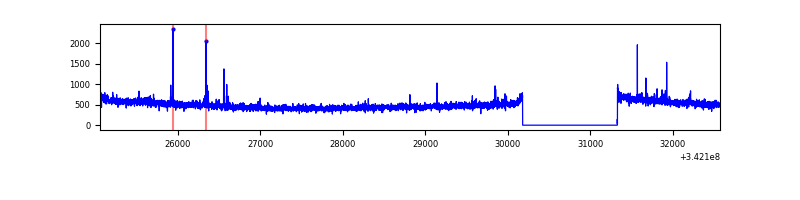 |
| C | 7518 | 6369 | 1 | 1 | 0.01% | 0.02% | 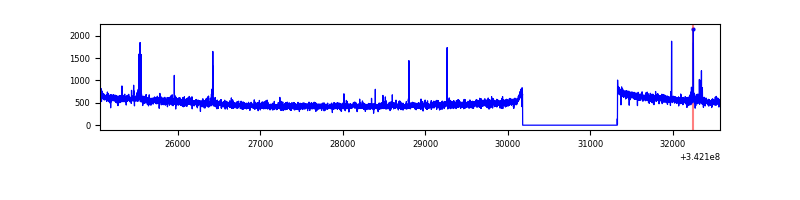 |
| D | 7518 | 6369 | 609 | 609 | 8.10% | 9.56% | 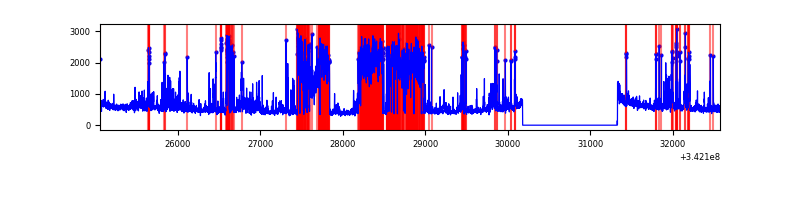 |
Top three noisy pixels from each quadrant. If the there are fewer than three noisy pixels in the level2.evt file, extra rows are filled as -1
| Pixel properties | Quadrant properties | ||||||
|---|---|---|---|---|---|---|---|
| Quadrant | DetID | PixID | Counts | Sigma | Mean | Median | Sigma |
| A | 8 | 192 | 14622 | 87.89 | 787 | 771 | 157.6 |
| A | 13 | 254 | 11276 | 66.66 | 787 | 771 | 157.6 |
| A | 3 | 137 | 7326 | 41.59 | 787 | 771 | 157.6 |
| B | 0 | 230 | 19219 | 125.06 | 788 | 767 | 147.5 |
| B | 12 | 111 | 17897 | 116.1 | 788 | 767 | 147.5 |
| B | 11 | 111 | 16192 | 104.54 | 788 | 767 | 147.5 |
| C | 14 | 238 | 125563 | 685.56 | 774 | 779 | 182.0 |
| C | 2 | 16 | 24043 | 127.81 | 774 | 779 | 182.0 |
| C | 15 | 208 | 19060 | 100.44 | 774 | 779 | 182.0 |
| D | 1 | 52 | 2432401 | 15096.39 | 669 | 651 | 161.1 |
| D | 6 | 112 | 436739 | 2707.25 | 669 | 651 | 161.1 |
| D | 2 | 250 | 60303 | 370.32 | 669 | 651 | 161.1 |
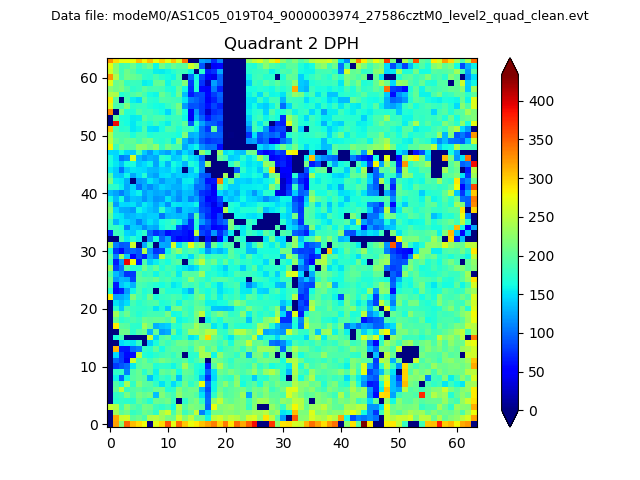
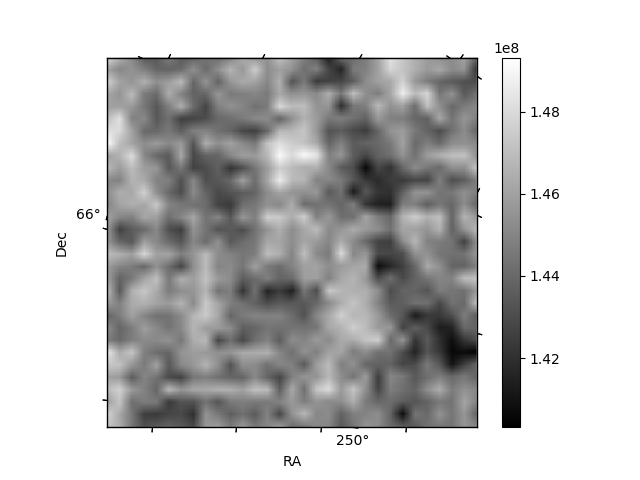
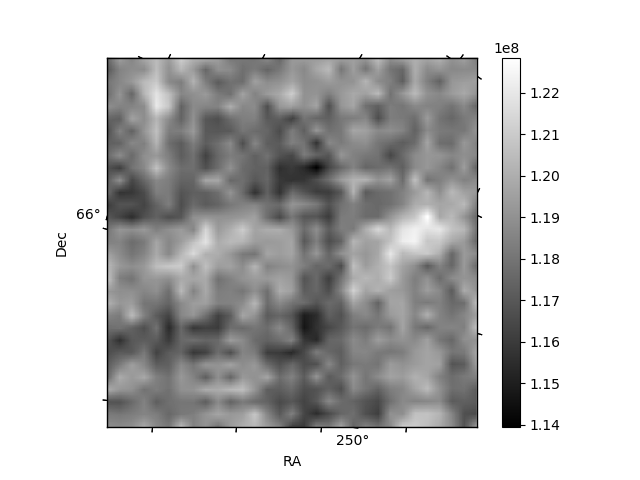
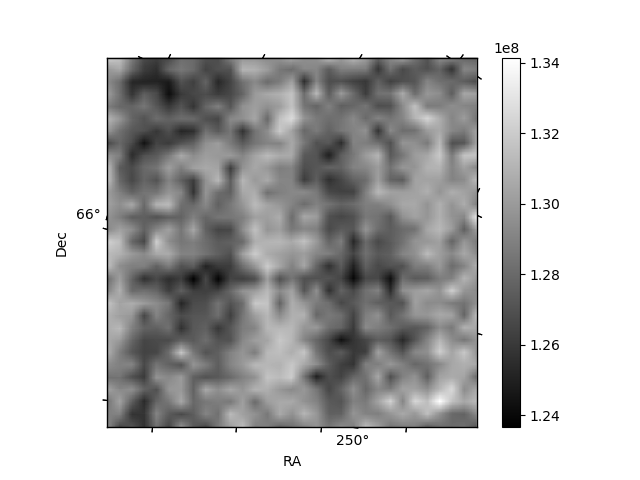
Histogram calculated using DETX and DETY for each event in the final _common_clean file
| Quadrant A | 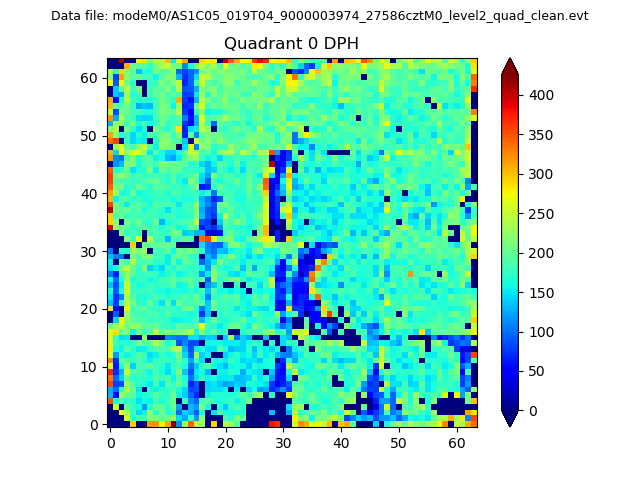 |
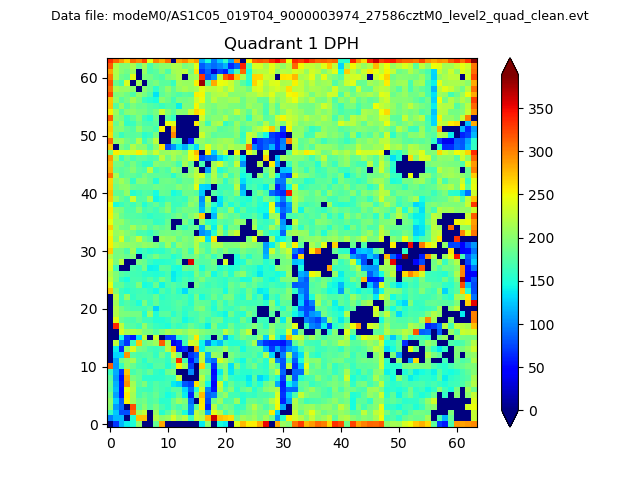 |
Quadrant B |
|---|---|---|---|
| Quadrant D | 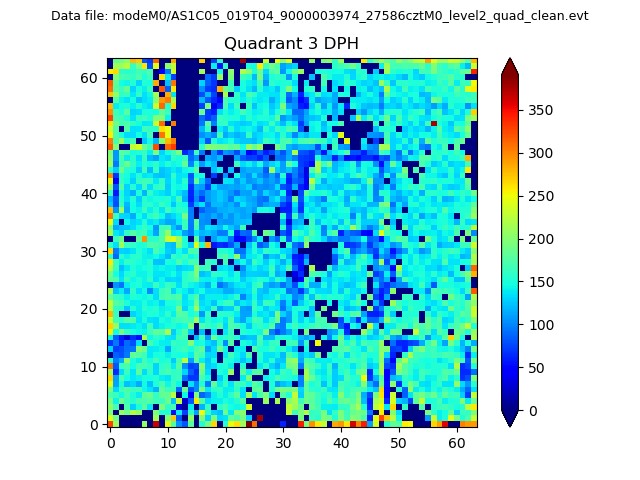 |
 |
Quadrant C |
| Plot type | Count rate plots | Images |
|---|---|---|
| Comparison with Poisson distribution Blue bars denote a histogram of data divided into 1 sec bins. Red curve is a Poisson curve with rate = median count rate of data. |
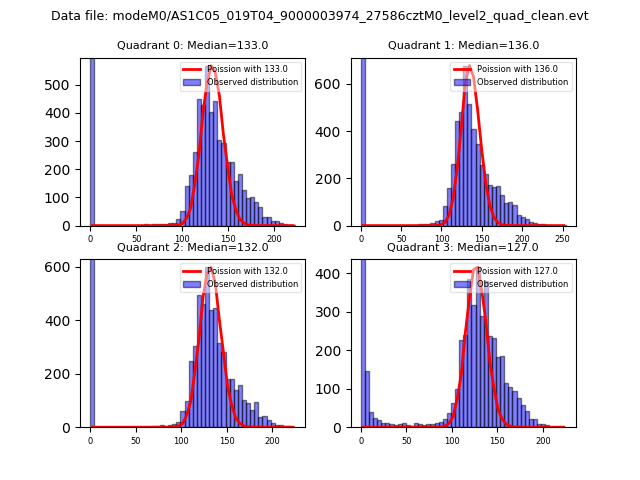 |
 |
| Quadrant-wise count rates Data is divided into 100 sec bins |
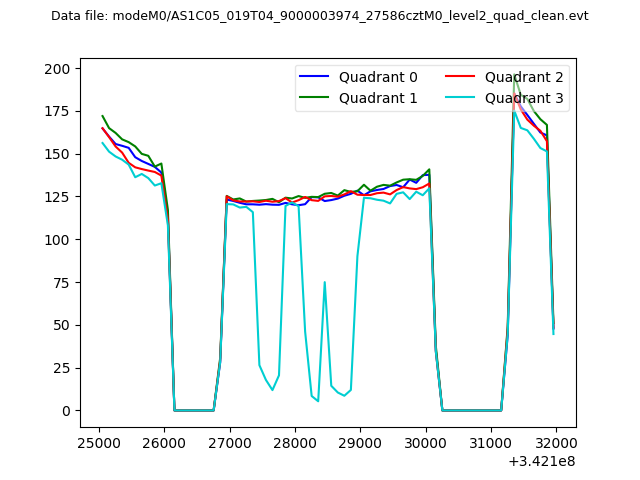 |
|
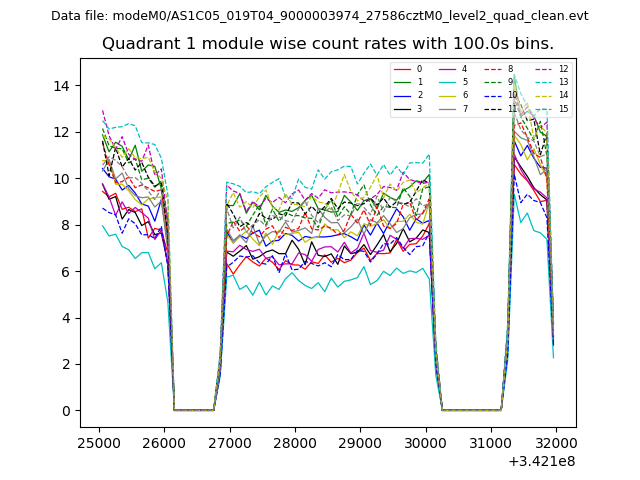
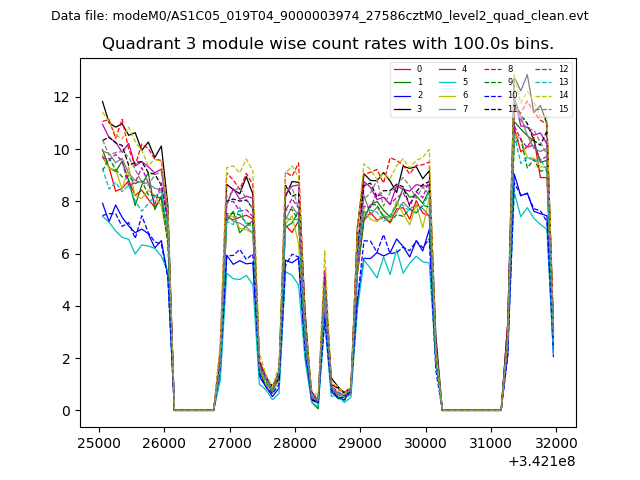
| Module-wise count rates for Quadrant A Data is divided into 100 sec bins |
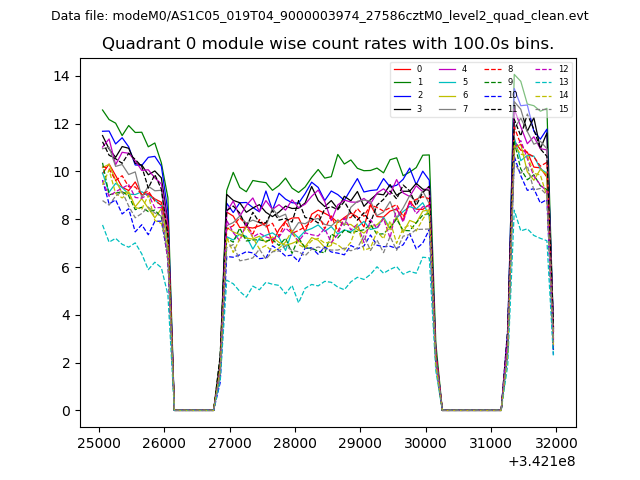 |
 |
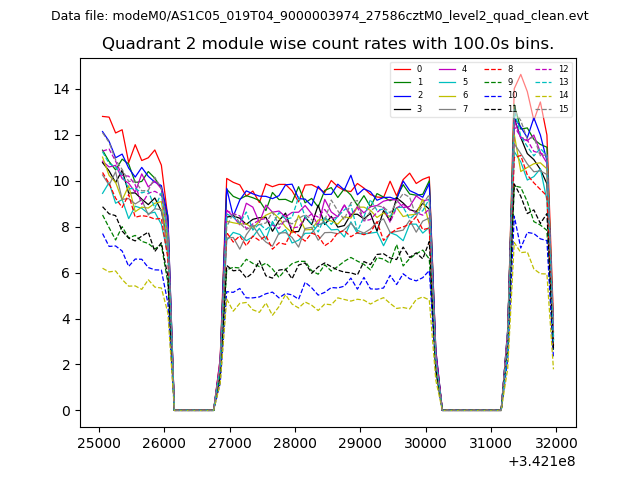
| Module-wise count rates for Quadrant B Data is divided into 100 sec bins |
 |
 |
| Module-wise count rates for Quadrant C Data is divided into 100 sec bins |
 |
 |
| Module-wise count rates for Quadrant D Data is divided into 100 sec bins |
 |
 |
| Parameter | Plot |
|---|---|
| CZT HV Monitor | 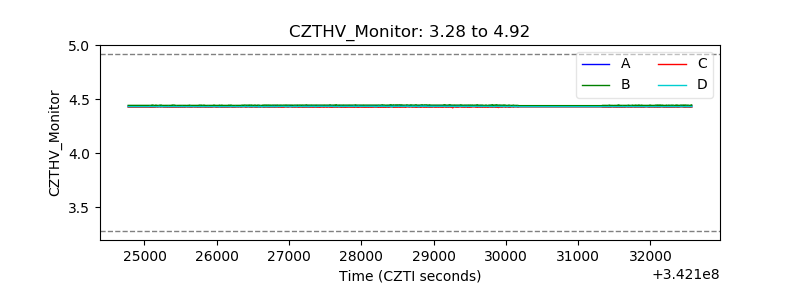 |
| D_VDD | 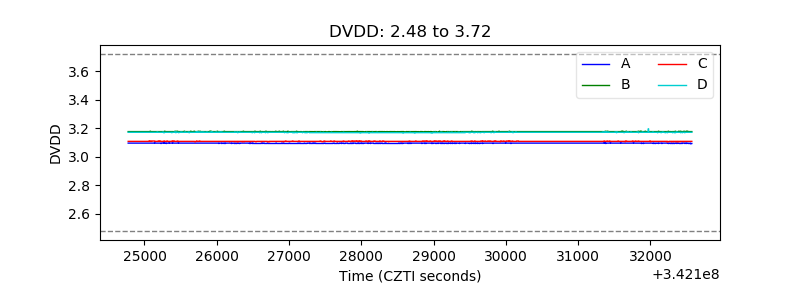 |
| Temperature 1 | 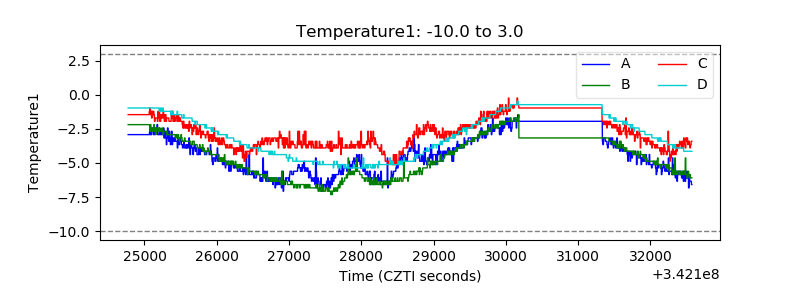 |
| Veto HV Monitor | 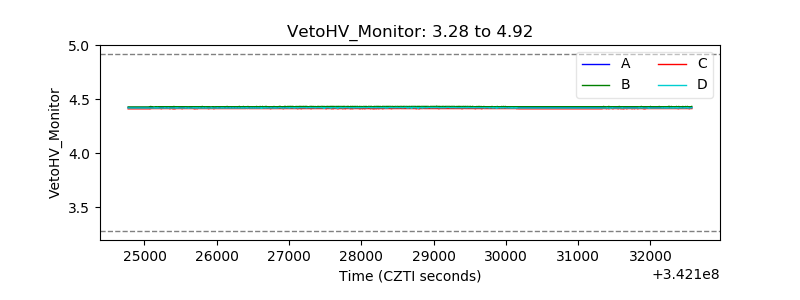 |
| Veto LLD | 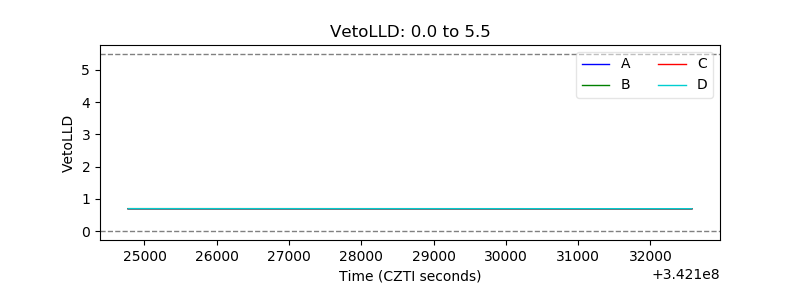 |
| Alpha Counter |  |
| _CPM_Rate | 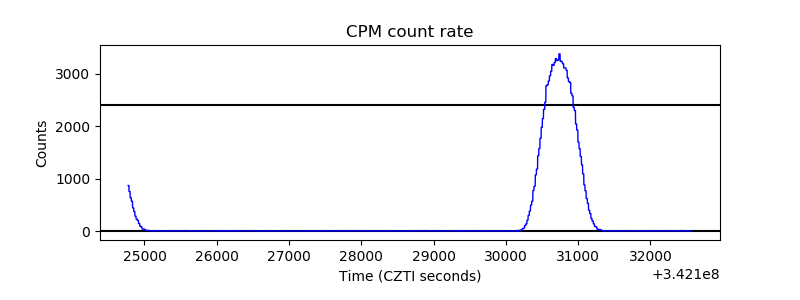 |
| CZT Counter |  |
| +2.5 Volts monitor |  |
| +5 Volts monitor | 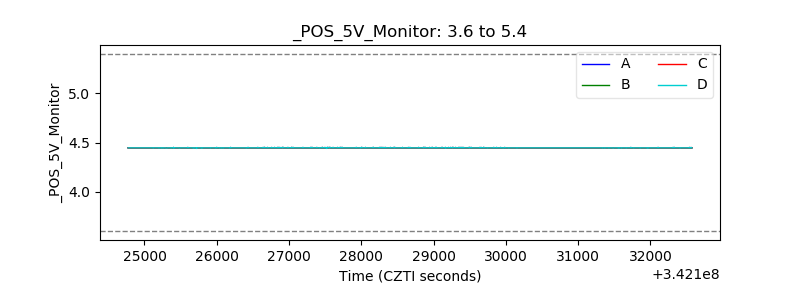 |
| _ROLL_ROT | 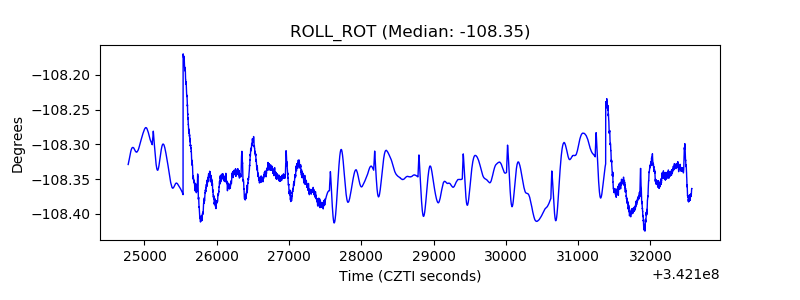 |
| _Roll_DEC | 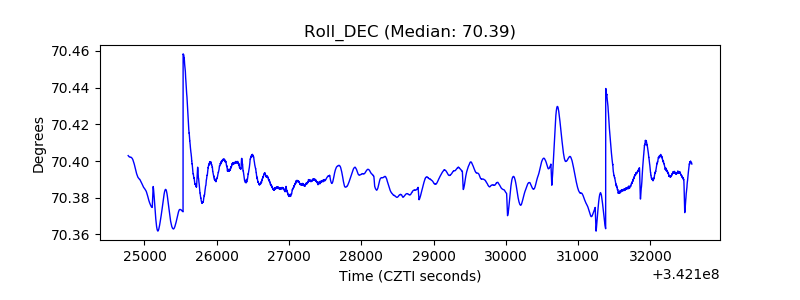 |
| _Roll_RA |  |
| Veto Counter | 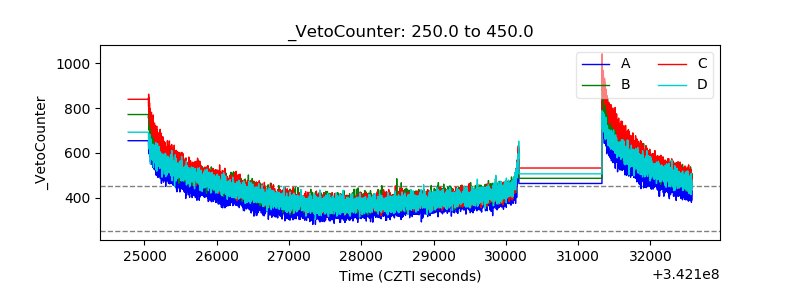 |