| Param | Original file | Final file |
|---|---|---|
| Filename | modeM0/AS1C05_019T04_9000003974_27587cztM0_level2.evt | modeM0/AS1C05_019T04_9000003974_27587cztM0_level2_quad_clean.evt |
| Size (bytes) | 468,843,840 | 105,920,640 |
| Size | 447.1 MB | 101.0 MB |
| Events in quadrant A | 3,191,435 | 691,089 |
| Events in quadrant B | 3,317,853 | 709,429 |
| Events in quadrant C | 3,375,668 | 690,980 |
| Events in quadrant D | 3,874,953 | 665,470 |
| Mode M9 | |||
|---|---|---|---|
| Quadrant | BADHDUFLAG | Total packets | Discarded packets |
| A | 0 | 14 | 0 |
| B | 0 | 15 | 0 |
| C | 0 | 15 | 0 |
| D | 0 | 15 | 0 |
| Mode M0 | |||
|---|---|---|---|
| Quadrant | BADHDUFLAG | Total packets | Discarded packets |
| A | 0 | 13755 | 0 |
| B | 0 | 14122 | 0 |
| C | 0 | 14360 | 0 |
| D | 0 | 16081 | 0 |
| Quadrant | Total seconds | Saturated seconds | Saturation percentage |
|---|---|---|---|
| A | 6471 | 51 | 0.788132% |
| B | 6470 | 55 | 0.850077% |
| C | 6470 | 101 | 1.561051% |
| D | 6470 | 114 | 1.761978% |
Noise dominated data is calculated using 1-second bins in cleaned event files. If a bin has >2000 counts, and if more than 50% of those come from <1% of pixels, then it is considered to be noise-dominated and hence unusable.
| Quadrant | # 1 sec bins | Bins with >0 counts | Bins with >2000 counts | High rate bins dominated by noise | Noise dominated (total time) | Noise dominated (detector-on time) | Marked lightcurve |
|---|---|---|---|---|---|---|---|
| A | 7736 | 6472 | 3 | 3 | 0.04% | 0.05% | 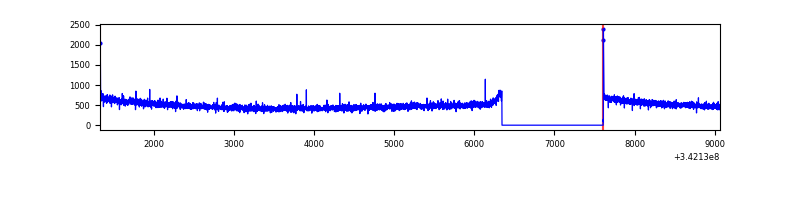 |
| B | 7735 | 6471 | 1 | 1 | 0.01% | 0.02% | 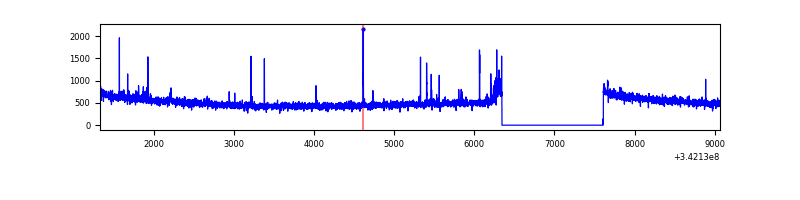 |
| C | 7735 | 6471 | 7 | 7 | 0.09% | 0.11% | 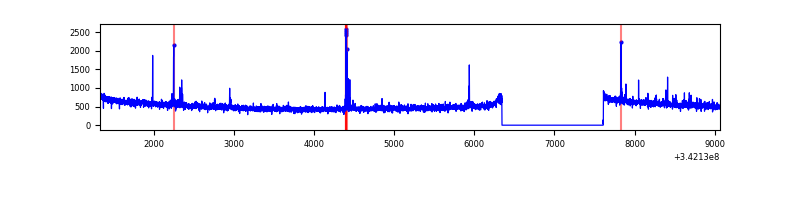 |
| D | 7735 | 6471 | 78 | 78 | 1.01% | 1.21% | 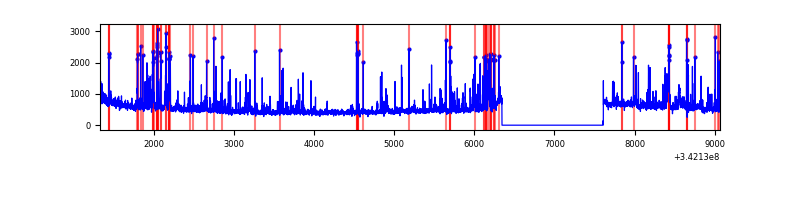 |
Top three noisy pixels from each quadrant. If the there are fewer than three noisy pixels in the level2.evt file, extra rows are filled as -1
| Pixel properties | Quadrant properties | ||||||
|---|---|---|---|---|---|---|---|
| Quadrant | DetID | PixID | Counts | Sigma | Mean | Median | Sigma |
| A | 8 | 192 | 15219 | 88.63 | 823 | 807 | 162.6 |
| A | 13 | 254 | 11543 | 66.02 | 823 | 807 | 162.6 |
| A | 3 | 137 | 7420 | 40.67 | 823 | 807 | 162.6 |
| B | 0 | 230 | 21510 | 135.39 | 827 | 807 | 152.9 |
| B | 12 | 111 | 18674 | 116.84 | 827 | 807 | 152.9 |
| B | 15 | 32 | 17691 | 110.41 | 827 | 807 | 152.9 |
| C | 14 | 238 | 131366 | 699.18 | 809 | 815 | 186.7 |
| C | 2 | 16 | 74332 | 393.73 | 809 | 815 | 186.7 |
| C | 10 | 22 | 8538 | 41.36 | 809 | 815 | 186.7 |
| D | 1 | 52 | 641494 | 3358.18 | 801 | 779 | 190.8 |
| D | 6 | 112 | 92578 | 481.15 | 801 | 779 | 190.8 |
| D | 2 | 250 | 68928 | 357.19 | 801 | 779 | 190.8 |
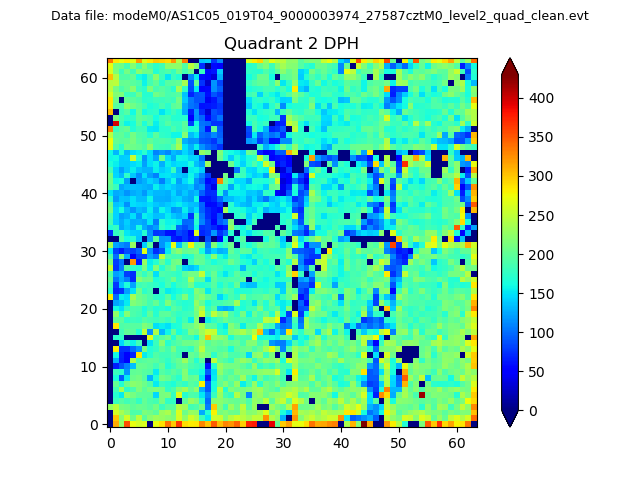
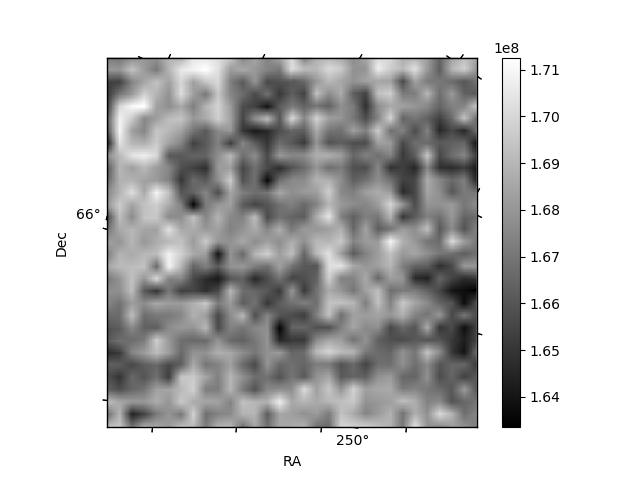
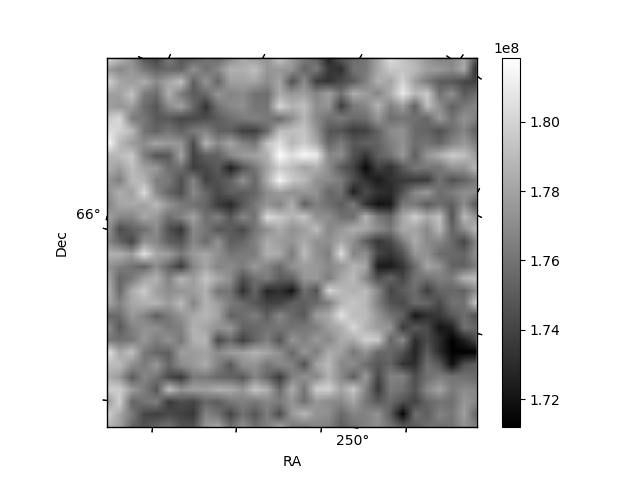
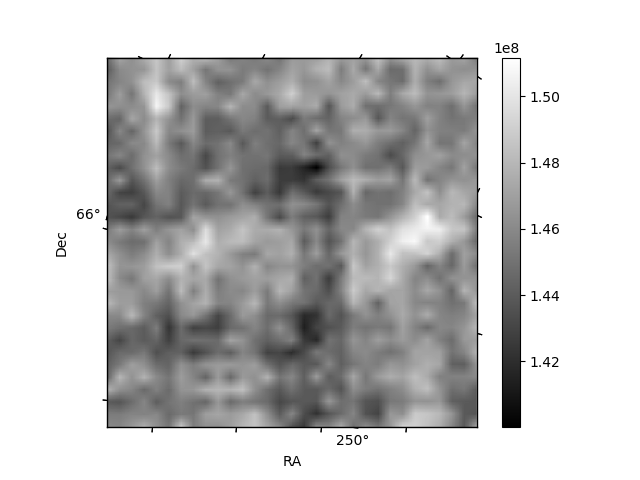
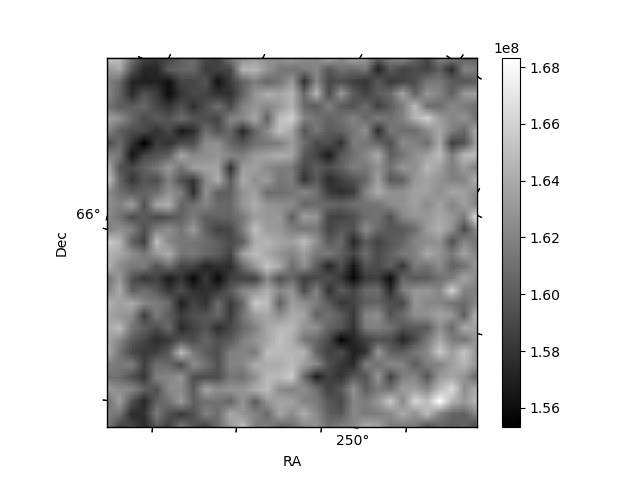
Histogram calculated using DETX and DETY for each event in the final _common_clean file
| Quadrant A | 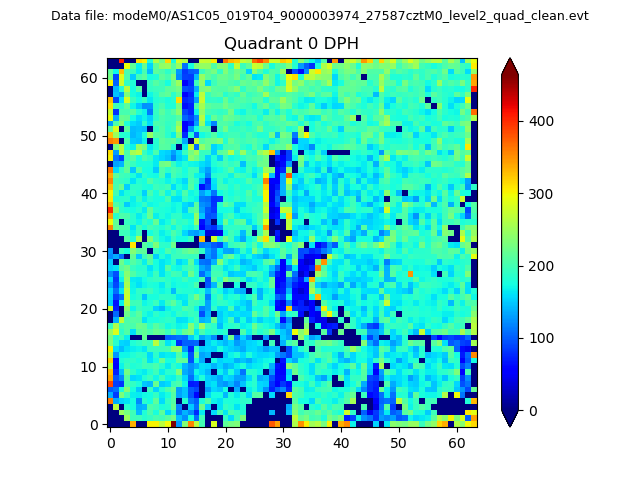 |
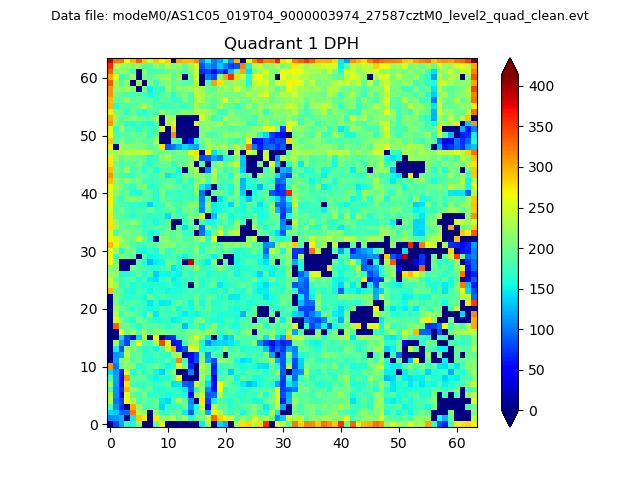 |
Quadrant B |
|---|---|---|---|
| Quadrant D | 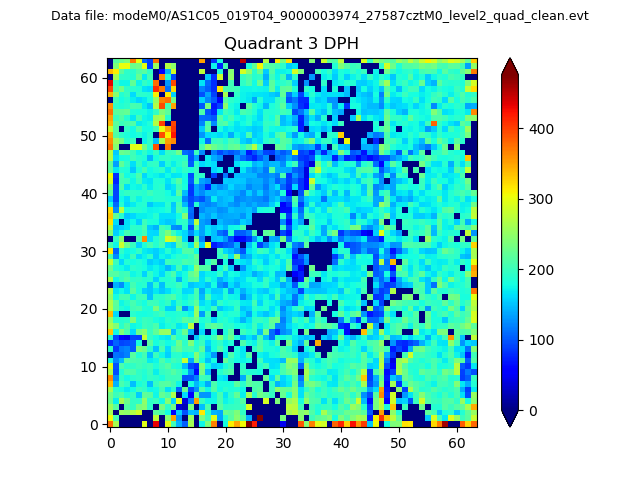 |
 |
Quadrant C |
| Plot type | Count rate plots | Images |
|---|---|---|
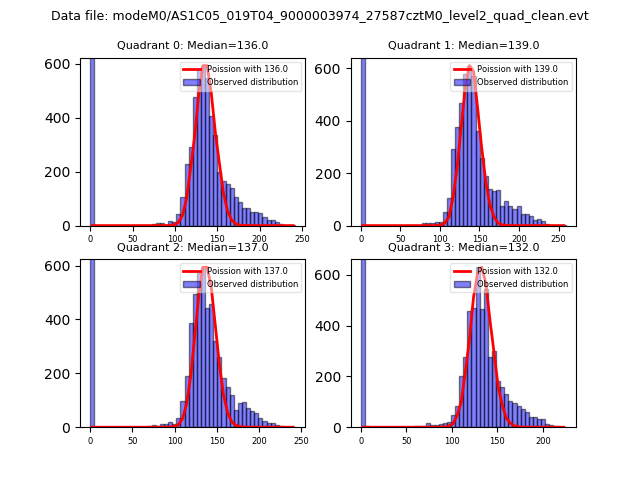
| Comparison with Poisson distribution Blue bars denote a histogram of data divided into 1 sec bins. Red curve is a Poisson curve with rate = median count rate of data. |
 |
 |
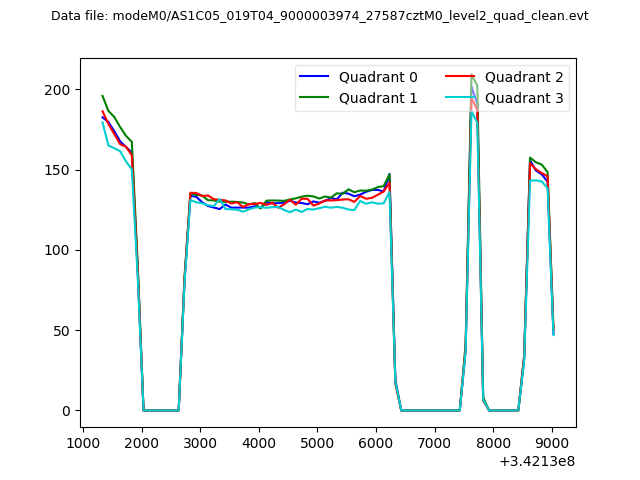
| Quadrant-wise count rates Data is divided into 100 sec bins |
 |
|
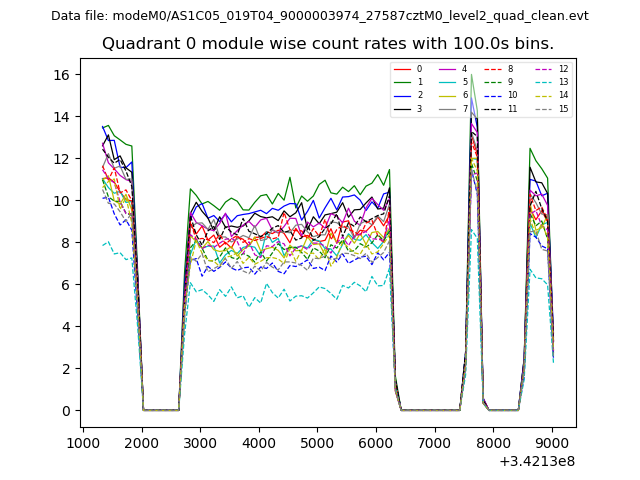
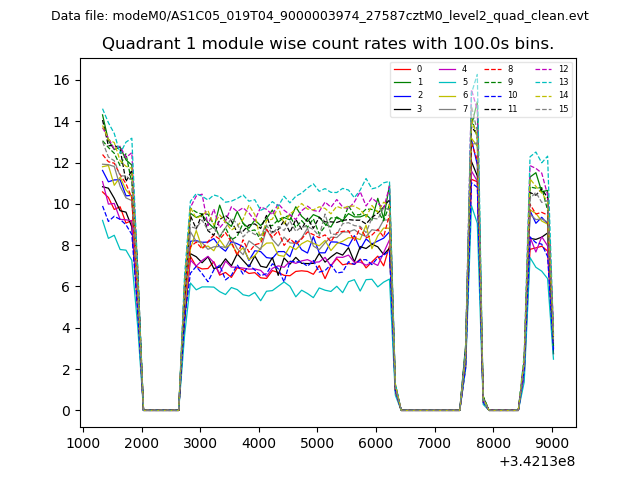
| Module-wise count rates for Quadrant A Data is divided into 100 sec bins |
 |
 |
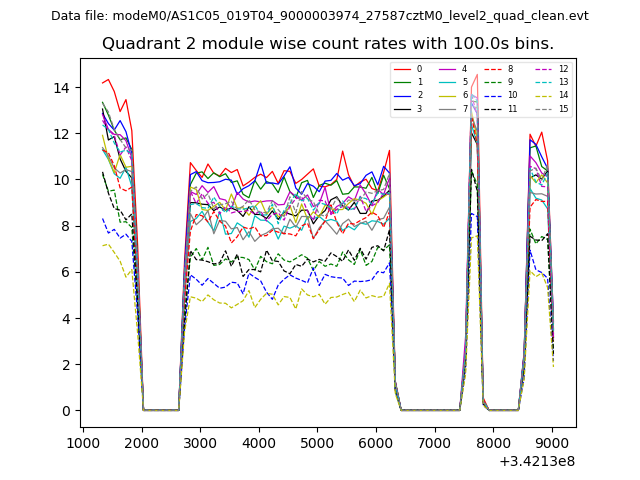
| Module-wise count rates for Quadrant B Data is divided into 100 sec bins |
 |
 |
| Module-wise count rates for Quadrant C Data is divided into 100 sec bins |
 |
 |
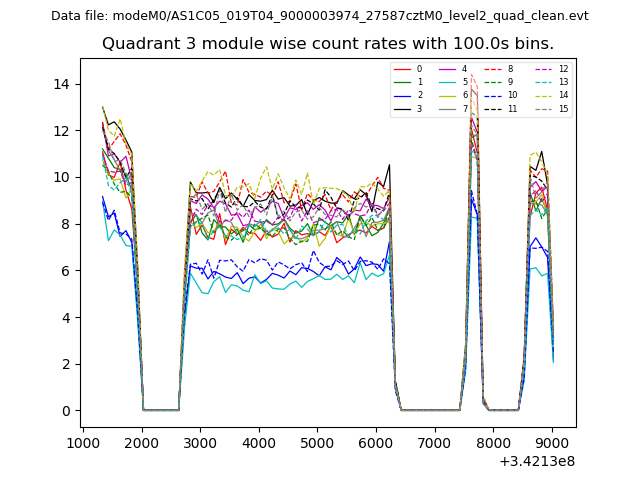
| Module-wise count rates for Quadrant D Data is divided into 100 sec bins |
 |
 |
| Parameter | Plot |
|---|---|
| CZT HV Monitor | 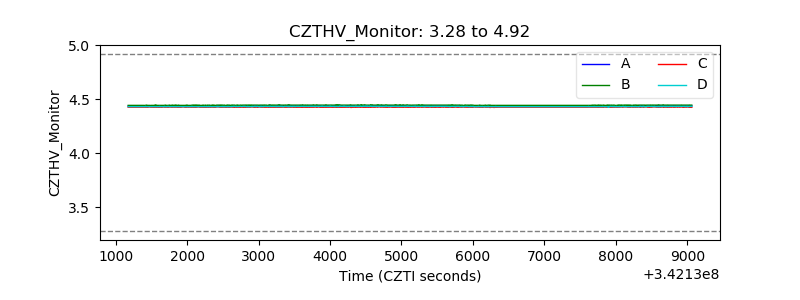 |
| D_VDD | 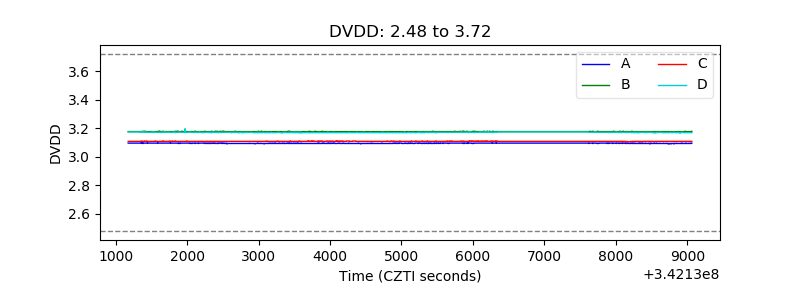 |
| Temperature 1 | 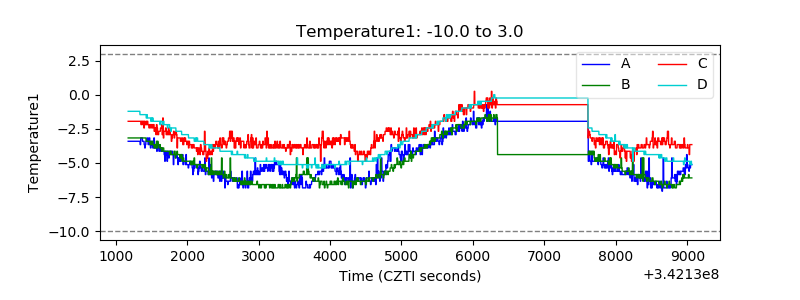 |
| Veto HV Monitor | 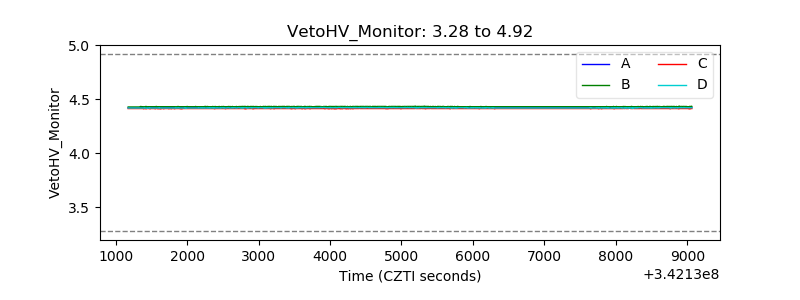 |
| Veto LLD | 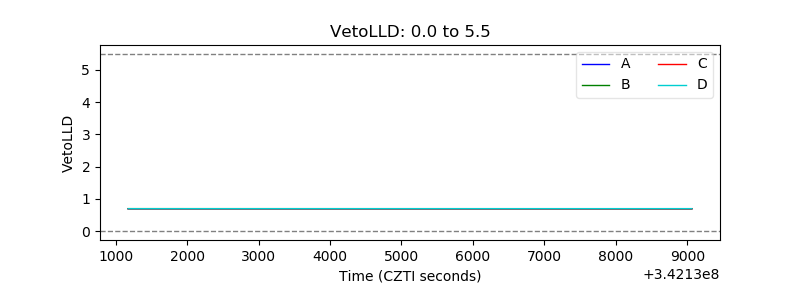 |
| Alpha Counter | 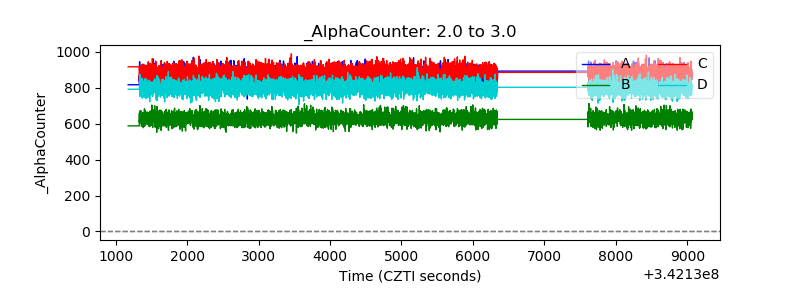 |
| _CPM_Rate | 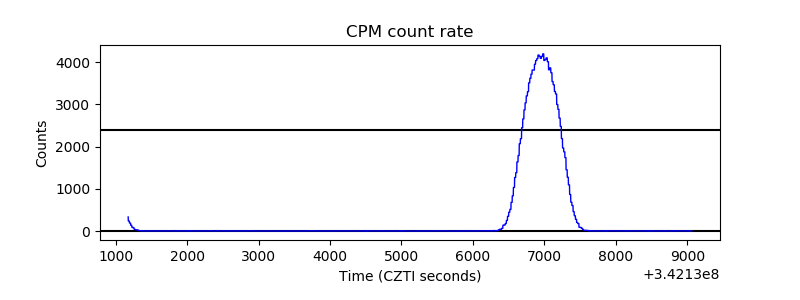 |
| CZT Counter | 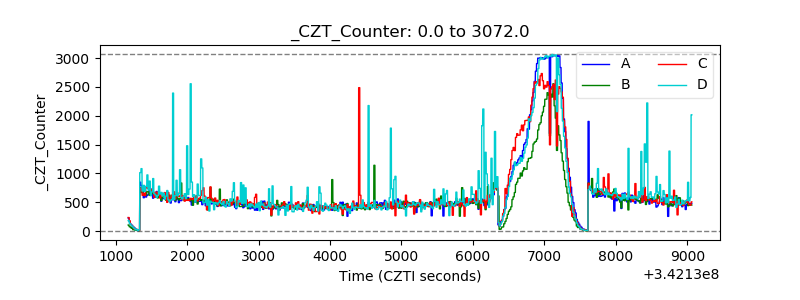 |
| +2.5 Volts monitor |  |
| +5 Volts monitor |  |
| _ROLL_ROT |  |
| _Roll_DEC | 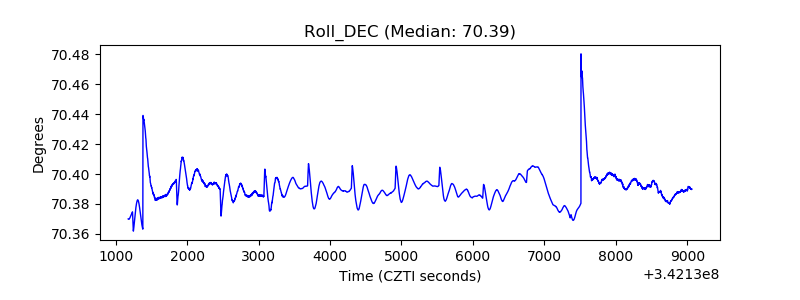 |
| _Roll_RA | 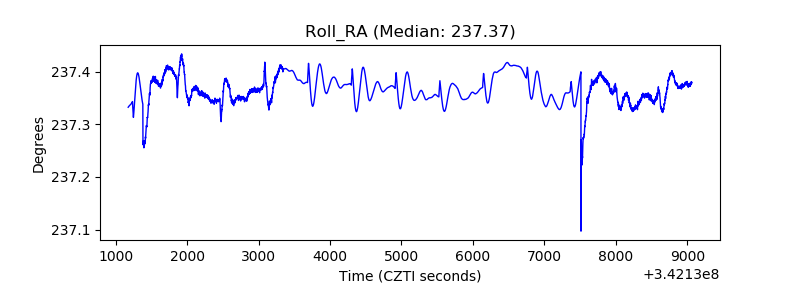 |
| Veto Counter | 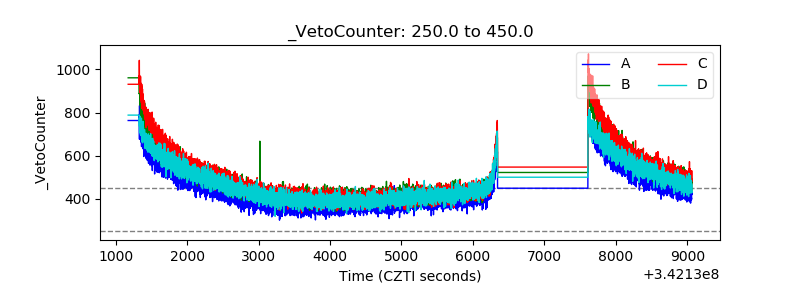 |