| Param | Original file | Final file |
|---|---|---|
| Filename | modeM0/AS1C05_019T04_9000003974_27588cztM0_level2.evt | modeM0/AS1C05_019T04_9000003974_27588cztM0_level2_quad_clean.evt |
| Size (bytes) | 481,573,440 | 109,065,600 |
| Size | 459.3 MB | 104.0 MB |
| Events in quadrant A | 3,213,923 | 719,776 |
| Events in quadrant B | 3,328,395 | 742,117 |
| Events in quadrant C | 3,326,206 | 714,148 |
| Events in quadrant D | 4,282,256 | 681,308 |
| Mode M9 | |||
|---|---|---|---|
| Quadrant | BADHDUFLAG | Total packets | Discarded packets |
| A | 0 | 22 | 0 |
| B | 0 | 22 | 0 |
| C | 0 | 22 | 0 |
| D | 0 | 22 | 0 |
| Mode M0 | |||
|---|---|---|---|
| Quadrant | BADHDUFLAG | Total packets | Discarded packets |
| A | 0 | 13631 | 0 |
| B | 0 | 14001 | 0 |
| C | 0 | 14007 | 0 |
| D | 0 | 17213 | 0 |
| Quadrant | Total seconds | Saturated seconds | Saturation percentage |
|---|---|---|---|
| A | 6389 | 29 | 0.453905% |
| B | 6389 | 38 | 0.594772% |
| C | 6389 | 80 | 1.252152% |
| D | 6389 | 153 | 2.394741% |
Noise dominated data is calculated using 1-second bins in cleaned event files. If a bin has >2000 counts, and if more than 50% of those come from <1% of pixels, then it is considered to be noise-dominated and hence unusable.
| Quadrant | # 1 sec bins | Bins with >0 counts | Bins with >2000 counts | High rate bins dominated by noise | Noise dominated (total time) | Noise dominated (detector-on time) | Marked lightcurve |
|---|---|---|---|---|---|---|---|
| A | 7745 | 6390 | 5 | 5 | 0.06% | 0.08% | 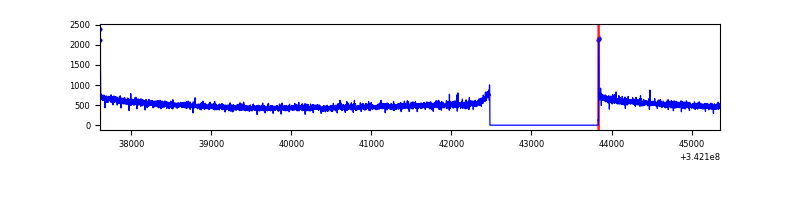 |
| B | 7745 | 6390 | 1 | 1 | 0.01% | 0.02% | 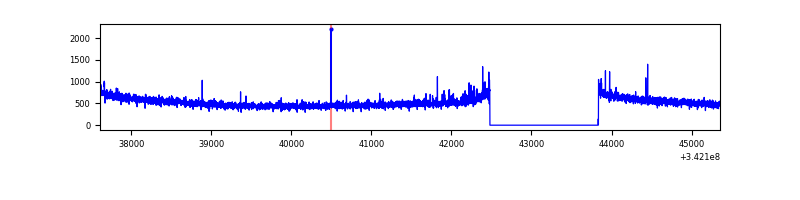 |
| C | 7745 | 6390 | 1 | 1 | 0.01% | 0.02% | 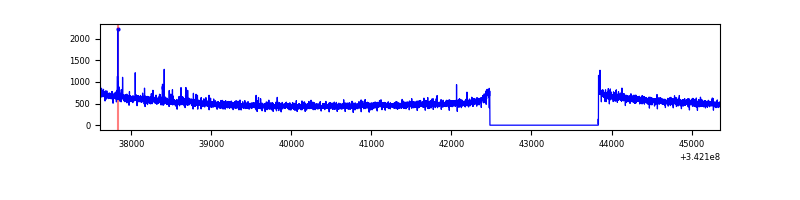 |
| D | 7745 | 6390 | 137 | 137 | 1.77% | 2.14% | 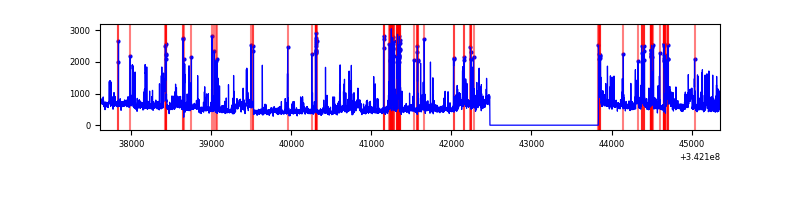 |
Top three noisy pixels from each quadrant. If the there are fewer than three noisy pixels in the level2.evt file, extra rows are filled as -1
| Pixel properties | Quadrant properties | ||||||
|---|---|---|---|---|---|---|---|
| Quadrant | DetID | PixID | Counts | Sigma | Mean | Median | Sigma |
| A | 8 | 192 | 14917 | 86.63 | 829 | 814 | 162.8 |
| A | 13 | 254 | 11775 | 67.33 | 829 | 814 | 162.8 |
| A | 3 | 137 | 7145 | 38.89 | 829 | 814 | 162.8 |
| B | 0 | 230 | 18649 | 115.35 | 836 | 818 | 154.6 |
| B | 12 | 111 | 18487 | 114.3 | 836 | 818 | 154.6 |
| B | 15 | 32 | 17830 | 110.05 | 836 | 818 | 154.6 |
| C | 14 | 238 | 134164 | 718.18 | 809 | 817 | 185.7 |
| C | 2 | 16 | 22373 | 116.1 | 809 | 817 | 185.7 |
| C | 1 | 16 | 6593 | 31.11 | 809 | 817 | 185.7 |
| D | 1 | 52 | 1130672 | 6033.55 | 797 | 778 | 187.3 |
| D | 2 | 250 | 81966 | 433.54 | 797 | 778 | 187.3 |
| D | 2 | 234 | 25958 | 134.46 | 797 | 778 | 187.3 |
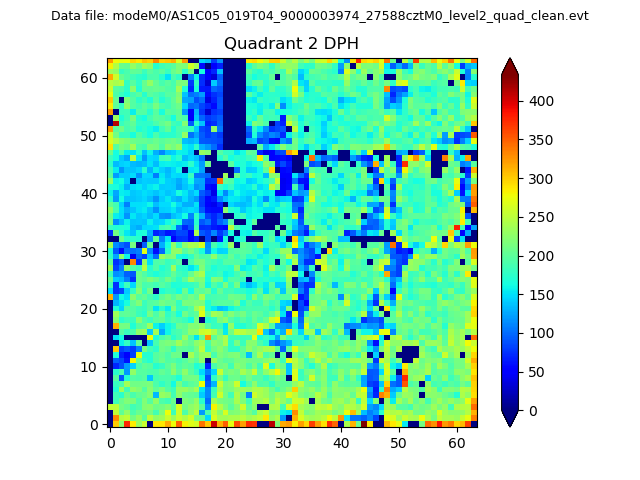
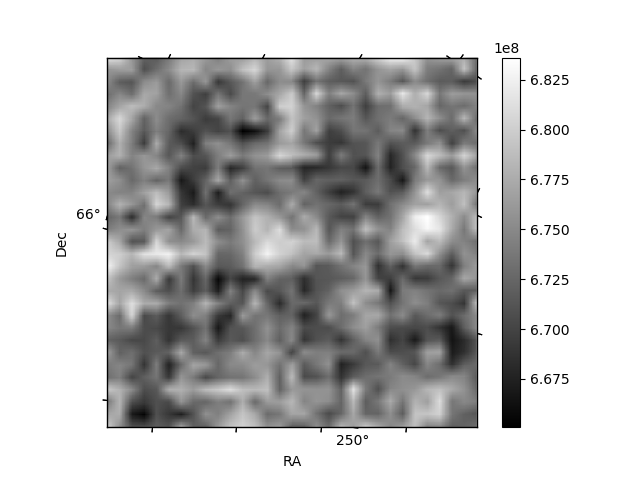
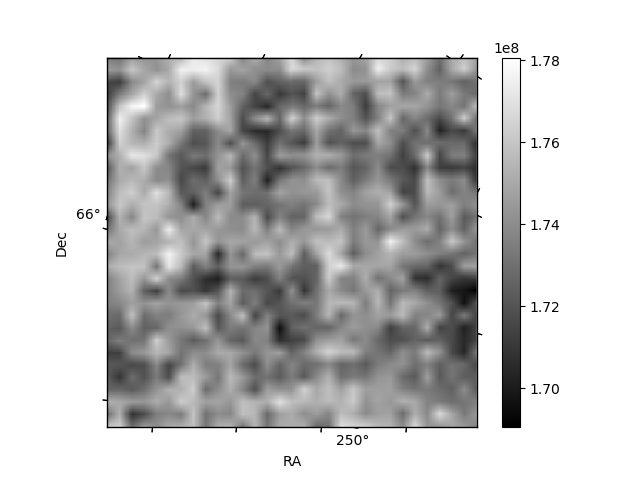
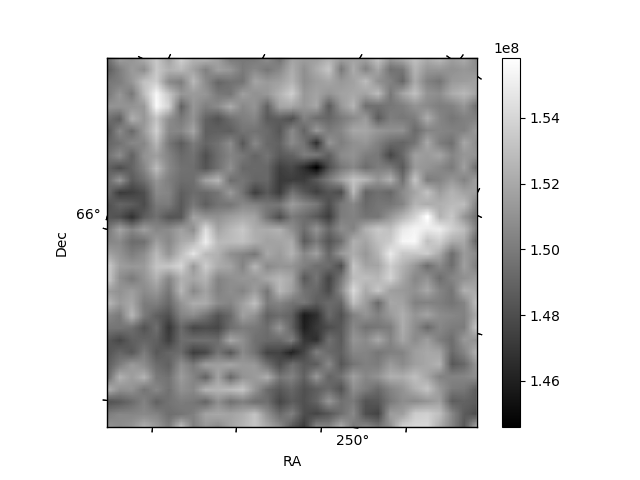
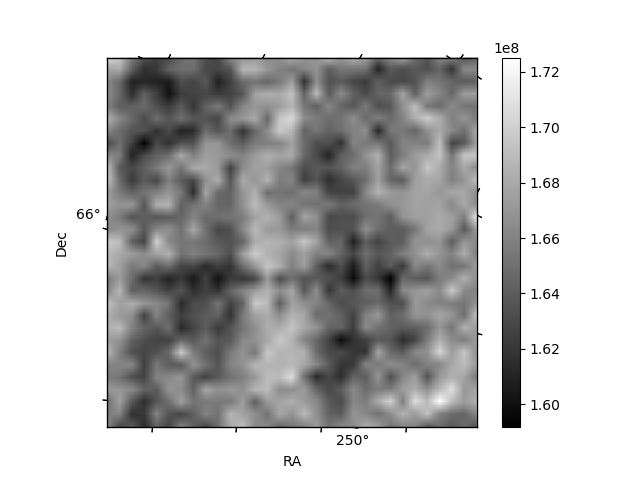
Histogram calculated using DETX and DETY for each event in the final _common_clean file
| Quadrant A | 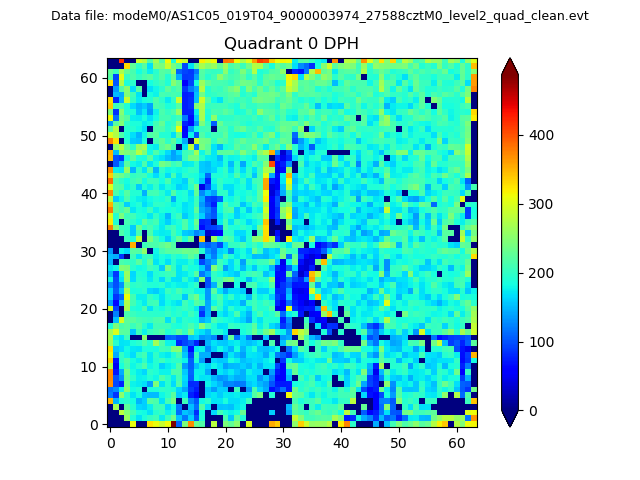 |
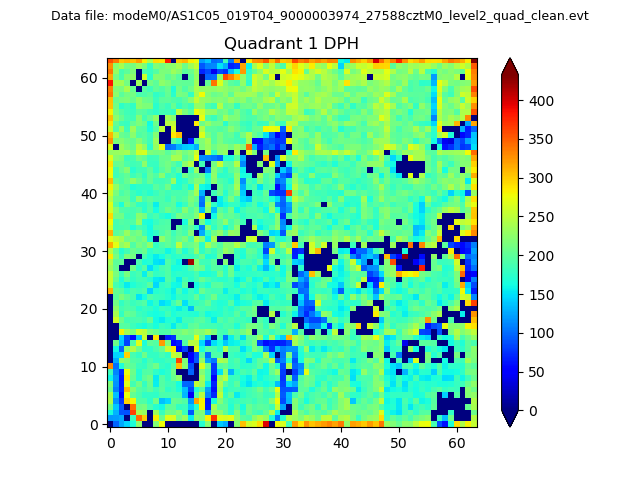 |
Quadrant B |
|---|---|---|---|
| Quadrant D | 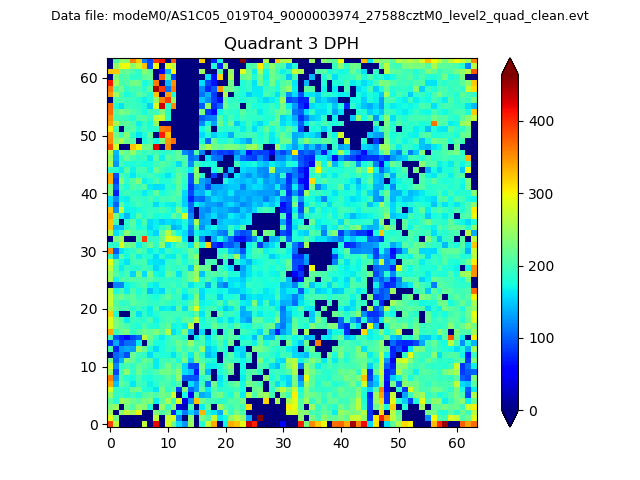 |
 |
Quadrant C |
| Plot type | Count rate plots | Images |
|---|---|---|
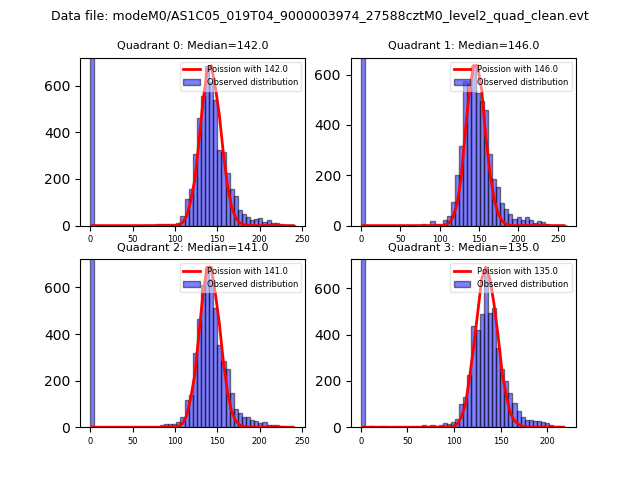
| Comparison with Poisson distribution Blue bars denote a histogram of data divided into 1 sec bins. Red curve is a Poisson curve with rate = median count rate of data. |
 |
 |
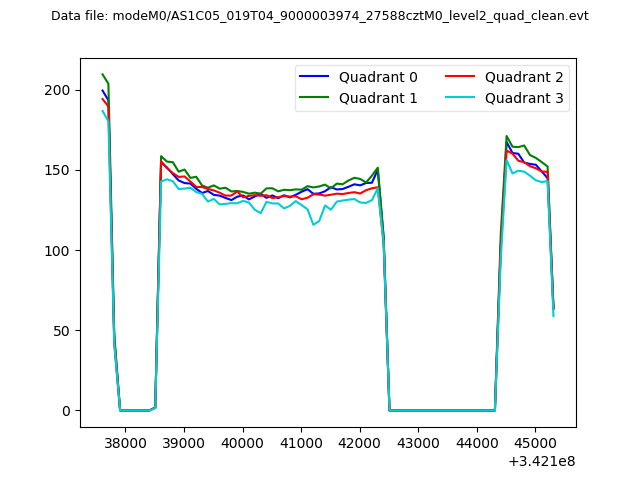
| Quadrant-wise count rates Data is divided into 100 sec bins |
 |
|
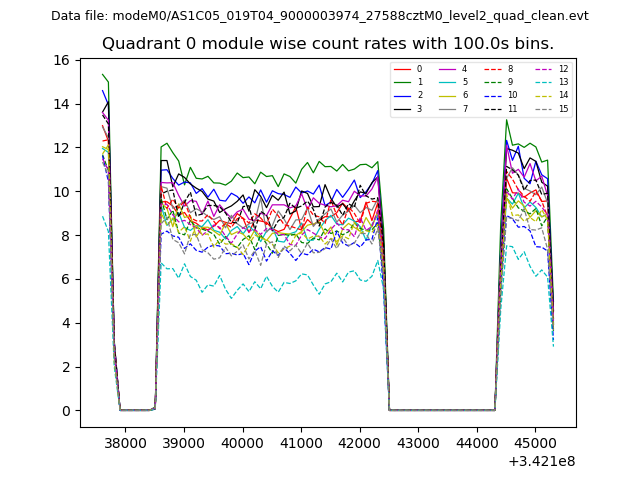
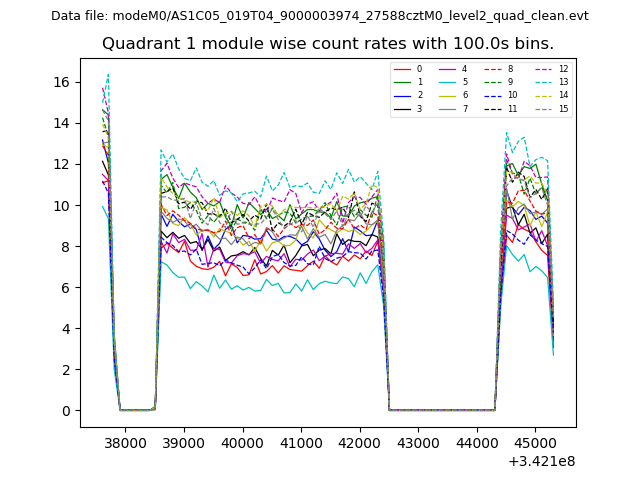
| Module-wise count rates for Quadrant A Data is divided into 100 sec bins |
 |
 |
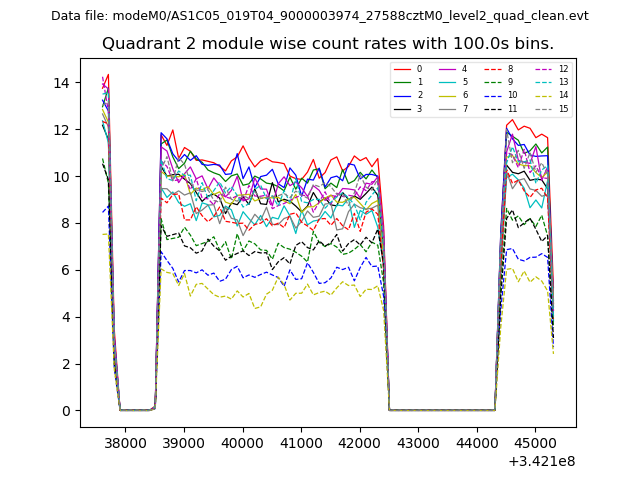
| Module-wise count rates for Quadrant B Data is divided into 100 sec bins |
 |
 |
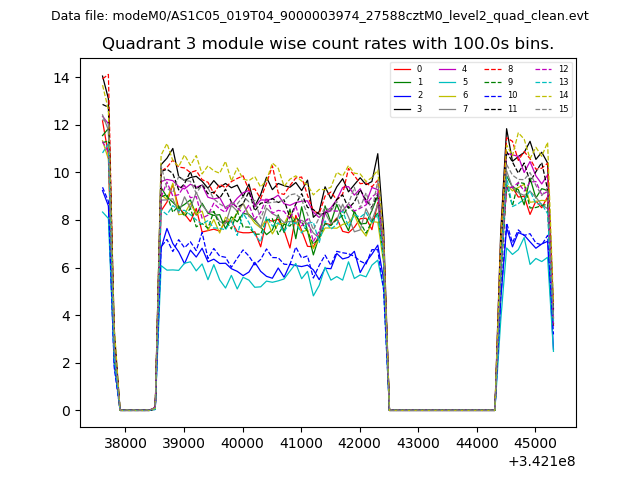
| Module-wise count rates for Quadrant C Data is divided into 100 sec bins |
 |
 |
| Module-wise count rates for Quadrant D Data is divided into 100 sec bins |
 |
 |
| Parameter | Plot |
|---|---|
| CZT HV Monitor | 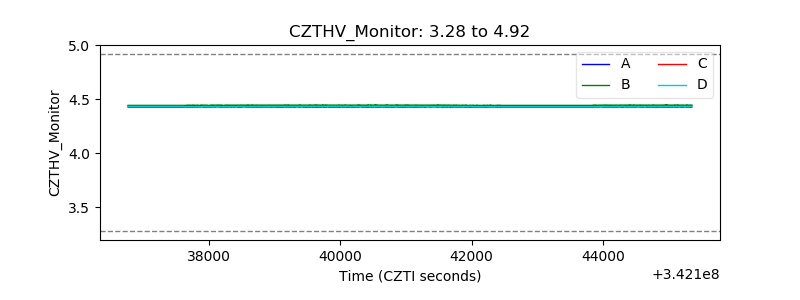 |
| D_VDD | 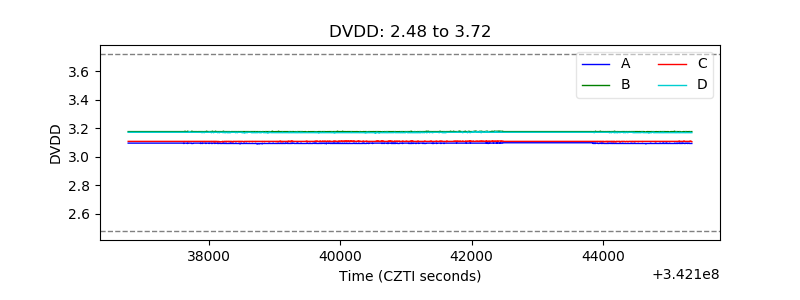 |
| Temperature 1 |  |
| Veto HV Monitor | 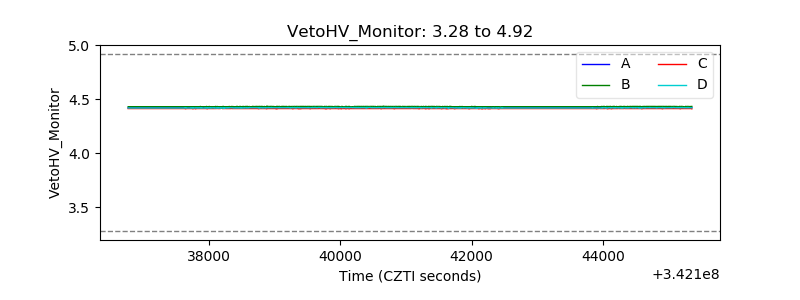 |
| Veto LLD |  |
| Alpha Counter | 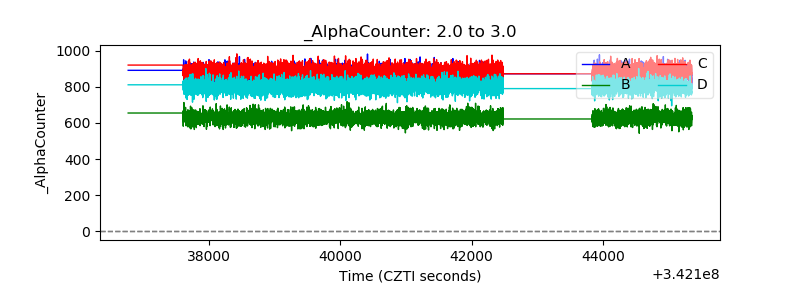 |
| _CPM_Rate | 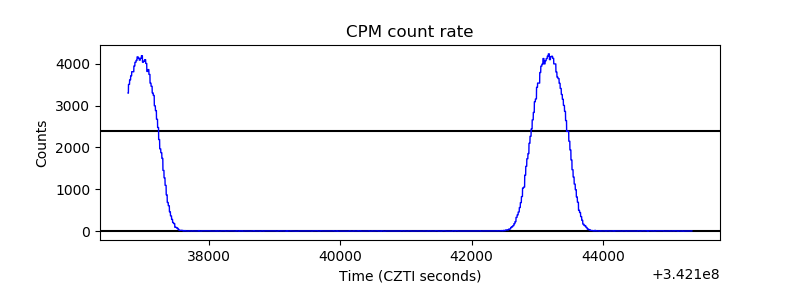 |
| CZT Counter | 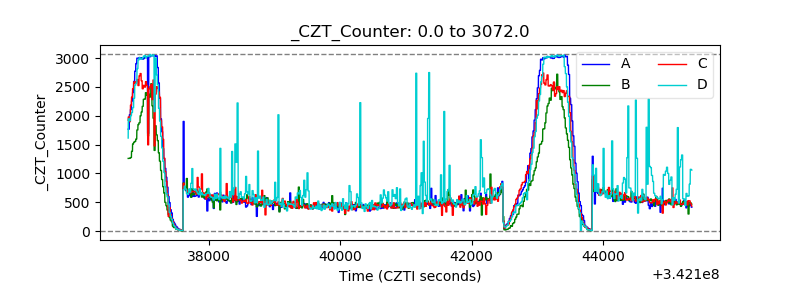 |
| +2.5 Volts monitor |  |
| +5 Volts monitor |  |
| _ROLL_ROT | 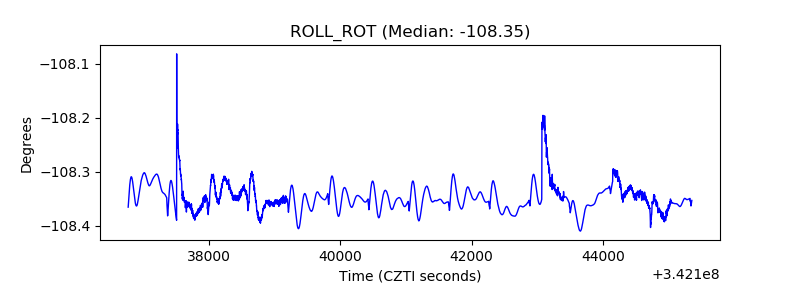 |
| _Roll_DEC |  |
| _Roll_RA | 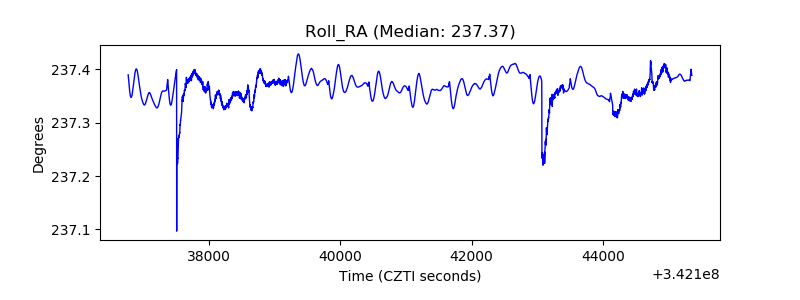 |
| Veto Counter |  |