| Param | Original file | Final file |
|---|---|---|
| Filename | modeM0/AS1C05_019T04_9000003974_27589cztM0_level2.evt | modeM0/AS1C05_019T04_9000003974_27589cztM0_level2_quad_clean.evt |
| Size (bytes) | 489,386,880 | 120,862,080 |
| Size | 466.7 MB | 115.3 MB |
| Events in quadrant A | 3,240,816 | 817,515 |
| Events in quadrant B | 3,340,257 | 840,060 |
| Events in quadrant C | 3,339,780 | 798,081 |
| Events in quadrant D | 4,465,392 | 758,033 |
| Mode M9 | |||
|---|---|---|---|
| Quadrant | BADHDUFLAG | Total packets | Discarded packets |
| A | 0 | 20 | 0 |
| B | 0 | 21 | 0 |
| C | 0 | 21 | 0 |
| D | 0 | 21 | 0 |
| Mode M0 | |||
|---|---|---|---|
| Quadrant | BADHDUFLAG | Total packets | Discarded packets |
| A | 0 | 13619 | 0 |
| B | 0 | 13991 | 0 |
| C | 0 | 13977 | 0 |
| D | 0 | 17630 | 0 |
| Quadrant | Total seconds | Saturated seconds | Saturation percentage |
|---|---|---|---|
| A | 6400 | 67 | 1.046875% |
| B | 6400 | 71 | 1.109375% |
| C | 6400 | 119 | 1.859375% |
| D | 6400 | 270 | 4.218750% |
Noise dominated data is calculated using 1-second bins in cleaned event files. If a bin has >2000 counts, and if more than 50% of those come from <1% of pixels, then it is considered to be noise-dominated and hence unusable.
| Quadrant | # 1 sec bins | Bins with >0 counts | Bins with >2000 counts | High rate bins dominated by noise | Noise dominated (total time) | Noise dominated (detector-on time) | Marked lightcurve |
|---|---|---|---|---|---|---|---|
| A | 7760 | 6401 | 4 | 4 | 0.05% | 0.06% | 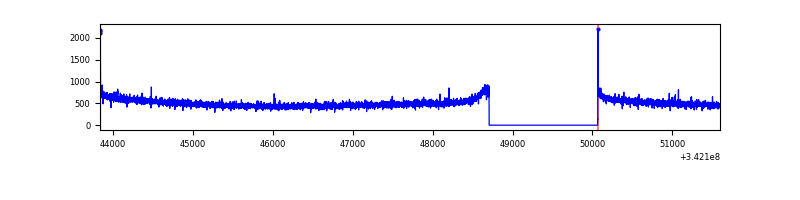 |
| B | 7760 | 6401 | 0 | 0 | 0.00% | 0.00% | 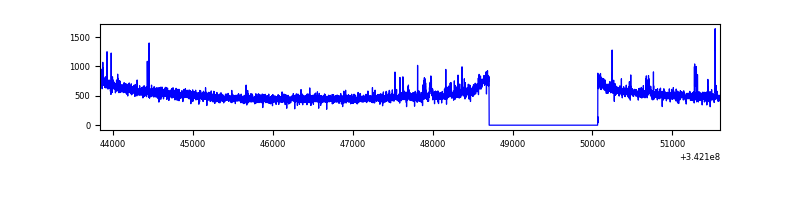 |
| C | 7760 | 6401 | 0 | 0 | 0.00% | 0.00% | 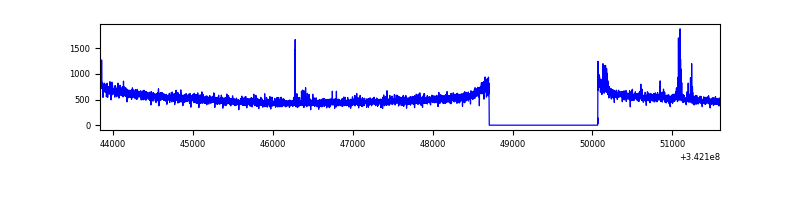 |
| D | 7760 | 6401 | 135 | 135 | 1.74% | 2.11% | 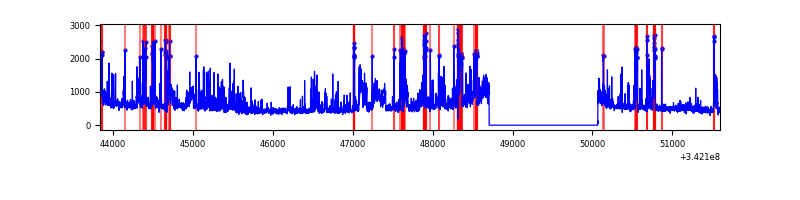 |
Top three noisy pixels from each quadrant. If the there are fewer than three noisy pixels in the level2.evt file, extra rows are filled as -1
| Pixel properties | Quadrant properties | ||||||
|---|---|---|---|---|---|---|---|
| Quadrant | DetID | PixID | Counts | Sigma | Mean | Median | Sigma |
| A | 8 | 192 | 14697 | 83.93 | 836 | 822 | 165.3 |
| A | 13 | 254 | 10990 | 61.51 | 836 | 822 | 165.3 |
| A | 3 | 137 | 7432 | 39.98 | 836 | 822 | 165.3 |
| B | 12 | 111 | 18450 | 113.86 | 839 | 820 | 154.8 |
| B | 15 | 32 | 18076 | 111.45 | 839 | 820 | 154.8 |
| B | 11 | 111 | 16616 | 102.02 | 839 | 820 | 154.8 |
| C | 14 | 238 | 132867 | 714.42 | 804 | 811 | 184.8 |
| C | 2 | 16 | 58771 | 313.56 | 804 | 811 | 184.8 |
| C | 1 | 16 | 6057 | 28.38 | 804 | 811 | 184.8 |
| D | 1 | 52 | 1324676 | 7206.91 | 789 | 772 | 183.7 |
| D | 2 | 250 | 93121 | 502.72 | 789 | 772 | 183.7 |
| D | 7 | 80 | 24969 | 131.72 | 789 | 772 | 183.7 |
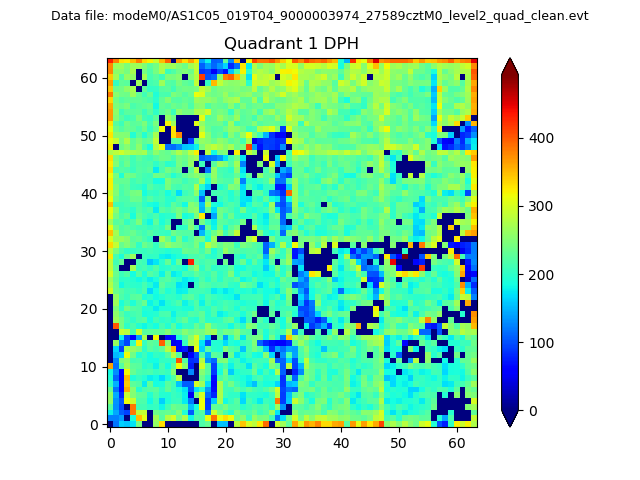
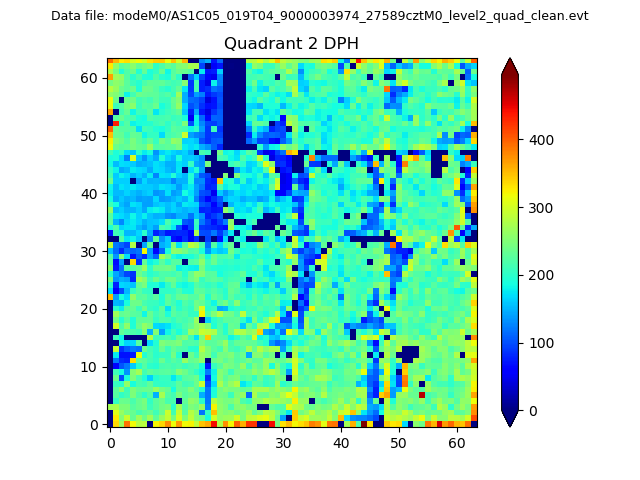
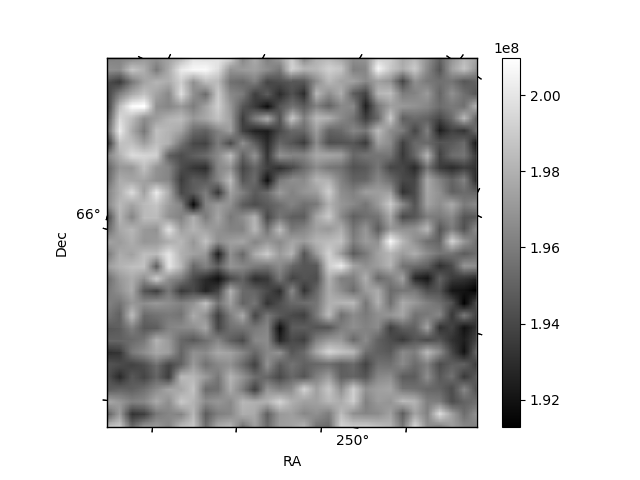
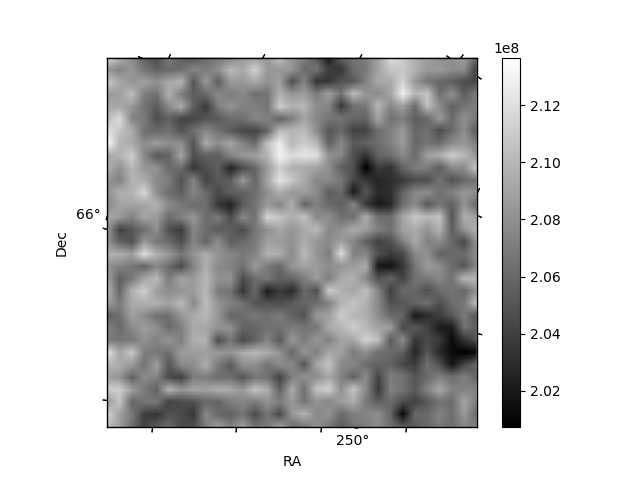
Histogram calculated using DETX and DETY for each event in the final _common_clean file
| Quadrant A |  |
 |
Quadrant B |
|---|---|---|---|
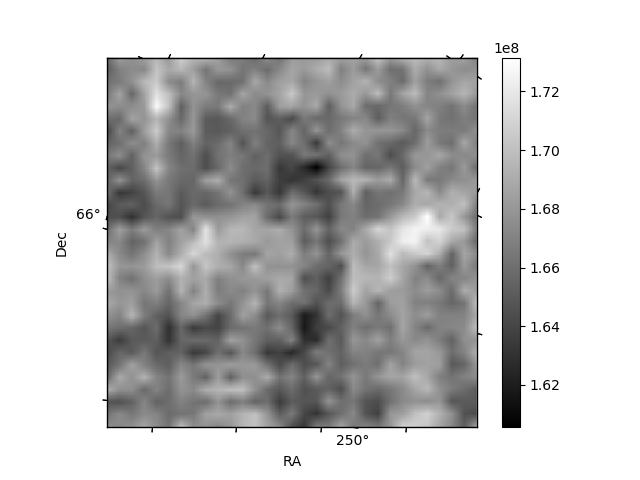
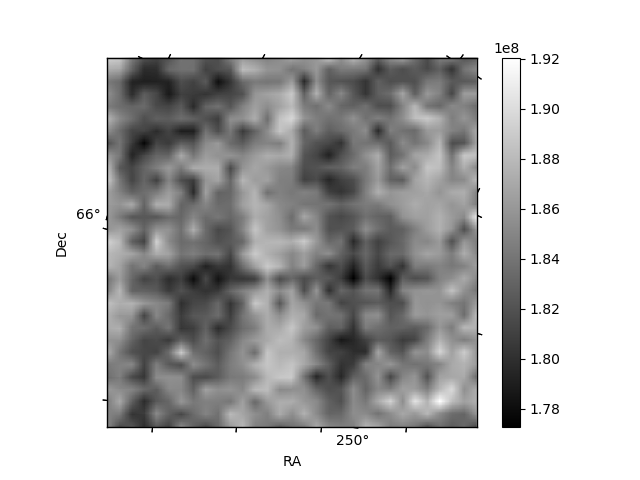
| Quadrant D |  |
 |
Quadrant C |
| Plot type | Count rate plots | Images |
|---|---|---|
| Comparison with Poisson distribution Blue bars denote a histogram of data divided into 1 sec bins. Red curve is a Poisson curve with rate = median count rate of data. |
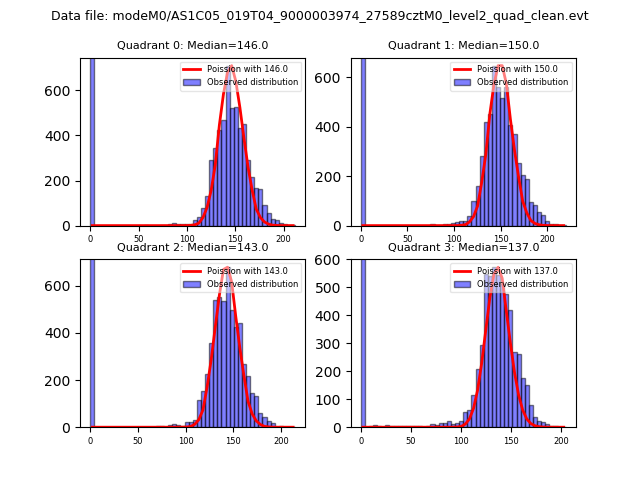 |
 |
| Quadrant-wise count rates Data is divided into 100 sec bins |
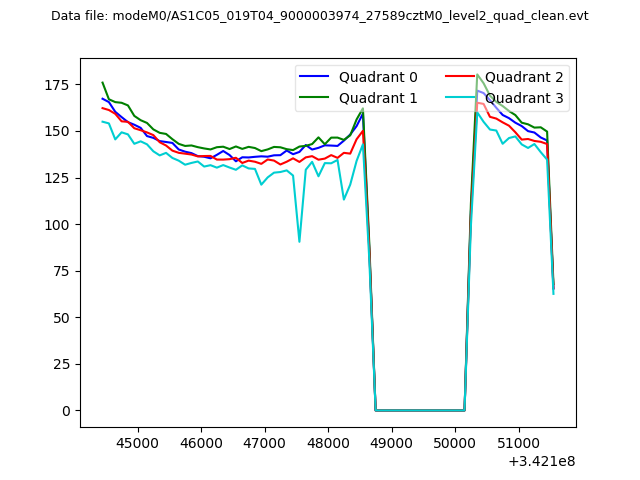 |
|
| Module-wise count rates for Quadrant A Data is divided into 100 sec bins |
 |
 |
| Module-wise count rates for Quadrant B Data is divided into 100 sec bins |
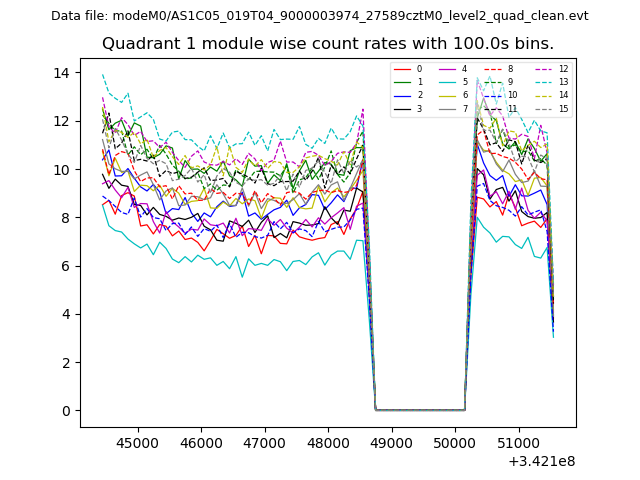 |
 |
| Module-wise count rates for Quadrant C Data is divided into 100 sec bins |
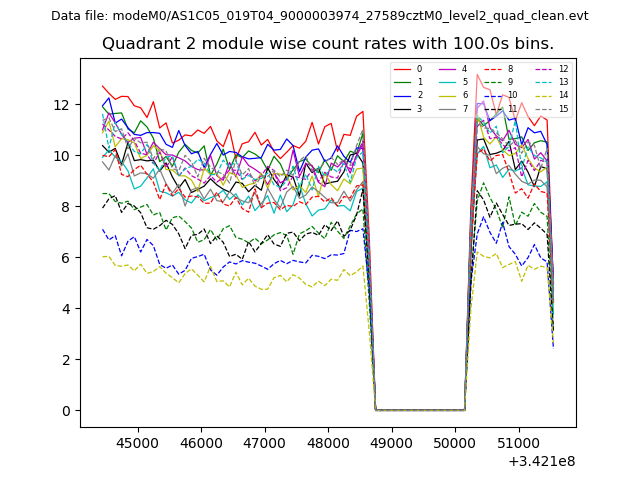 |
 |
| Module-wise count rates for Quadrant D Data is divided into 100 sec bins |
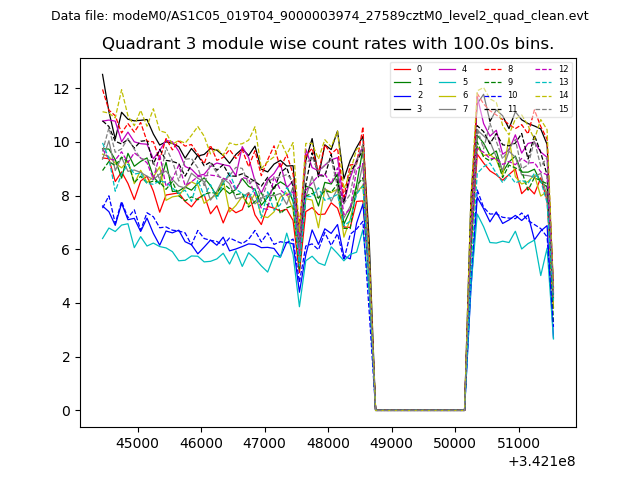 |
 |
| Parameter | Plot |
|---|---|
| CZT HV Monitor | 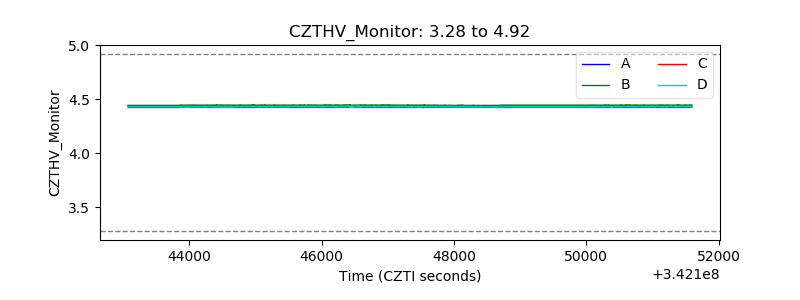 |
| D_VDD | 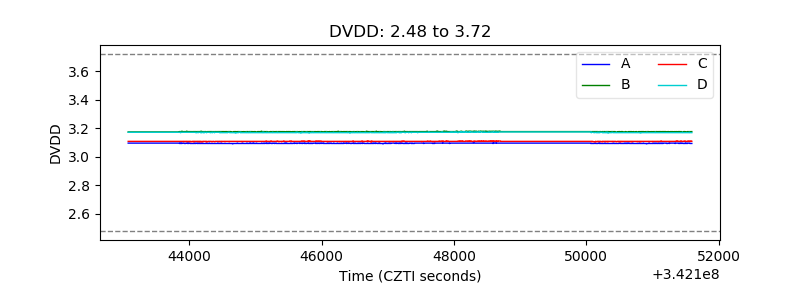 |
| Temperature 1 | 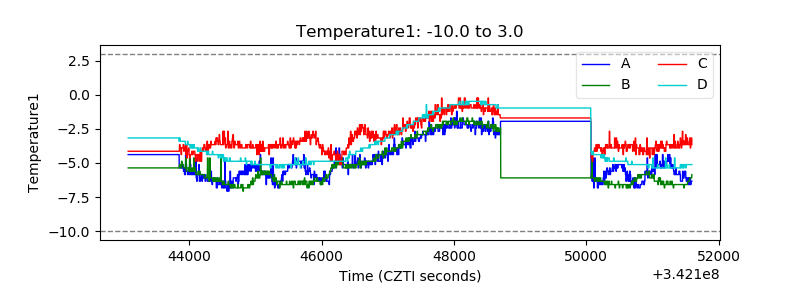 |
| Veto HV Monitor | 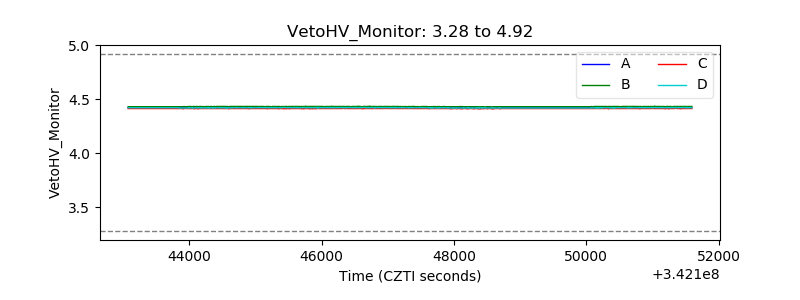 |
| Veto LLD | 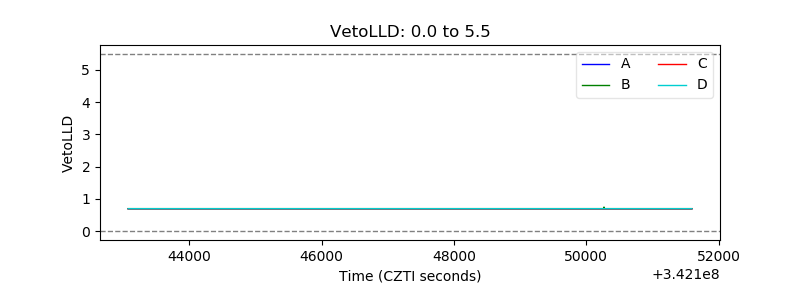 |
| Alpha Counter | 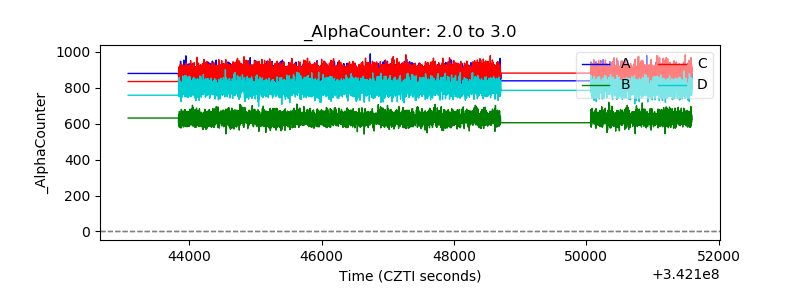 |
| _CPM_Rate | 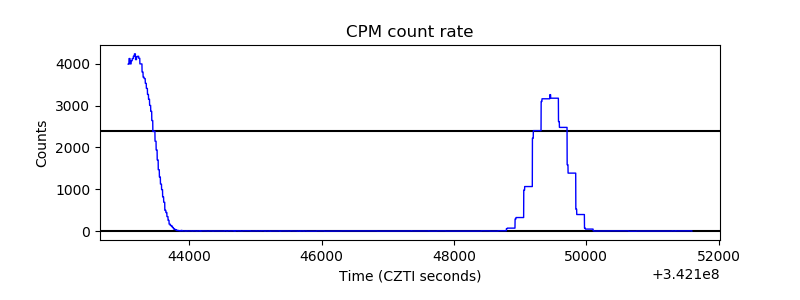 |
| CZT Counter | 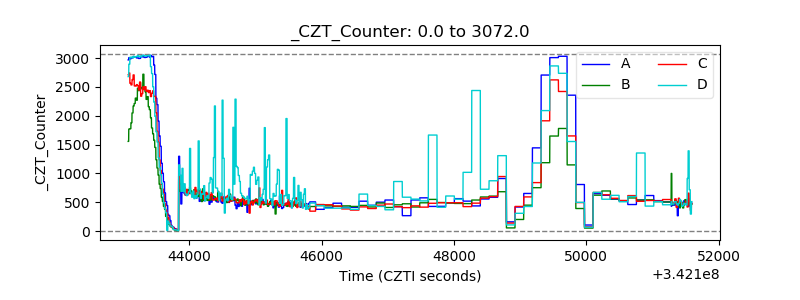 |
| +2.5 Volts monitor |  |
| +5 Volts monitor | 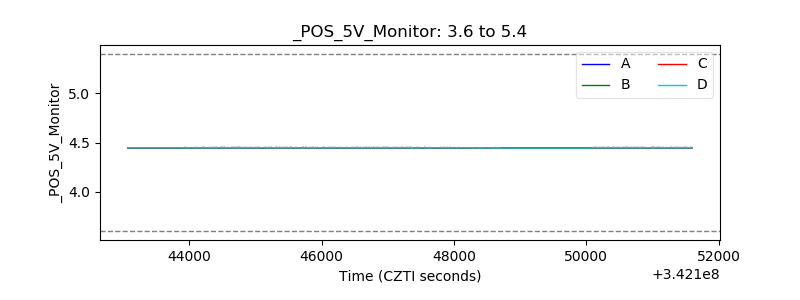 |
| _ROLL_ROT | 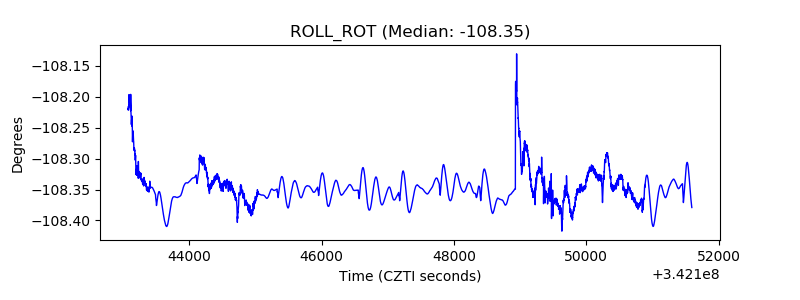 |
| _Roll_DEC | 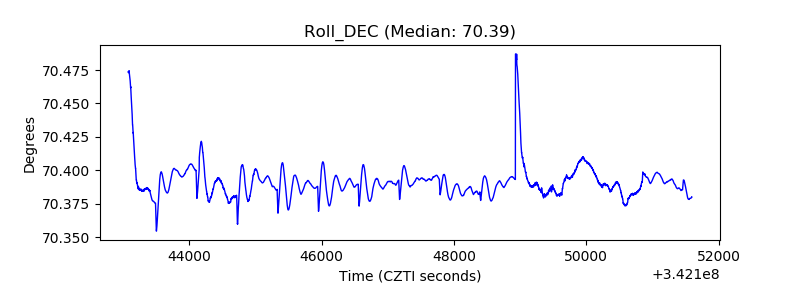 |
| _Roll_RA | 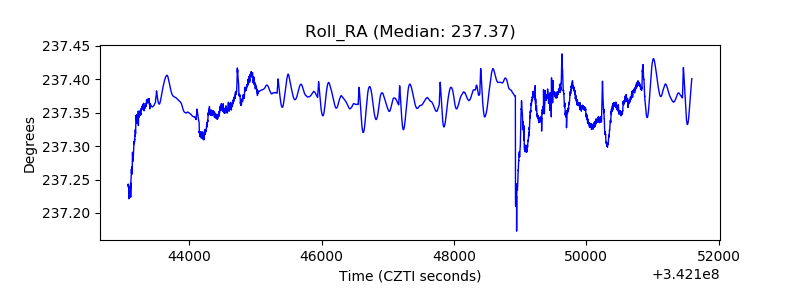 |
| Veto Counter | 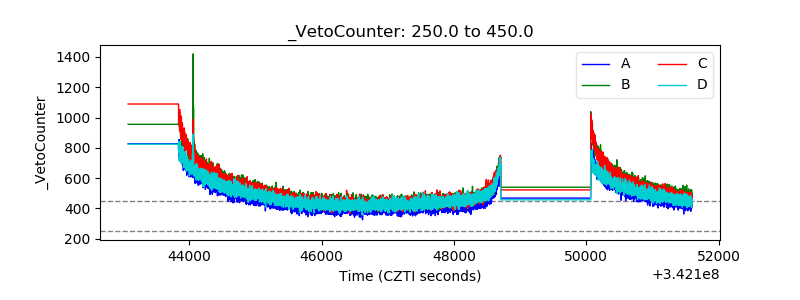 |