| Param | Original file | Final file |
|---|---|---|
| Filename | modeM0/AS1C05_019T04_9000003974_27590cztM0_level2.evt | modeM0/AS1C05_019T04_9000003974_27590cztM0_level2_quad_clean.evt |
| Size (bytes) | 454,150,080 | 123,886,080 |
| Size | 433.1 MB | 118.1 MB |
| Events in quadrant A | 2,880,644 | 856,700 |
| Events in quadrant B | 2,987,076 | 876,448 |
| Events in quadrant C | 3,014,865 | 822,926 |
| Events in quadrant D | 4,469,633 | 782,865 |
| Mode M9 | |||
|---|---|---|---|
| Quadrant | BADHDUFLAG | Total packets | Discarded packets |
| A | 0 | 14 | 0 |
| B | 0 | 14 | 0 |
| C | 0 | 14 | 0 |
| D | 0 | 14 | 0 |
| Mode M0 | |||
|---|---|---|---|
| Quadrant | BADHDUFLAG | Total packets | Discarded packets |
| A | 0 | 12227 | 0 |
| B | 0 | 12492 | 0 |
| C | 0 | 12637 | 0 |
| D | 0 | 17349 | 0 |
| Quadrant | Total seconds | Saturated seconds | Saturation percentage |
|---|---|---|---|
| A | 5921 | 38 | 0.641783% |
| B | 5922 | 56 | 0.945626% |
| C | 5922 | 125 | 2.110773% |
| D | 5922 | 335 | 5.656873% |
Noise dominated data is calculated using 1-second bins in cleaned event files. If a bin has >2000 counts, and if more than 50% of those come from <1% of pixels, then it is considered to be noise-dominated and hence unusable.
| Quadrant | # 1 sec bins | Bins with >0 counts | Bins with >2000 counts | High rate bins dominated by noise | Noise dominated (total time) | Noise dominated (detector-on time) | Marked lightcurve |
|---|---|---|---|---|---|---|---|
| A | 7281 | 5922 | 1 | 1 | 0.01% | 0.02% | 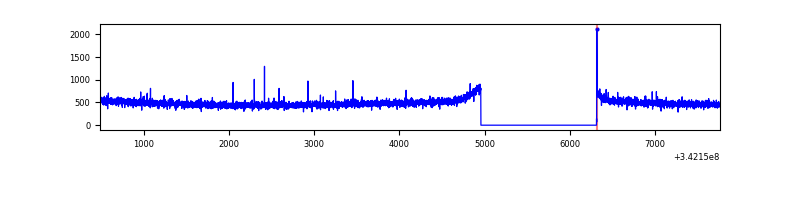 |
| B | 7282 | 5923 | 4 | 4 | 0.05% | 0.07% | 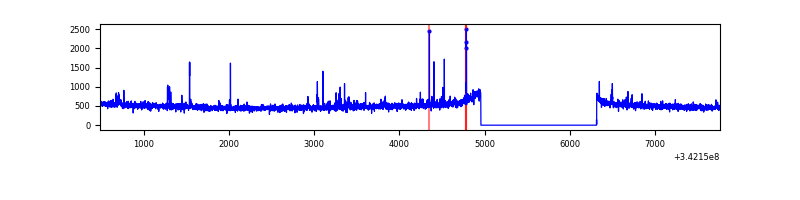 |
| C | 7282 | 5923 | 22 | 22 | 0.30% | 0.37% |  |
| D | 7282 | 5923 | 274 | 274 | 3.76% | 4.63% | 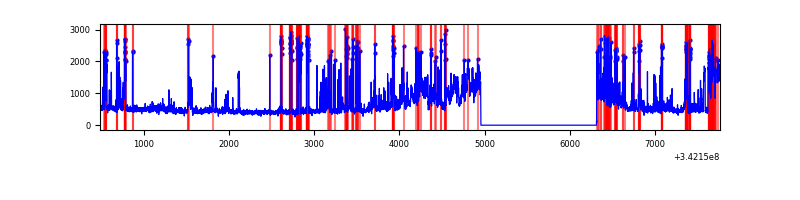 |
Top three noisy pixels from each quadrant. If the there are fewer than three noisy pixels in the level2.evt file, extra rows are filled as -1
| Pixel properties | Quadrant properties | ||||||
|---|---|---|---|---|---|---|---|
| Quadrant | DetID | PixID | Counts | Sigma | Mean | Median | Sigma |
| A | 13 | 254 | 10008 | 62.14 | 745 | 734 | 149.2 |
| A | 3 | 137 | 6519 | 38.76 | 745 | 734 | 149.2 |
| A | 8 | 192 | 6435 | 38.2 | 745 | 734 | 149.2 |
| B | 3 | 64 | 37273 | 263.69 | 740 | 723 | 138.6 |
| B | 0 | 230 | 21598 | 150.6 | 740 | 723 | 138.6 |
| B | 12 | 111 | 16669 | 115.04 | 740 | 723 | 138.6 |
| C | 2 | 16 | 140859 | 862.71 | 704 | 710 | 162.5 |
| C | 14 | 238 | 116272 | 711.36 | 704 | 710 | 162.5 |
| C | 1 | 16 | 8669 | 48.99 | 704 | 710 | 162.5 |
| D | 1 | 52 | 1292057 | 7892.21 | 696 | 679 | 163.6 |
| D | 12 | 227 | 448156 | 2734.74 | 696 | 679 | 163.6 |
| D | 2 | 250 | 64243 | 388.47 | 696 | 679 | 163.6 |
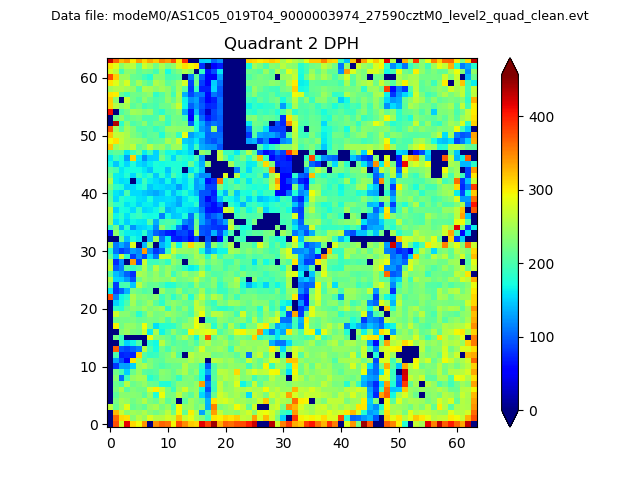
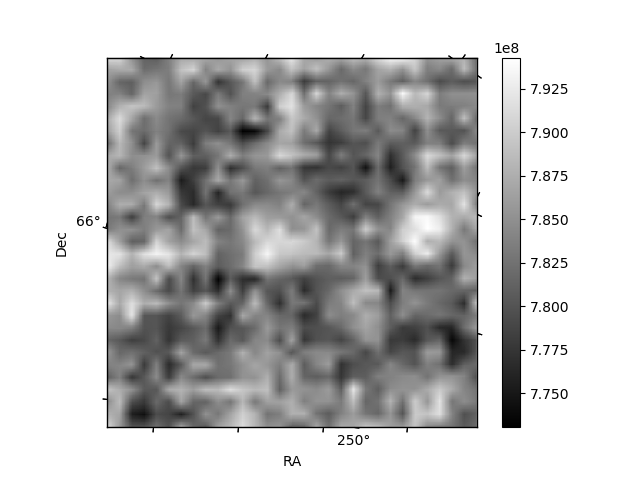
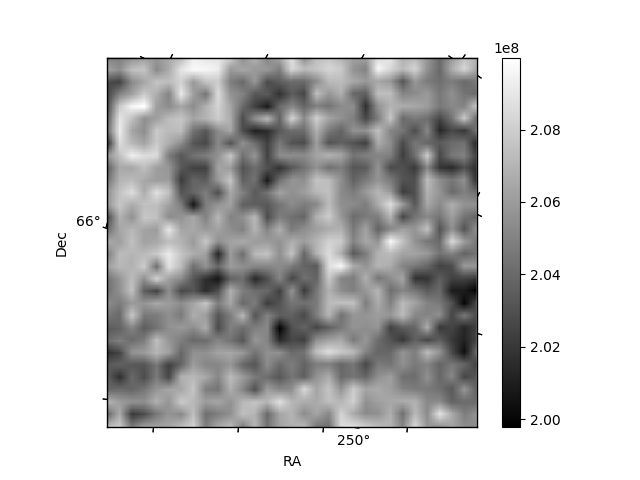
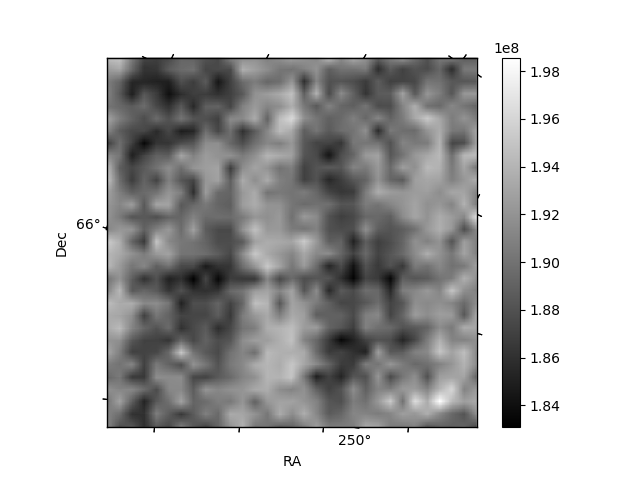
Histogram calculated using DETX and DETY for each event in the final _common_clean file
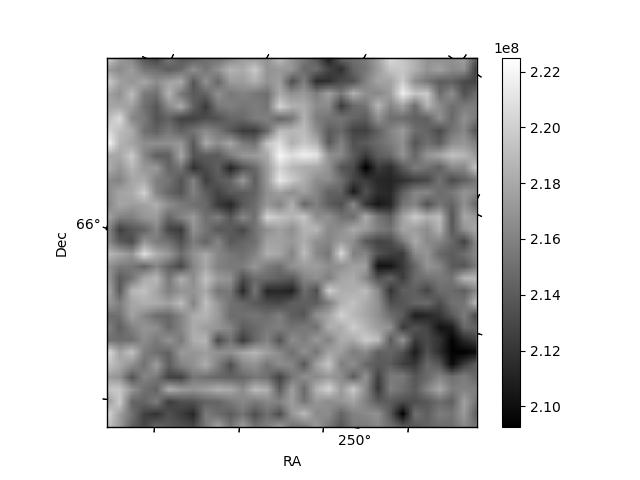
| Quadrant A | 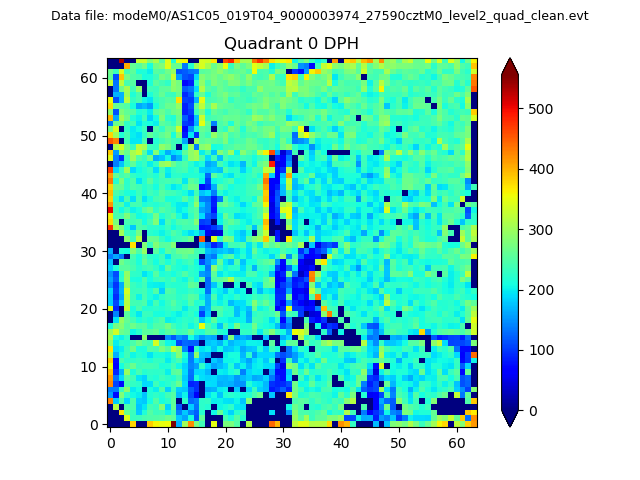 |
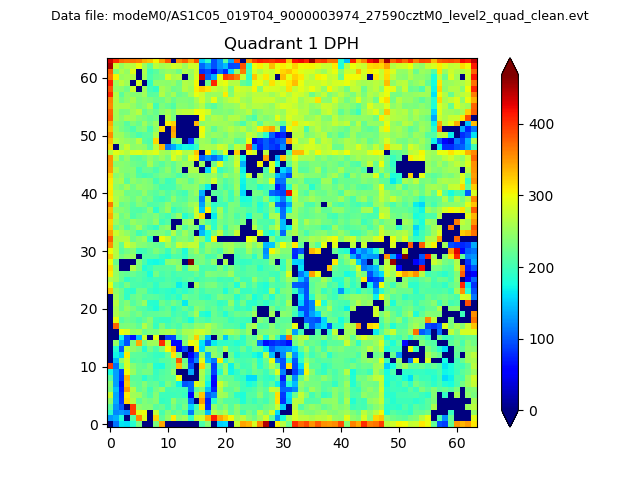 |
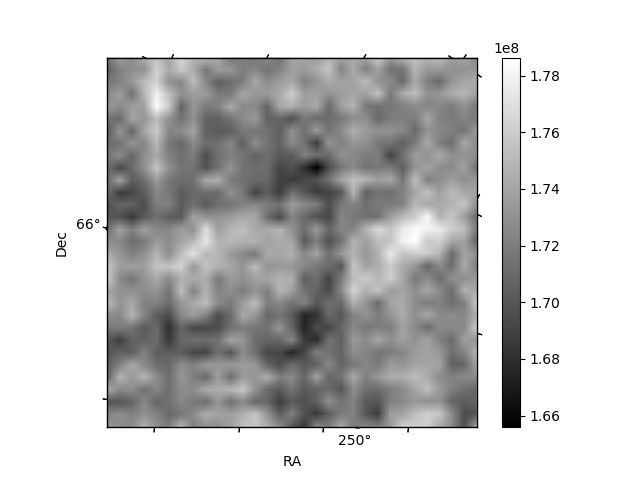
Quadrant B |
|---|---|---|---|
| Quadrant D | 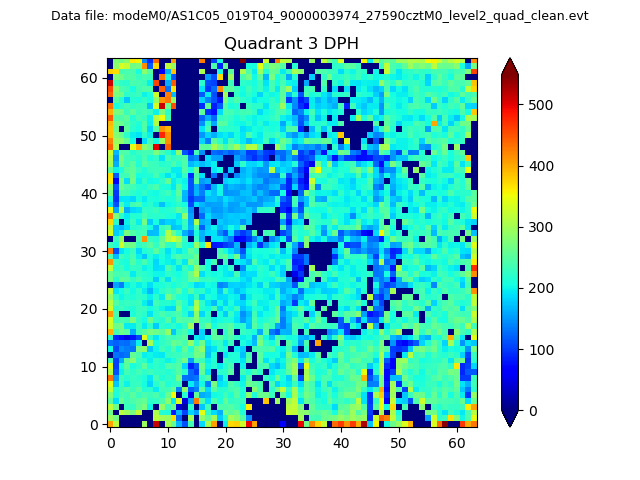 |
 |
Quadrant C |
| Plot type | Count rate plots | Images |
|---|---|---|
| Comparison with Poisson distribution Blue bars denote a histogram of data divided into 1 sec bins. Red curve is a Poisson curve with rate = median count rate of data. |
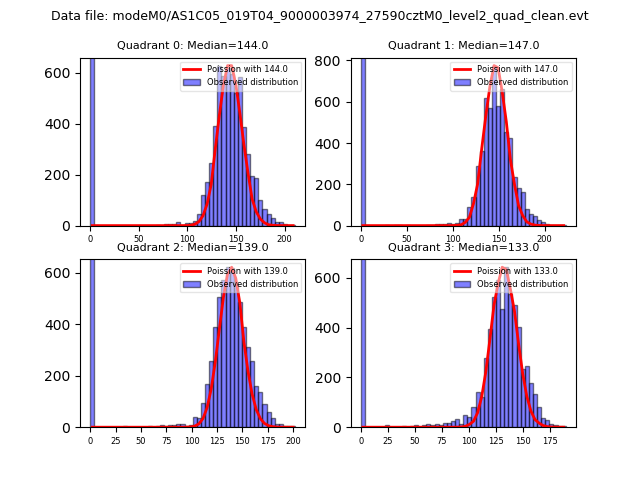 |
 |
| Quadrant-wise count rates Data is divided into 100 sec bins |
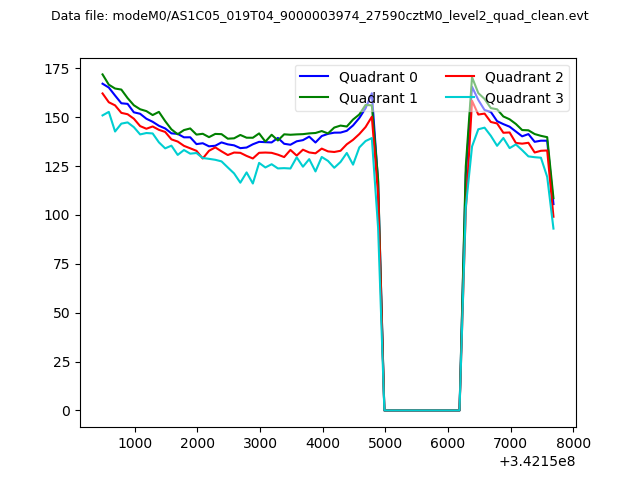 |
|
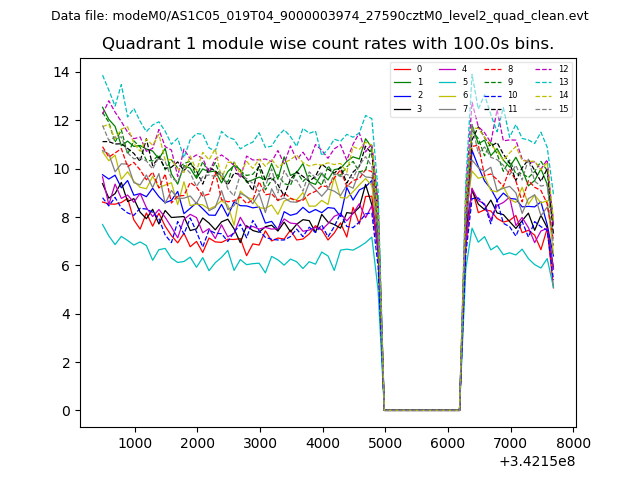
| Module-wise count rates for Quadrant A Data is divided into 100 sec bins |
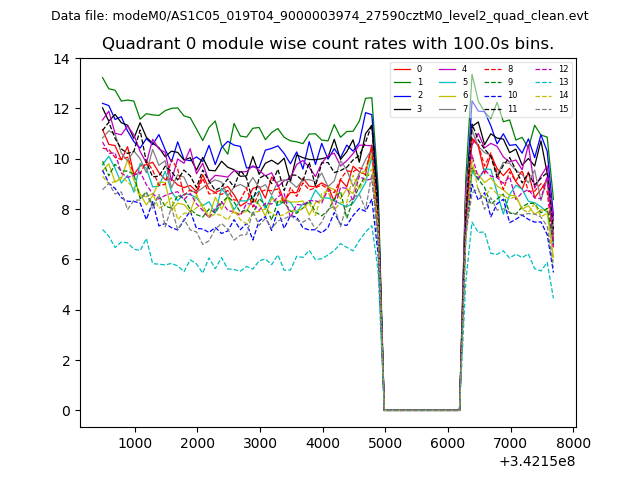 |
 |
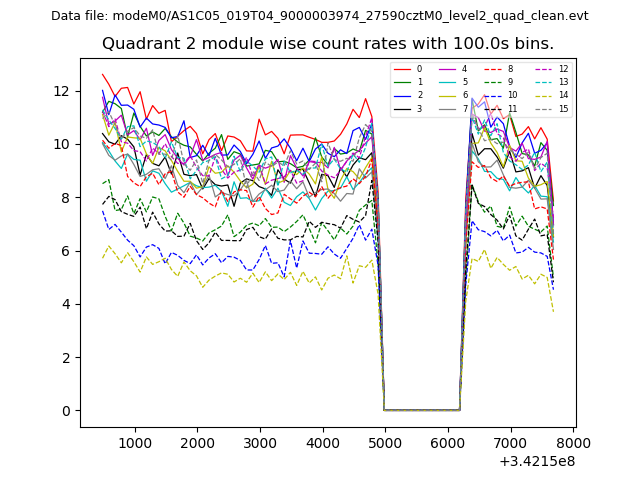
| Module-wise count rates for Quadrant B Data is divided into 100 sec bins |
 |
 |
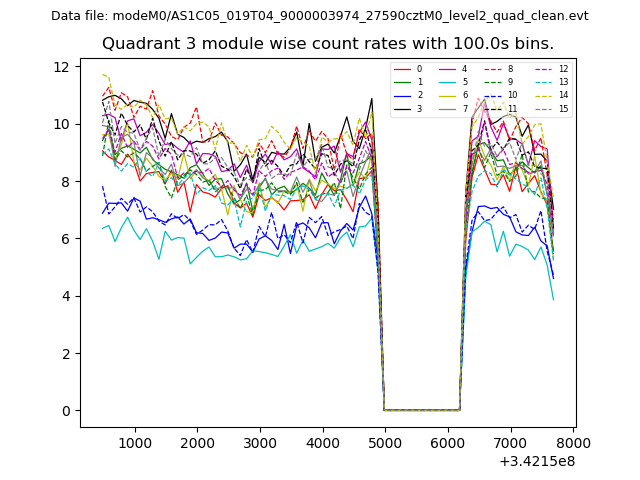
| Module-wise count rates for Quadrant C Data is divided into 100 sec bins |
 |
 |
| Module-wise count rates for Quadrant D Data is divided into 100 sec bins |
 |
 |
| Parameter | Plot |
|---|---|
| CZT HV Monitor | 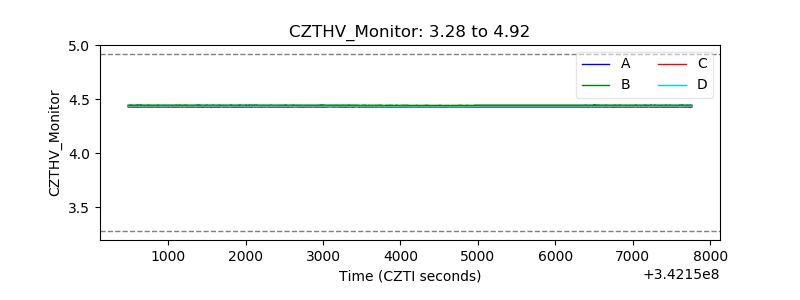 |
| D_VDD | 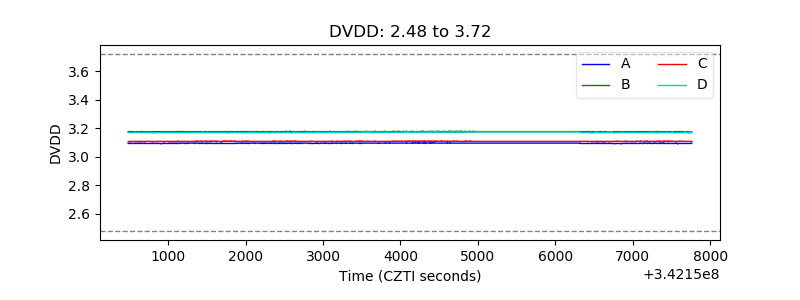 |
| Temperature 1 | 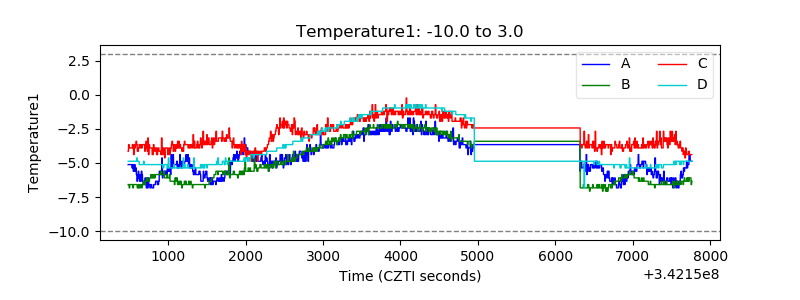 |
| Veto HV Monitor | 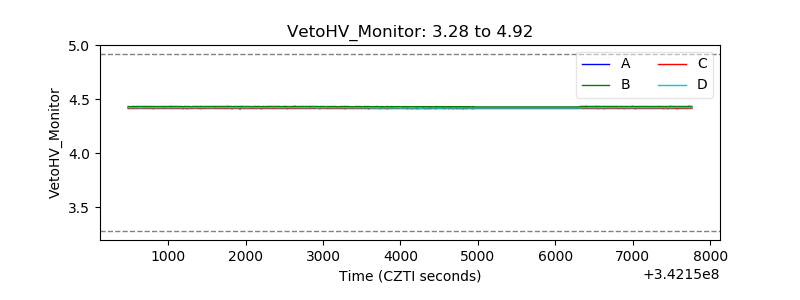 |
| Veto LLD | 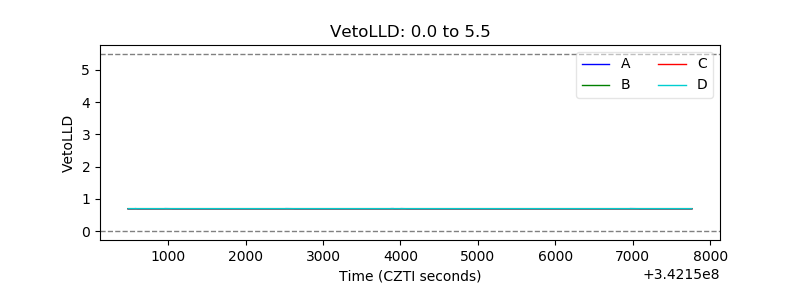 |
| Alpha Counter | 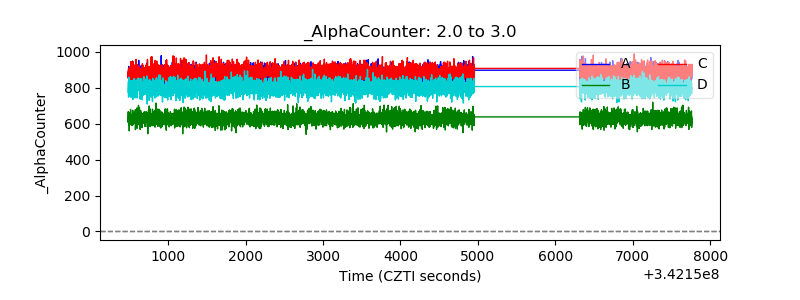 |
| _CPM_Rate | 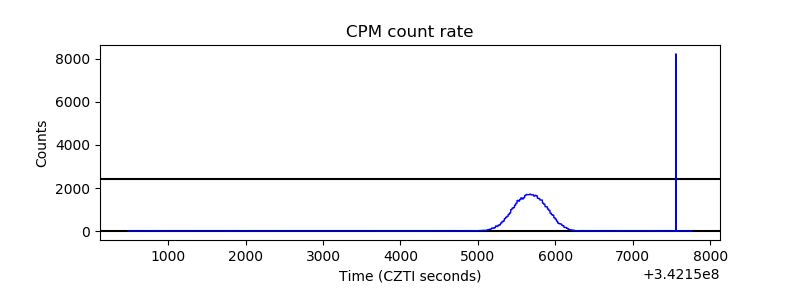 |
| CZT Counter | 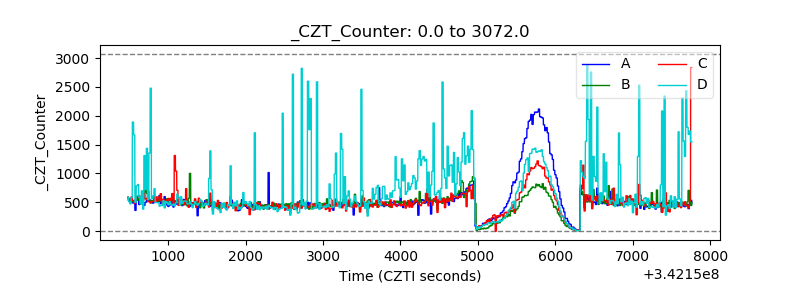 |
| +2.5 Volts monitor | 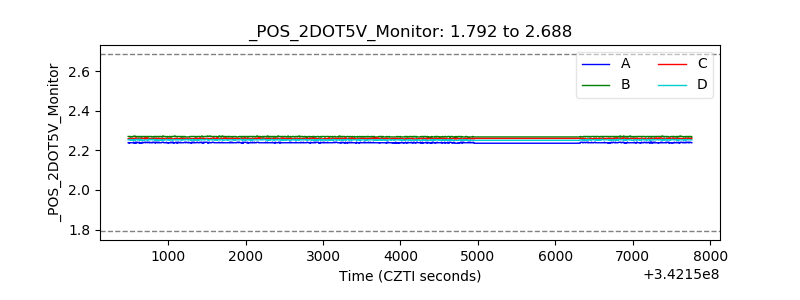 |
| +5 Volts monitor |  |
| _ROLL_ROT | 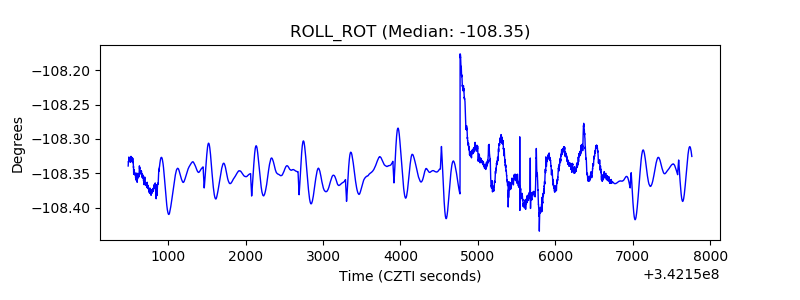 |
| _Roll_DEC | 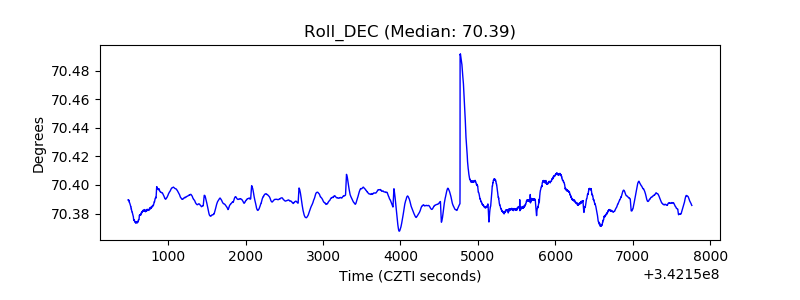 |
| _Roll_RA | 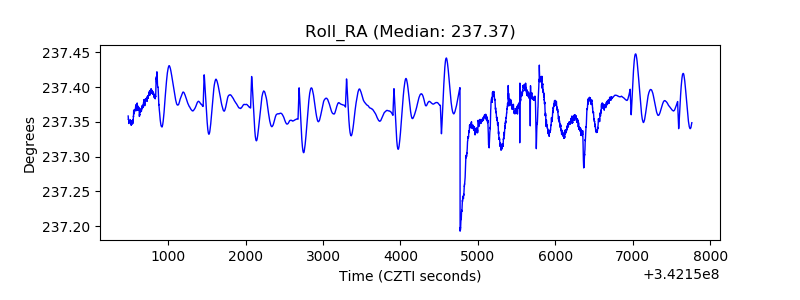 |
| Veto Counter | 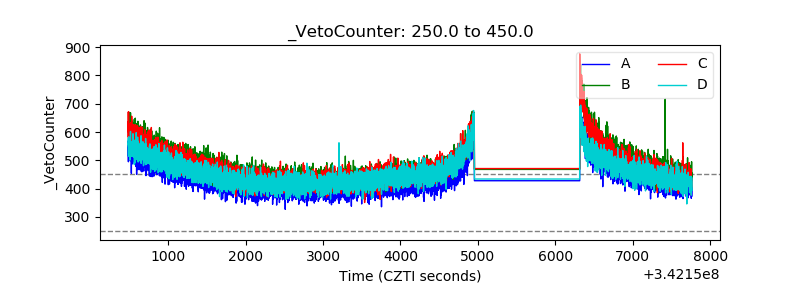 |