| Param | Original file | Final file |
|---|---|---|
| Filename | modeM0/AS1C05_019T04_9000003974_27592cztM0_level2.evt | modeM0/AS1C05_019T04_9000003974_27592cztM0_level2_quad_clean.evt |
| Size (bytes) | 177,128,640 | 46,938,240 |
| Size | 168.9 MB | 44.8 MB |
| Events in quadrant A | 1,052,307 | 319,564 |
| Events in quadrant B | 1,116,483 | 326,974 |
| Events in quadrant C | 1,123,447 | 308,704 |
| Events in quadrant D | 1,908,979 | 295,380 |
| Mode M0 | |||
|---|---|---|---|
| Quadrant | BADHDUFLAG | Total packets | Discarded packets |
| A | 0 | 4743 | 0 |
| B | 0 | 4890 | 0 |
| C | 0 | 4970 | 0 |
| D | 0 | 7326 | 0 |
| Quadrant | Total seconds | Saturated seconds | Saturation percentage |
|---|---|---|---|
| A | 2366 | 1 | 0.042265% |
| B | 2367 | 10 | 0.422476% |
| C | 2367 | 25 | 1.056189% |
| D | 2367 | 108 | 4.562738% |
Noise dominated data is calculated using 1-second bins in cleaned event files. If a bin has >2000 counts, and if more than 50% of those come from <1% of pixels, then it is considered to be noise-dominated and hence unusable.
| Quadrant | # 1 sec bins | Bins with >0 counts | Bins with >2000 counts | High rate bins dominated by noise | Noise dominated (total time) | Noise dominated (detector-on time) | Marked lightcurve |
|---|---|---|---|---|---|---|---|
| A | 2366 | 2366 | 0 | 0 | 0.00% | 0.00% | 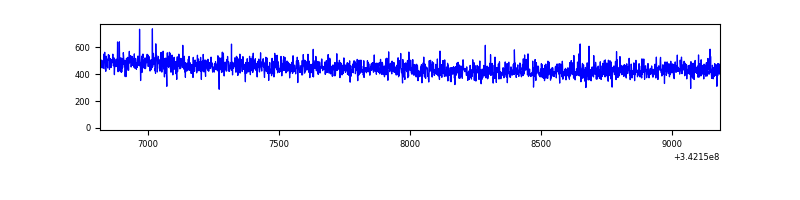 |
| B | 2367 | 2367 | 4 | 4 | 0.17% | 0.17% | 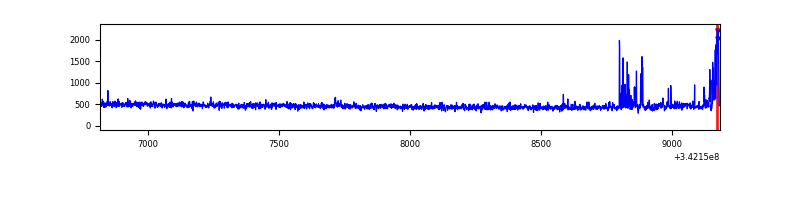 |
| C | 2367 | 2367 | 15 | 15 | 0.63% | 0.63% | 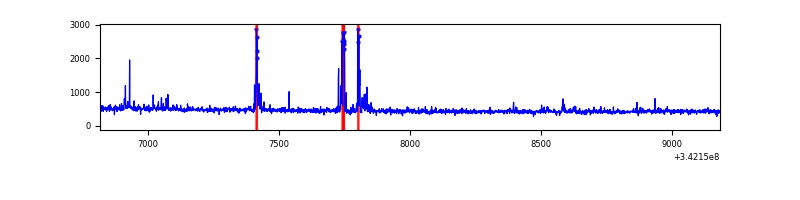 |
| D | 2367 | 2367 | 165 | 165 | 6.97% | 6.97% | 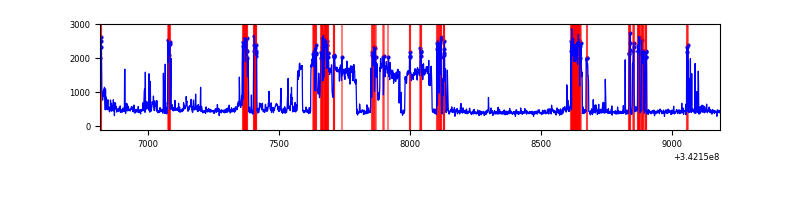 |
Top three noisy pixels from each quadrant. If the there are fewer than three noisy pixels in the level2.evt file, extra rows are filled as -1
| Pixel properties | Quadrant properties | ||||||
|---|---|---|---|---|---|---|---|
| Quadrant | DetID | PixID | Counts | Sigma | Mean | Median | Sigma |
| A | 13 | 254 | 3720 | 61.39 | 272 | 268 | 56.2 |
| A | 3 | 137 | 2506 | 39.8 | 272 | 268 | 56.2 |
| A | 0 | 226 | 2371 | 37.4 | 272 | 268 | 56.2 |
| B | 10 | 245 | 34874 | 657.58 | 270 | 264 | 52.6 |
| B | 3 | 64 | 17093 | 319.75 | 270 | 264 | 52.6 |
| B | 12 | 111 | 6066 | 110.24 | 270 | 264 | 52.6 |
| C | 2 | 16 | 78238 | 1306.24 | 254 | 255 | 59.7 |
| C | 14 | 238 | 42532 | 708.15 | 254 | 255 | 59.7 |
| C | 15 | 208 | 5512 | 88.06 | 254 | 255 | 59.7 |
| D | 1 | 52 | 940337 | 15458.11 | 253 | 247 | 60.8 |
| D | 2 | 234 | 8355 | 133.32 | 253 | 247 | 60.8 |
| D | 12 | 227 | 6410 | 101.34 | 253 | 247 | 60.8 |
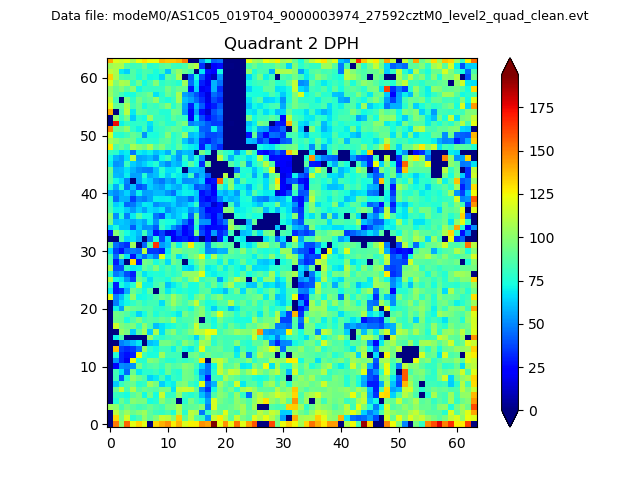
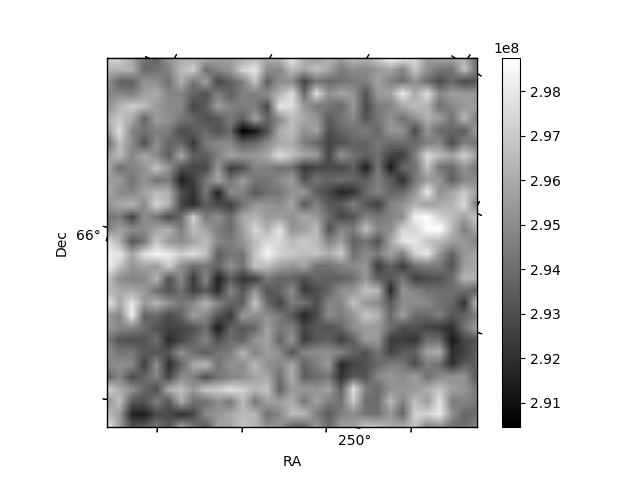
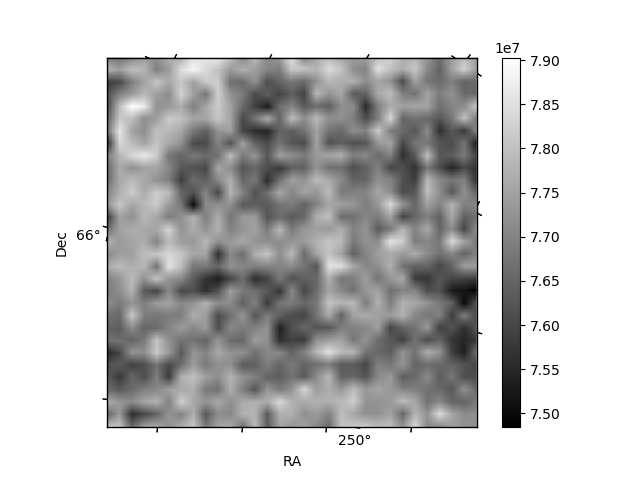
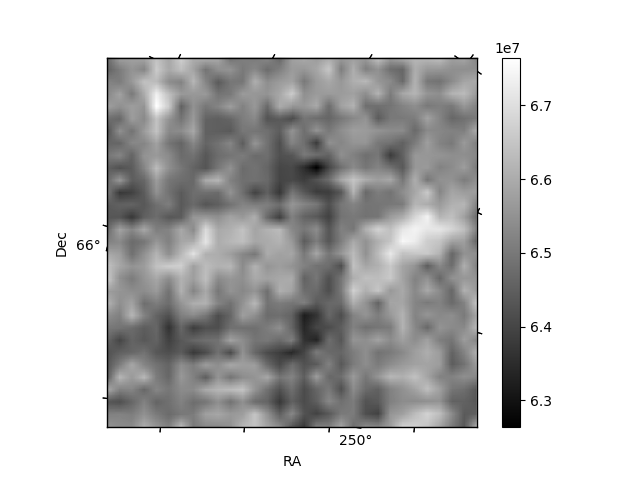
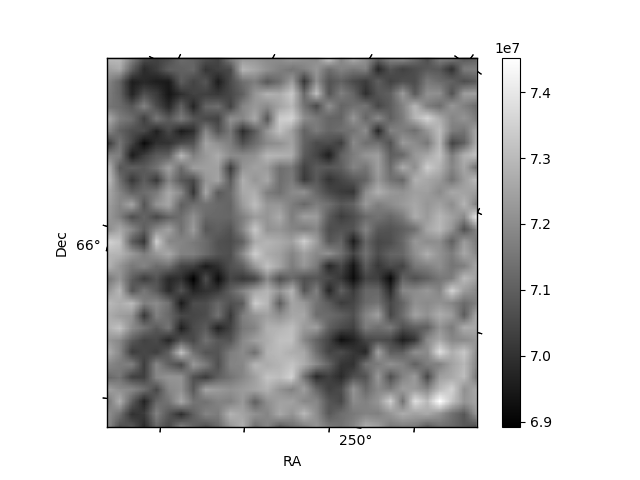
Histogram calculated using DETX and DETY for each event in the final _common_clean file
| Quadrant A | 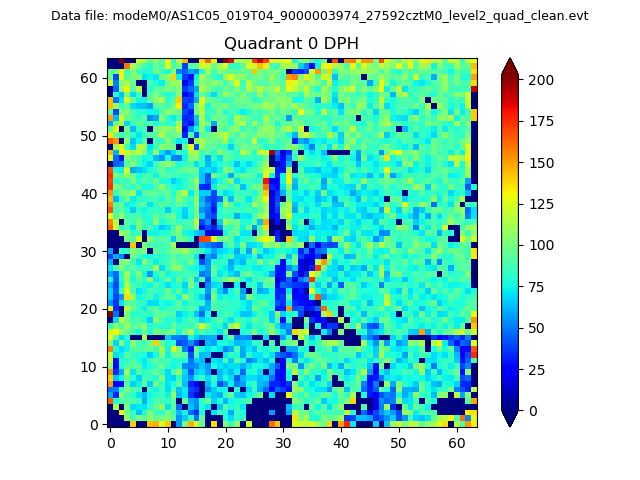 |
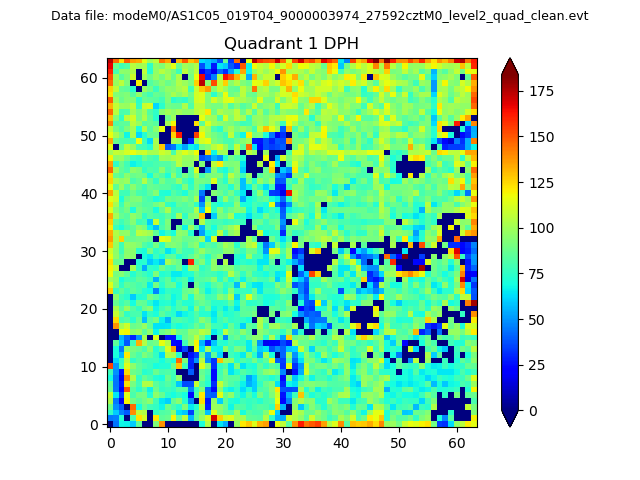 |
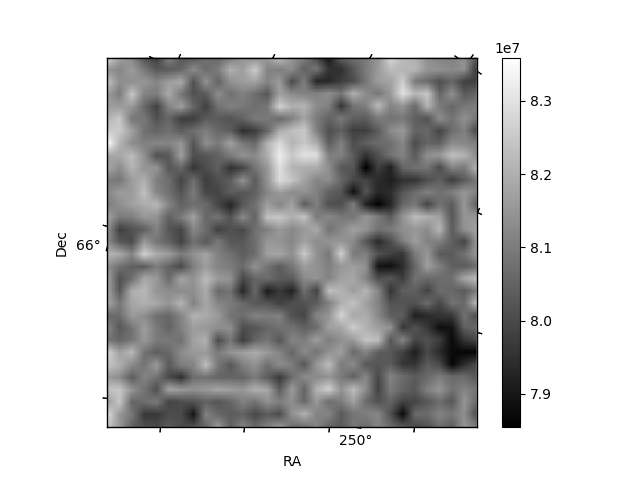
Quadrant B |
|---|---|---|---|
| Quadrant D | 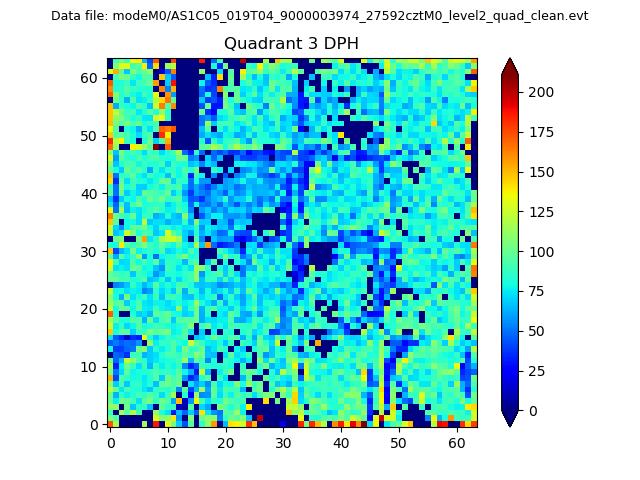 |
 |
Quadrant C |
| Plot type | Count rate plots | Images |
|---|---|---|
| Comparison with Poisson distribution Blue bars denote a histogram of data divided into 1 sec bins. Red curve is a Poisson curve with rate = median count rate of data. |
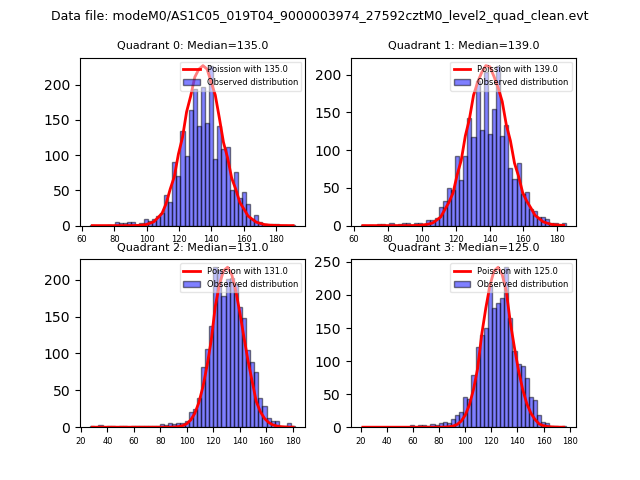 |
 |
| Quadrant-wise count rates Data is divided into 100 sec bins |
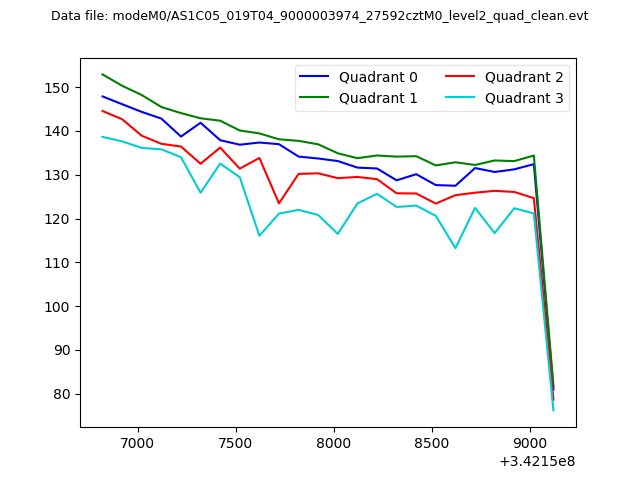 |
|
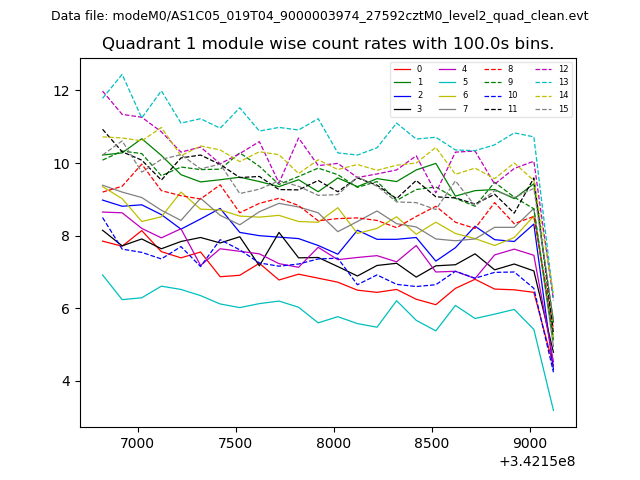
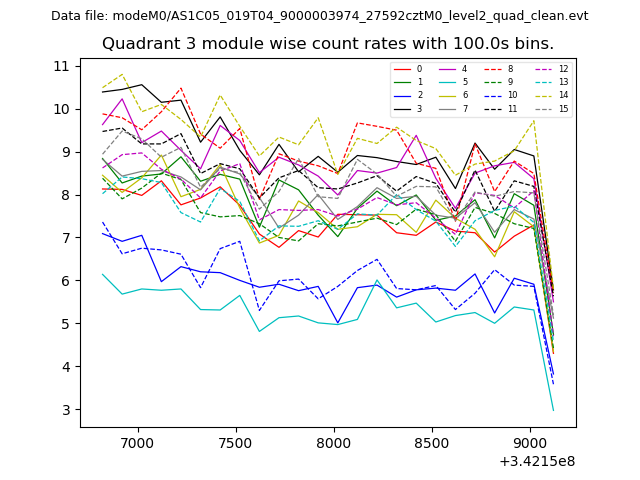
| Module-wise count rates for Quadrant A Data is divided into 100 sec bins |
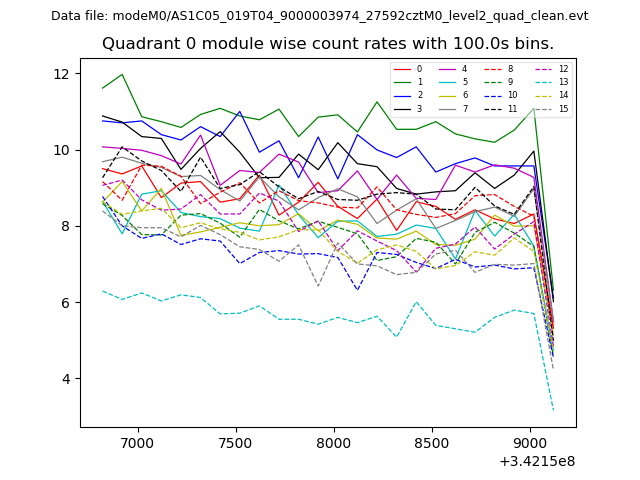 |
 |
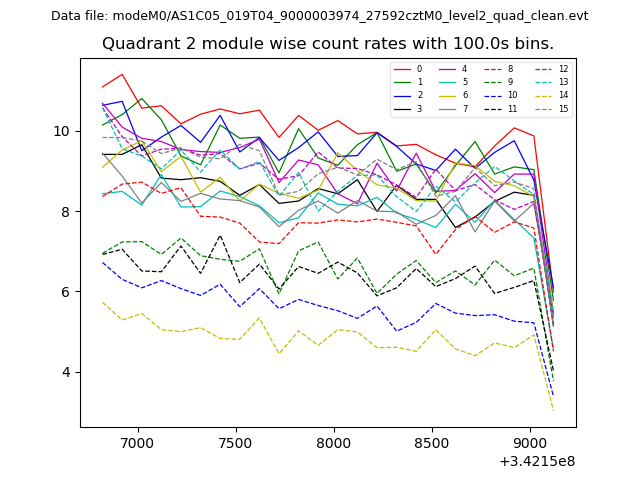
| Module-wise count rates for Quadrant B Data is divided into 100 sec bins |
 |
 |
| Module-wise count rates for Quadrant C Data is divided into 100 sec bins |
 |
 |
| Module-wise count rates for Quadrant D Data is divided into 100 sec bins |
 |
 |
| Parameter | Plot |
|---|---|
| CZT HV Monitor | 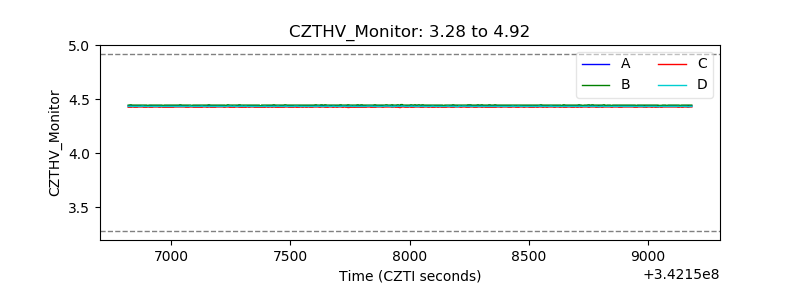 |
| D_VDD | 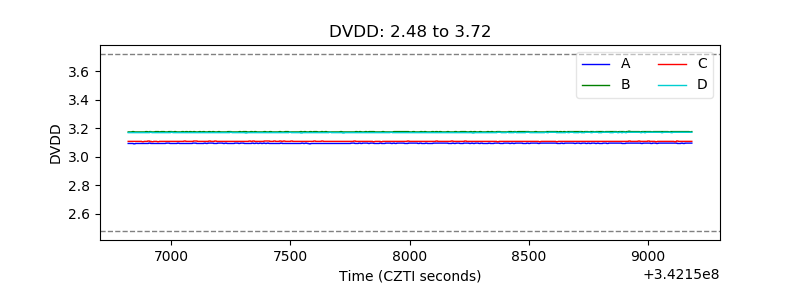 |
| Temperature 1 | 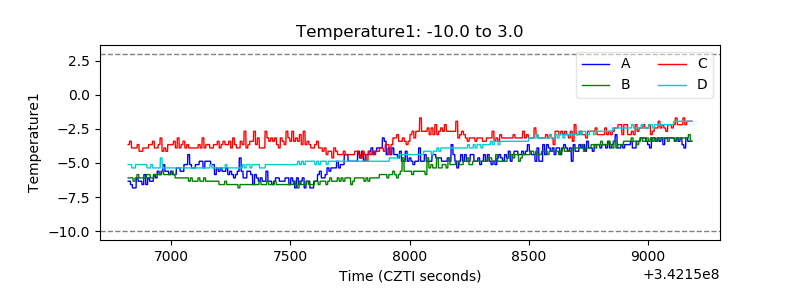 |
| Veto HV Monitor | 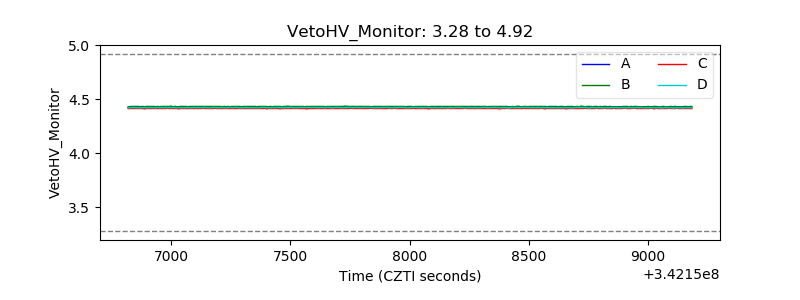 |
| Veto LLD | 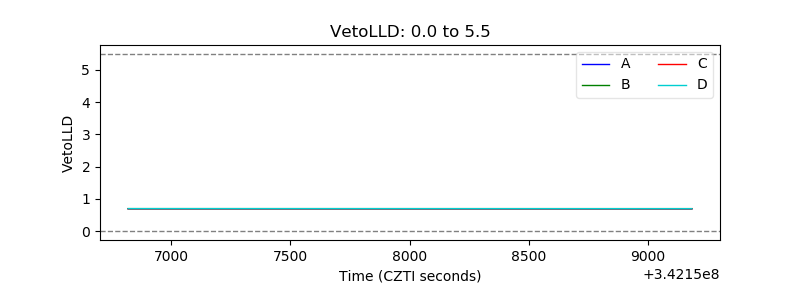 |
| Alpha Counter | 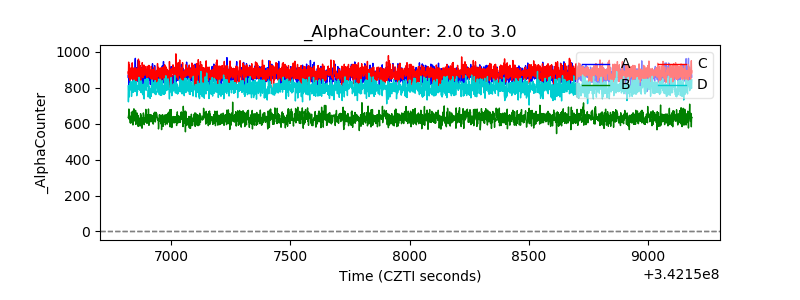 |
| _CPM_Rate | 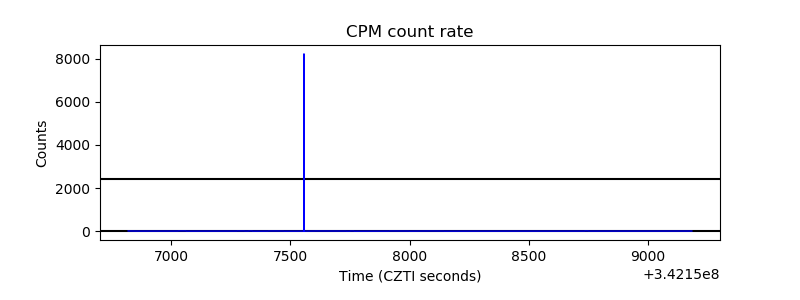 |
| CZT Counter | 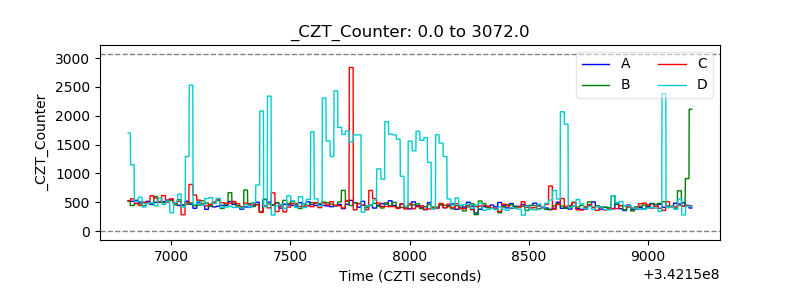 |
| +2.5 Volts monitor | 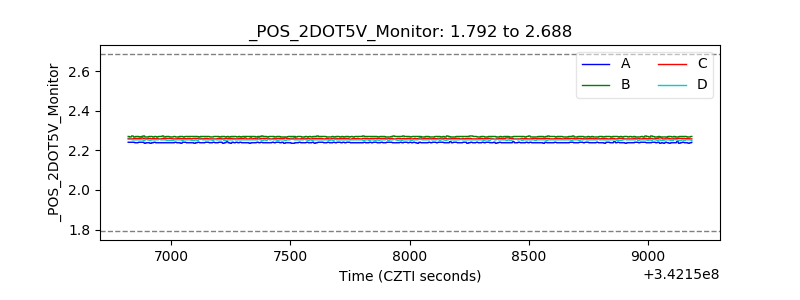 |
| +5 Volts monitor | 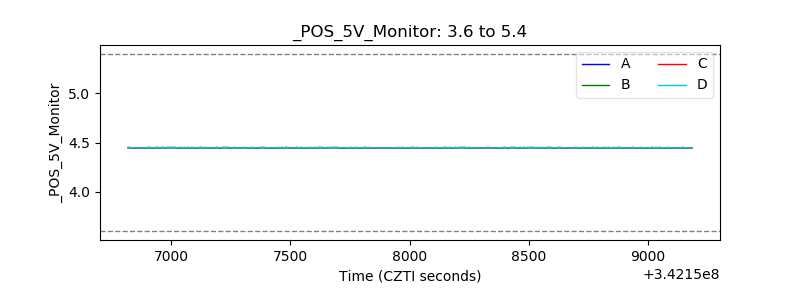 |
| _ROLL_ROT | 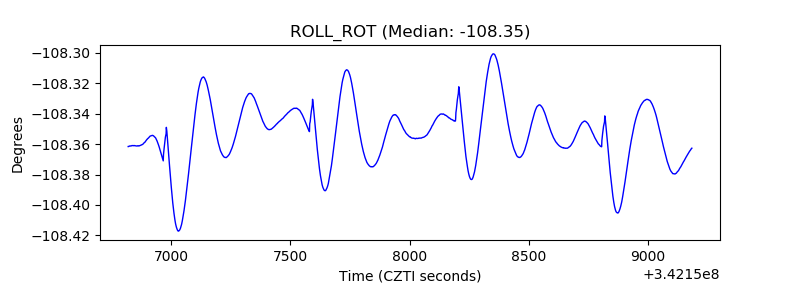 |
| _Roll_DEC | 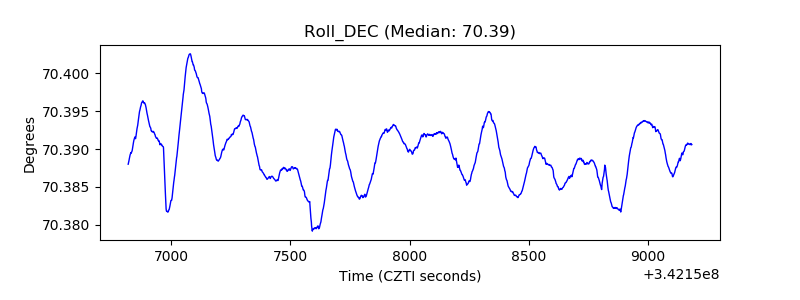 |
| _Roll_RA | 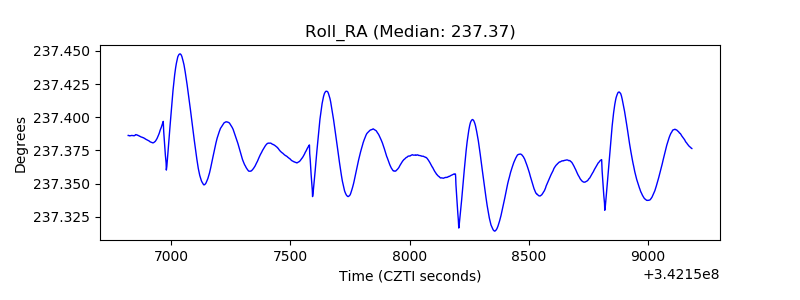 |
| Veto Counter | 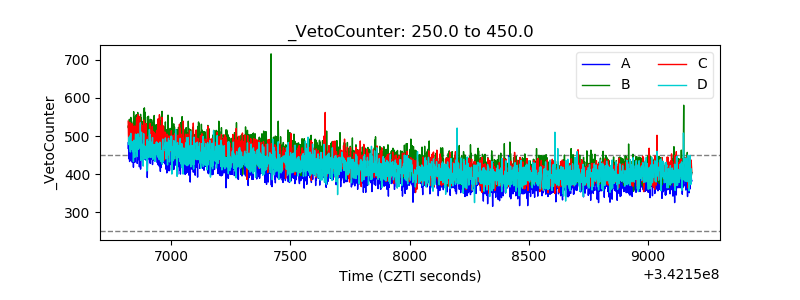 |