| Param | Original file | Final file |
|---|---|---|
| Filename | modeM0/AS1T03_259T01_9000003972cztM0_level2.fits | modeM0/AS1T03_259T01_9000003972cztM0_level2_quad_clean.evt |
| Size (bytes) | 329,126,400 | 276,675,840 |
| Size | 313.9 MB | 263.9 MB |
| Events in quadrant A | 2,082,690 | 1,608,205 |
| Events in quadrant B | 2,001,698 | 1,615,556 |
| Events in quadrant C | 2,037,282 | 1,533,127 |
| Events in quadrant D | 1,510,628 | 1,289,048 |
| Mode M9 | |||
|---|---|---|---|
| Quadrant | BADHDUFLAG | Total packets | Discarded packets |
| A | 0 | 40 | 0 |
| B | 0 | 40 | 0 |
| C | 0 | 40 | 0 |
| D | 0 | 40 | 0 |
| Mode SS | |||
|---|---|---|---|
| Quadrant | BADHDUFLAG | Total packets | Discarded packets |
| A | 0 | 692 | 0 |
| B | 0 | 692 | 0 |
| C | 0 | 692 | 0 |
| D | 0 | 692 | 0 |
| Mode M0 | |||
|---|---|---|---|
| Quadrant | BADHDUFLAG | Total packets | Discarded packets |
| A | 0 | 70584 | 0 |
| B | 0 | 74196 | 0 |
| C | 0 | 71302 | 0 |
| D | 0 | 128291 | 0 |
| Quadrant | Total seconds | Saturated seconds | Saturation percentage |
|---|---|---|---|
| A | 33930 | 667 | 1.965812% |
| B | 33930 | 915 | 2.696729% |
| C | 33930 | 863 | 2.543472% |
| D | 33930 | 6946 | 20.471559% |
Noise dominated data is calculated using 1-second bins in cleaned event files. If a bin has >2000 counts, and if more than 50% of those come from <1% of pixels, then it is considered to be noise-dominated and hence unusable.
| Quadrant | # 1 sec bins | Bins with >0 counts | Bins with >2000 counts | High rate bins dominated by noise | Noise dominated (total time) | Noise dominated (detector-on time) | Marked lightcurve |
|---|---|---|---|---|---|---|---|
| A | 38084 | 33927 | 0 | 0 | 0.00% | 0.00% |  |
| B | 38085 | 33928 | 0 | 0 | 0.00% | 0.00% |  |
| C | 38085 | 33928 | 0 | 0 | 0.00% | 0.00% |  |
| D | 38085 | 33121 | 0 | 0 | 0.00% | 0.00% |  |
Top three noisy pixels from each quadrant. If the there are fewer than three noisy pixels in the level2.evt file, extra rows are filled as -1
| Pixel properties | Quadrant properties | ||||||
|---|---|---|---|---|---|---|---|
| Quadrant | DetID | PixID | Counts | Sigma | Mean | Median | Sigma |
| A | 0 | 29 | 2016 | 11.32 | 542 | 510 | 133.0 |
| A | 7 | 110 | 1657 | 8.62 | 542 | 510 | 133.0 |
| A | 0 | 30 | 1553 | 7.84 | 542 | 510 | 133.0 |
| B | 2 | 9 | 1532 | 9.85 | 529 | 506 | 104.2 |
| B | 5 | 128 | 1329 | 7.9 | 529 | 506 | 104.2 |
| B | 3 | 17 | 1321 | 7.82 | 529 | 506 | 104.2 |
| C | 9 | 209 | 1425 | 6.76 | 539 | 507 | 135.7 |
| C | 12 | 241 | 1424 | 6.76 | 539 | 507 | 135.7 |
| C | 3 | 126 | 1412 | 6.67 | 539 | 507 | 135.7 |
| D | 7 | 3 | 1098 | 6.16 | 430 | 392 | 114.7 |
| D | 6 | 38 | 1078 | 5.98 | 430 | 392 | 114.7 |
| D | 6 | 67 | 1071 | 5.92 | 430 | 392 | 114.7 |
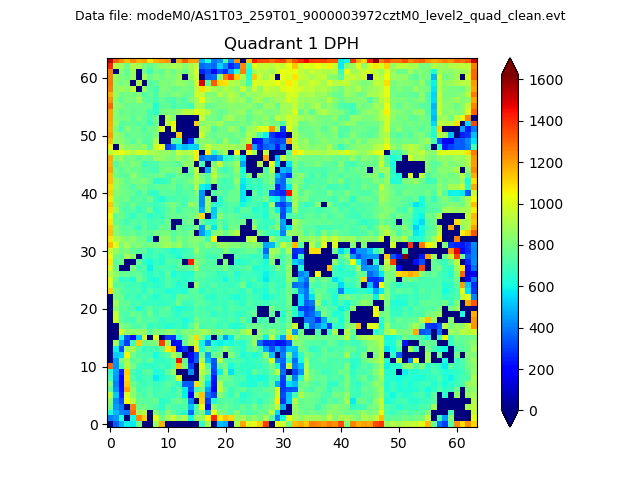
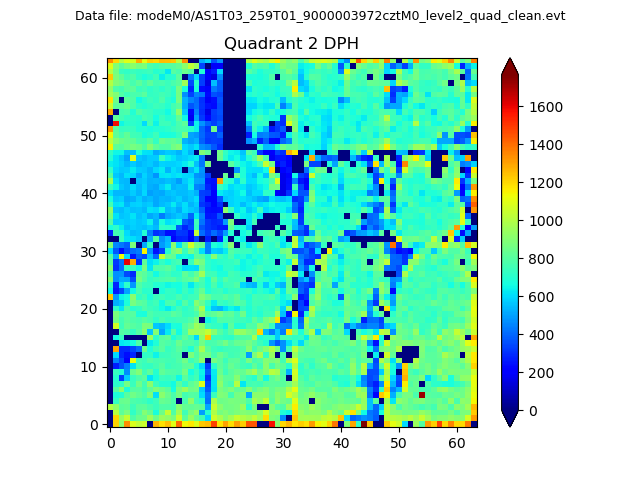
Histogram calculated using DETX and DETY for each event in the final _common_clean file
| Quadrant A |  |
 |
Quadrant B |
|---|---|---|---|
| Quadrant D |  |
 |
Quadrant C |
| Plot type | Count rate plots | Images |
|---|---|---|
| Comparison with Poisson distribution Blue bars denote a histogram of data divided into 1 sec bins. Red curve is a Poisson curve with rate = median count rate of data. |
 |
 |
| Quadrant-wise count rates Data is divided into 100 sec bins |
 |
|
| Module-wise count rates for Quadrant A Data is divided into 100 sec bins |
 |
 |
| Module-wise count rates for Quadrant B Data is divided into 100 sec bins |
 |
 |
| Module-wise count rates for Quadrant C Data is divided into 100 sec bins |
 |
 |
| Module-wise count rates for Quadrant D Data is divided into 100 sec bins |
 |
 |
| Parameter | Plot |
|---|---|
| CZT HV Monitor |  |
| D_VDD |  |
| Temperature 1 |  |
| Veto HV Monitor |  |
| Veto LLD |  |
| Alpha Counter |  |
| _CPM_Rate |  |
| CZT Counter |  |
| +2.5 Volts monitor |  |
| +5 Volts monitor |  |
| _ROLL_ROT |  |
| _Roll_DEC |  |
| _Roll_RA |  |
| Veto Counter |  |