| Param | Original file | Final file |
|---|---|---|
| Filename | modeM0/AS1T03_259T01_9000003972_27575cztM0_level2.evt | modeM0/AS1T03_259T01_9000003972_27575cztM0_level2_quad_clean.evt |
| Size (bytes) | 331,269,120 | 60,851,520 |
| Size | 315.9 MB | 58.0 MB |
| Events in quadrant A | 2,138,658 | 393,915 |
| Events in quadrant B | 2,361,275 | 403,610 |
| Events in quadrant C | 2,223,200 | 386,785 |
| Events in quadrant D | 3,026,252 | 365,391 |
| Mode M9 | |||
|---|---|---|---|
| Quadrant | BADHDUFLAG | Total packets | Discarded packets |
| A | 0 | 13 | 0 |
| B | 0 | 13 | 0 |
| C | 0 | 13 | 0 |
| D | 0 | 13 | 0 |
| Mode M0 | |||
|---|---|---|---|
| Quadrant | BADHDUFLAG | Total packets | Discarded packets |
| A | 0 | 8746 | 0 |
| B | 0 | 9549 | 0 |
| C | 0 | 8965 | 0 |
| D | 0 | 11756 | 0 |
| Quadrant | Total seconds | Saturated seconds | Saturation percentage |
|---|---|---|---|
| A | 4153 | 35 | 0.842764% |
| B | 4153 | 61 | 1.468818% |
| C | 4153 | 84 | 2.022634% |
| D | 4153 | 111 | 2.672767% |
Noise dominated data is calculated using 1-second bins in cleaned event files. If a bin has >2000 counts, and if more than 50% of those come from <1% of pixels, then it is considered to be noise-dominated and hence unusable.
| Quadrant | # 1 sec bins | Bins with >0 counts | Bins with >2000 counts | High rate bins dominated by noise | Noise dominated (total time) | Noise dominated (detector-on time) | Marked lightcurve |
|---|---|---|---|---|---|---|---|
| A | 5513 | 4154 | 2 | 2 | 0.04% | 0.05% | 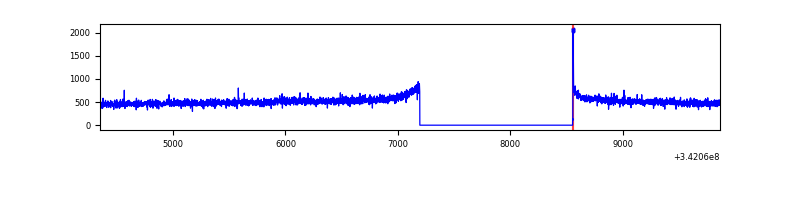 |
| B | 5513 | 4154 | 3 | 3 | 0.05% | 0.07% | 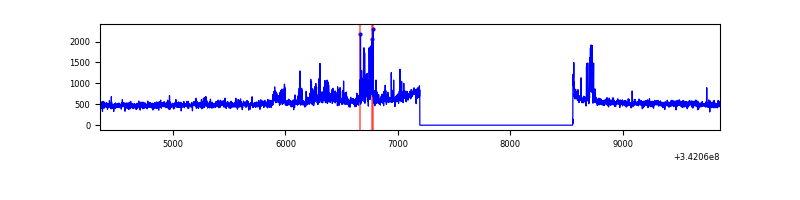 |
| C | 5513 | 4154 | 4 | 4 | 0.07% | 0.10% | 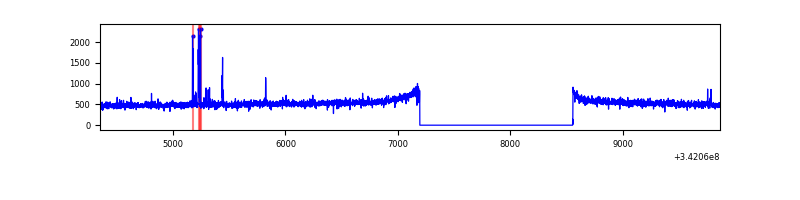 |
| D | 5513 | 4154 | 62 | 62 | 1.12% | 1.49% | 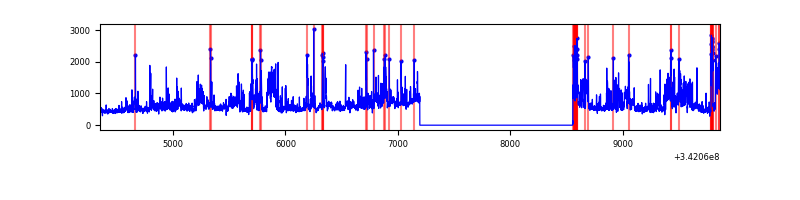 |
Top three noisy pixels from each quadrant. If the there are fewer than three noisy pixels in the level2.evt file, extra rows are filled as -1
| Pixel properties | Quadrant properties | ||||||
|---|---|---|---|---|---|---|---|
| Quadrant | DetID | PixID | Counts | Sigma | Mean | Median | Sigma |
| A | 13 | 254 | 7276 | 60.84 | 551 | 541 | 110.7 |
| A | 8 | 192 | 7001 | 58.35 | 551 | 541 | 110.7 |
| A | 15 | 174 | 5095 | 41.14 | 551 | 541 | 110.7 |
| B | 10 | 245 | 87016 | 830.76 | 552 | 539 | 104.1 |
| B | 15 | 222 | 28632 | 269.88 | 552 | 539 | 104.1 |
| B | 0 | 230 | 23144 | 217.16 | 552 | 539 | 104.1 |
| C | 14 | 238 | 88691 | 711.7 | 535 | 541 | 123.9 |
| C | 2 | 16 | 40412 | 321.91 | 535 | 541 | 123.9 |
| C | 13 | 61 | 3759 | 25.98 | 535 | 541 | 123.9 |
| D | 1 | 52 | 796075 | 6226.67 | 530 | 516 | 127.8 |
| D | 7 | 80 | 131030 | 1021.51 | 530 | 516 | 127.8 |
| D | 6 | 112 | 43552 | 336.83 | 530 | 516 | 127.8 |
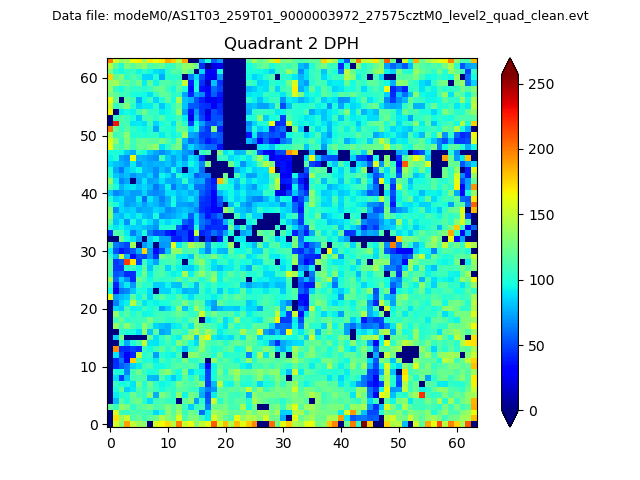
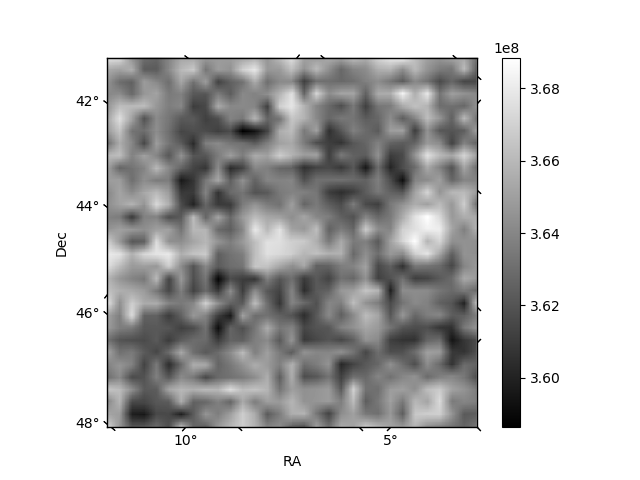
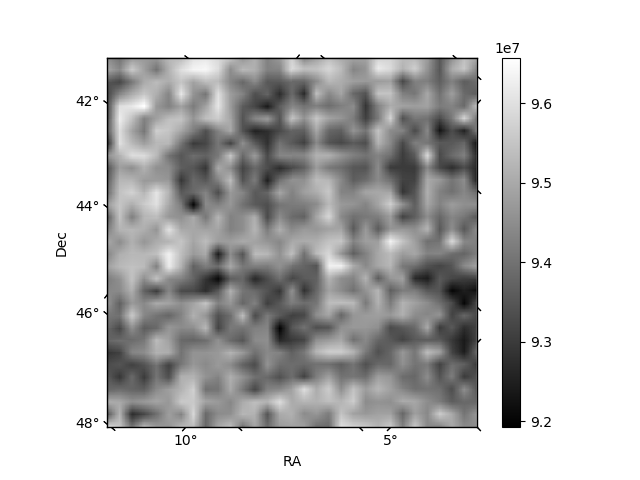
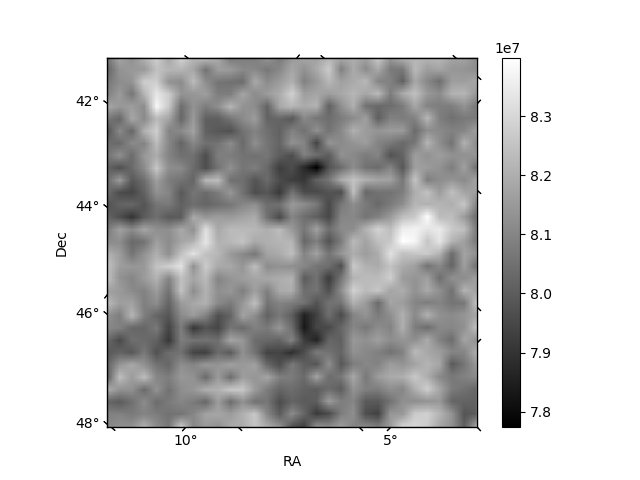
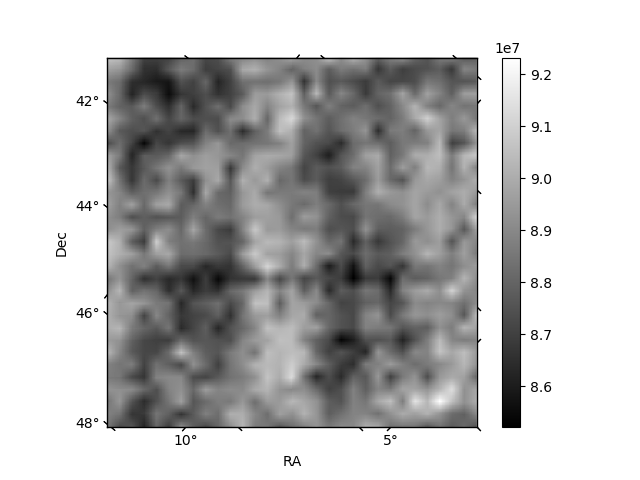
Histogram calculated using DETX and DETY for each event in the final _common_clean file
| Quadrant A | 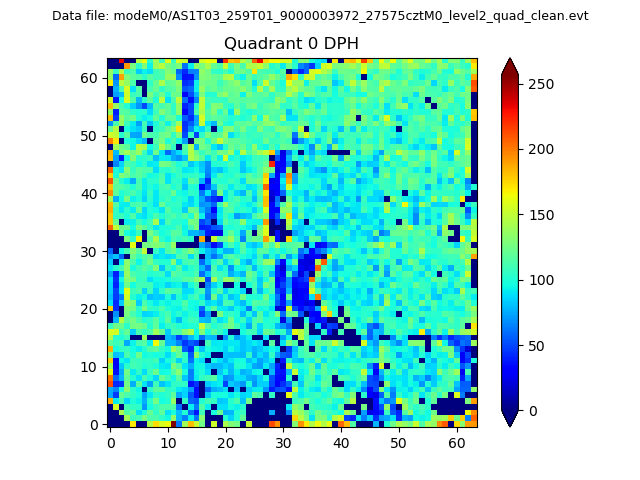 |
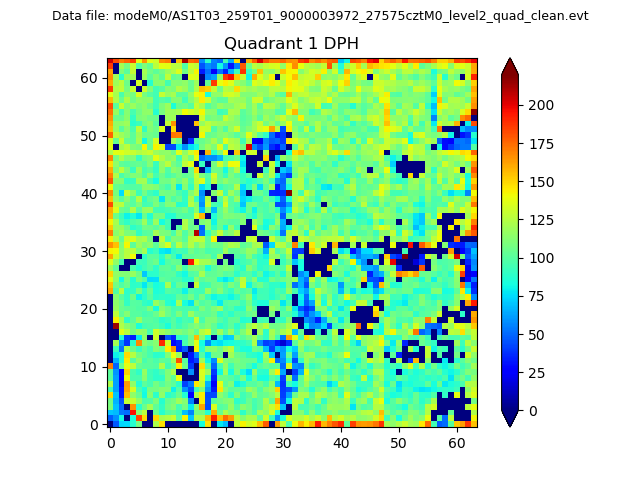 |
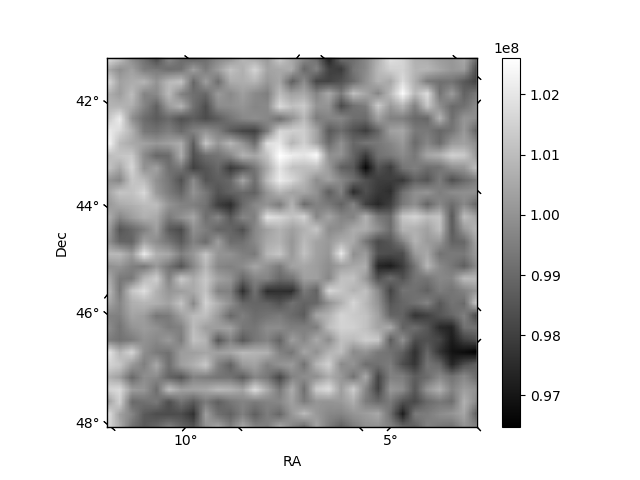
Quadrant B |
|---|---|---|---|
| Quadrant D | 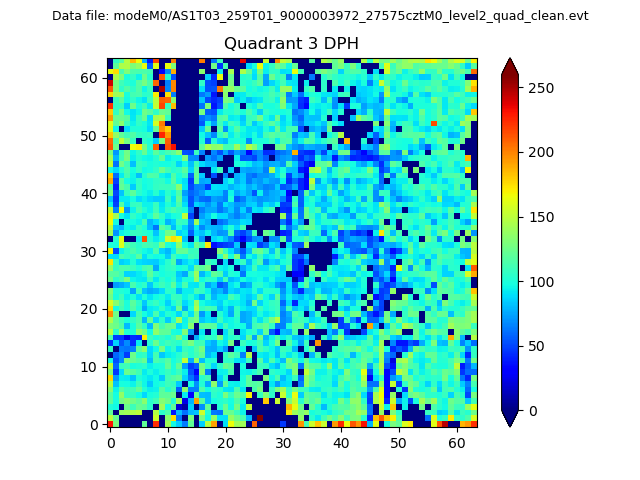 |
 |
Quadrant C |
| Plot type | Count rate plots | Images |
|---|---|---|
| Comparison with Poisson distribution Blue bars denote a histogram of data divided into 1 sec bins. Red curve is a Poisson curve with rate = median count rate of data. |
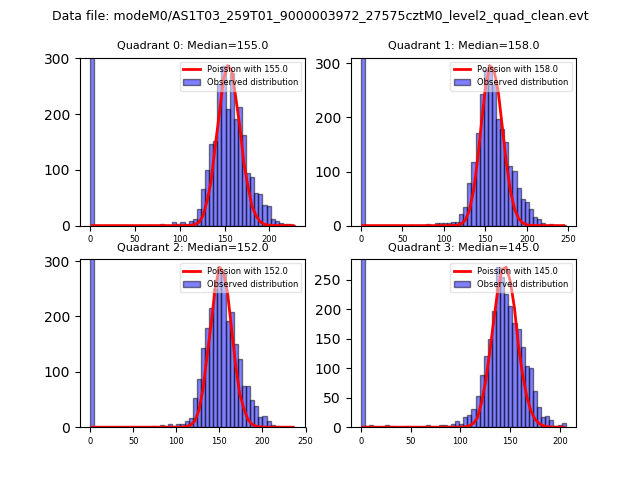 |
 |
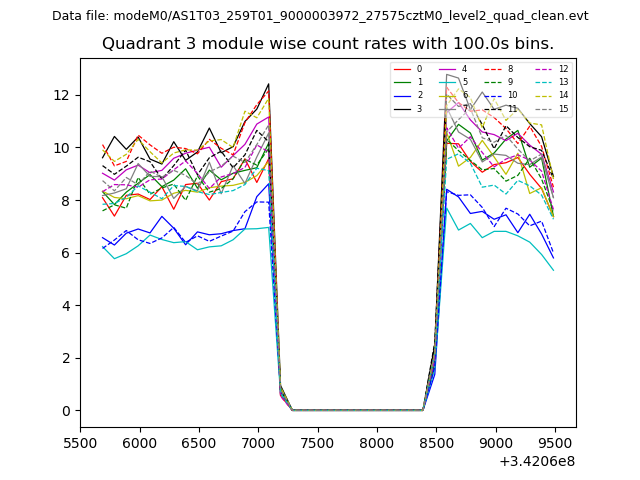
| Quadrant-wise count rates Data is divided into 100 sec bins |
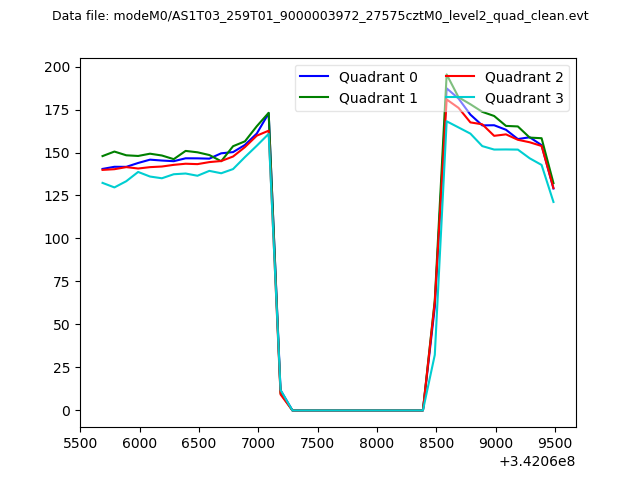 |
|
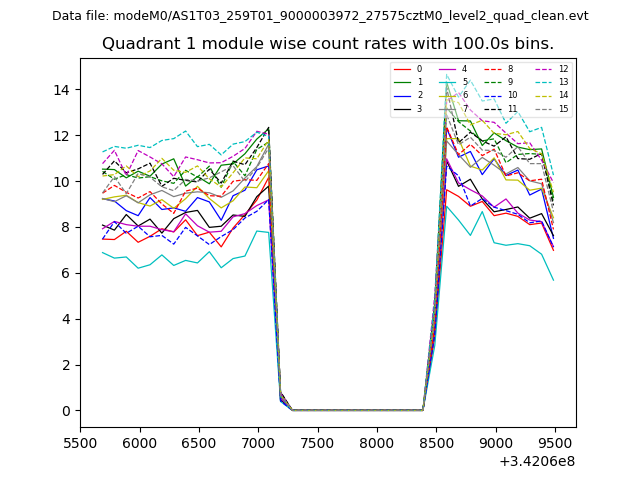
| Module-wise count rates for Quadrant A Data is divided into 100 sec bins |
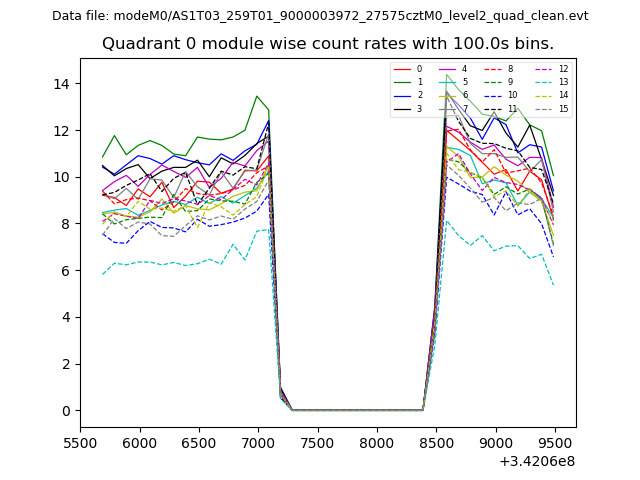 |
 |
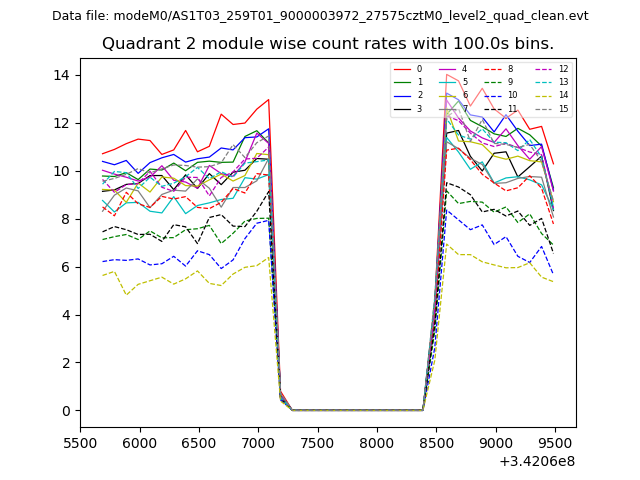
| Module-wise count rates for Quadrant B Data is divided into 100 sec bins |
 |
 |
| Module-wise count rates for Quadrant C Data is divided into 100 sec bins |
 |
 |
| Module-wise count rates for Quadrant D Data is divided into 100 sec bins |
 |
 |
| Parameter | Plot |
|---|---|
| CZT HV Monitor | 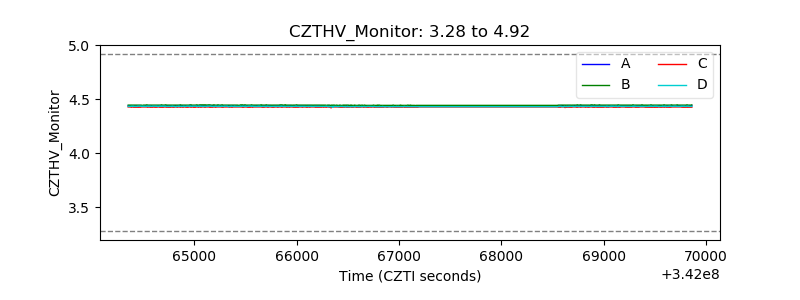 |
| D_VDD | 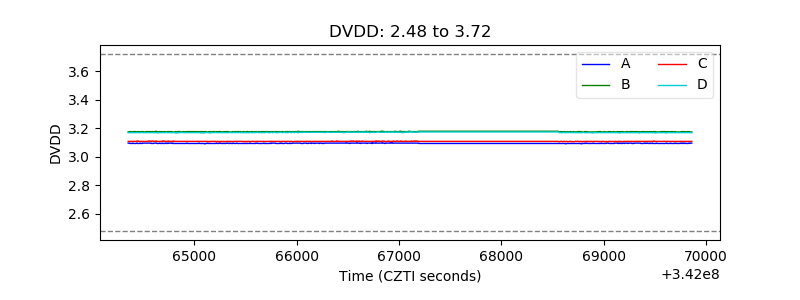 |
| Temperature 1 | 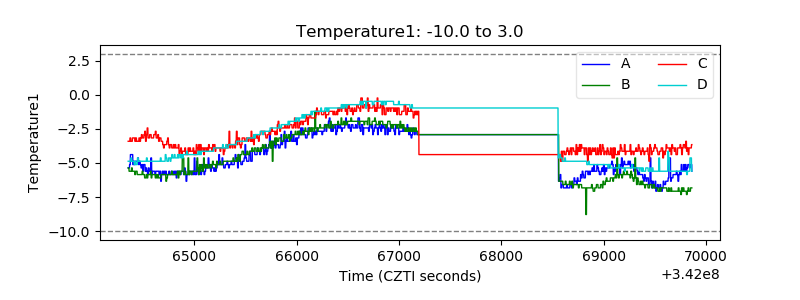 |
| Veto HV Monitor | 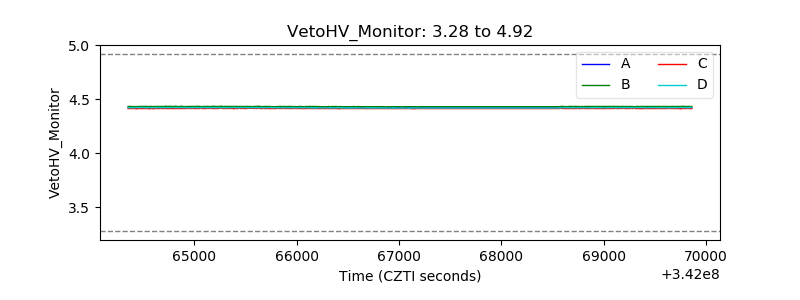 |
| Veto LLD | 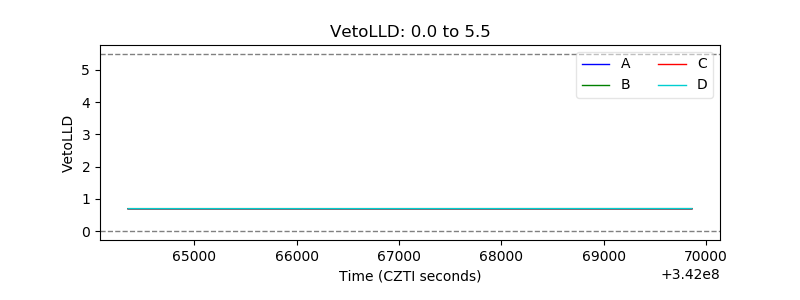 |
| Alpha Counter | 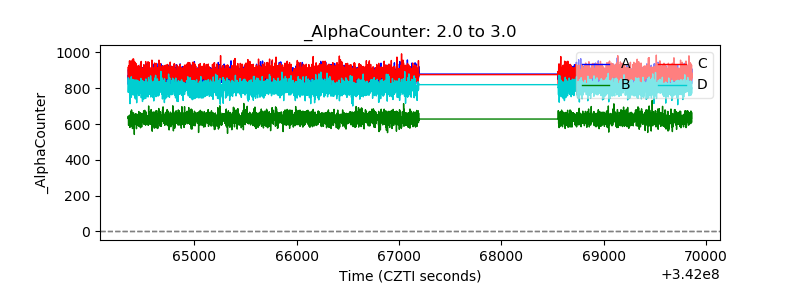 |
| _CPM_Rate | 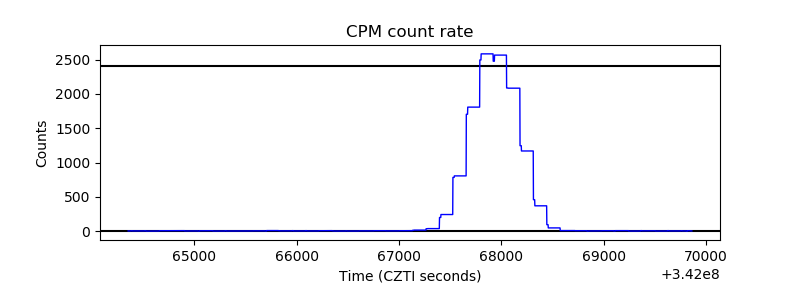 |
| CZT Counter | 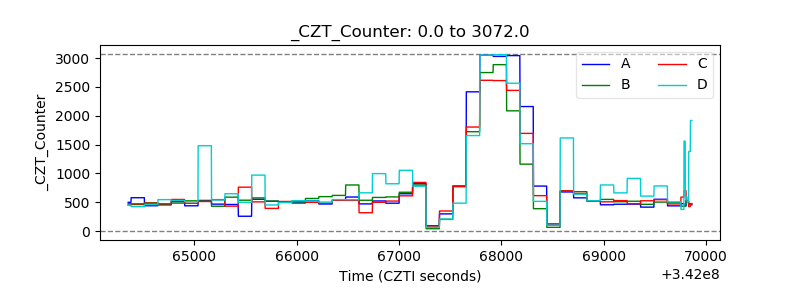 |
| +2.5 Volts monitor | 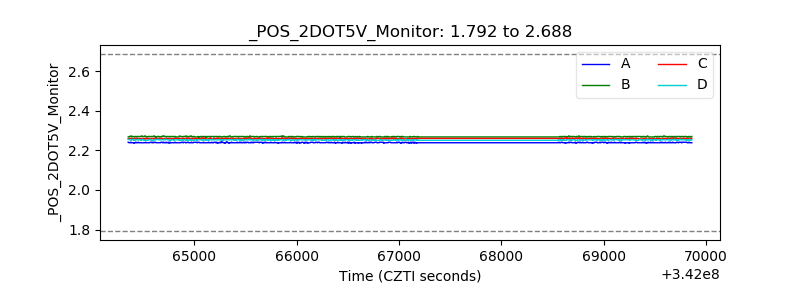 |
| +5 Volts monitor |  |
| _ROLL_ROT | 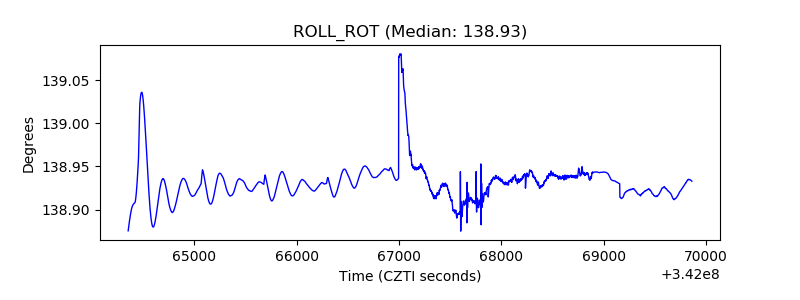 |
| _Roll_DEC | 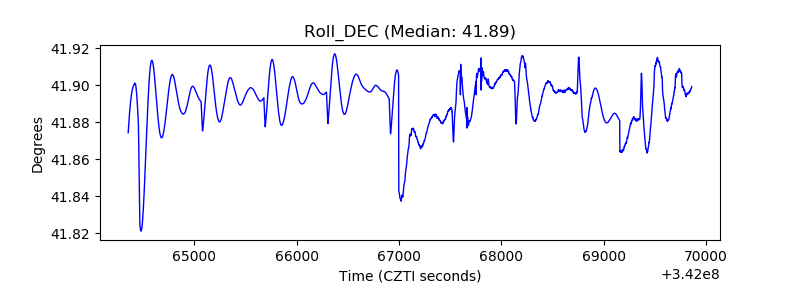 |
| _Roll_RA | 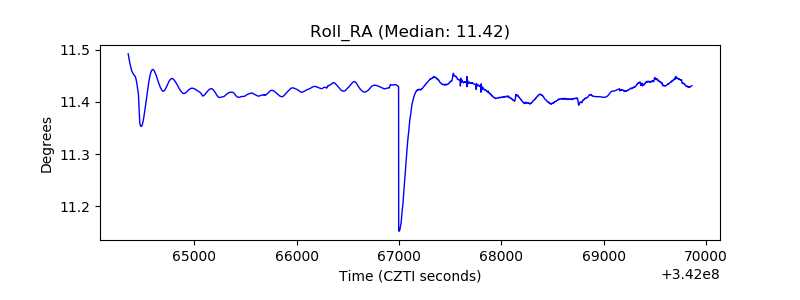 |
| Veto Counter | 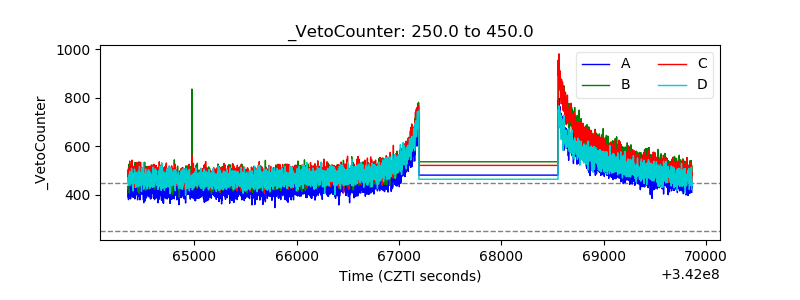 |