| Param | Original file | Final file |
|---|---|---|
| Filename | modeM0/AS1T03_259T01_9000003972_27576cztM0_level2.evt | modeM0/AS1T03_259T01_9000003972_27576cztM0_level2_quad_clean.evt |
| Size (bytes) | 792,688,320 | 77,757,120 |
| Size | 756.0 MB | 74.2 MB |
| Events in quadrant A | 3,188,831 | 555,003 |
| Events in quadrant B | 3,377,928 | 569,625 |
| Events in quadrant C | 3,277,987 | 542,173 |
| Events in quadrant D | 13,730,471 | 241,705 |
| Mode M9 | |||
|---|---|---|---|
| Quadrant | BADHDUFLAG | Total packets | Discarded packets |
| A | 0 | 13 | 0 |
| B | 0 | 14 | 0 |
| C | 0 | 14 | 0 |
| D | 0 | 14 | 0 |
| Mode M0 | |||
|---|---|---|---|
| Quadrant | BADHDUFLAG | Total packets | Discarded packets |
| A | 0 | 13262 | 0 |
| B | 0 | 13801 | 0 |
| C | 0 | 13502 | 0 |
| D | 0 | 45066 | 0 |
| Quadrant | Total seconds | Saturated seconds | Saturation percentage |
|---|---|---|---|
| A | 6368 | 43 | 0.675251% |
| B | 6368 | 75 | 1.177764% |
| C | 6368 | 77 | 1.209171% |
| D | 6368 | 4615 | 72.471734% |
Noise dominated data is calculated using 1-second bins in cleaned event files. If a bin has >2000 counts, and if more than 50% of those come from <1% of pixels, then it is considered to be noise-dominated and hence unusable.
| Quadrant | # 1 sec bins | Bins with >0 counts | Bins with >2000 counts | High rate bins dominated by noise | Noise dominated (total time) | Noise dominated (detector-on time) | Marked lightcurve |
|---|---|---|---|---|---|---|---|
| A | 7628 | 6370 | 2 | 2 | 0.03% | 0.03% | 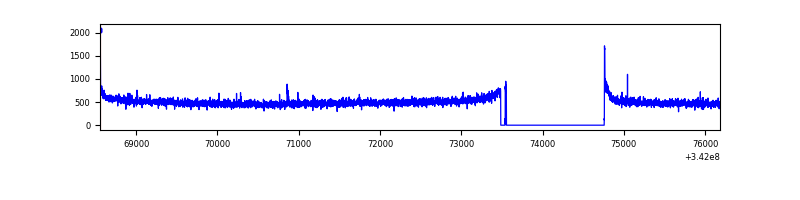 |
| B | 7628 | 6370 | 5 | 5 | 0.07% | 0.08% | 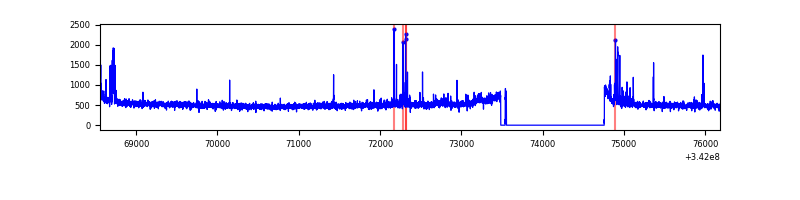 |
| C | 7628 | 6370 | 0 | 0 | 0.00% | 0.00% | 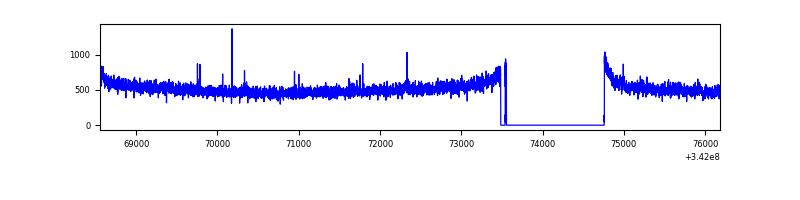 |
| D | 7628 | 6370 | 4561 | 4561 | 59.79% | 71.60% | 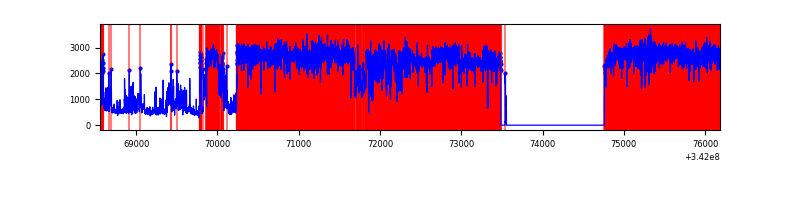 |
Top three noisy pixels from each quadrant. If the there are fewer than three noisy pixels in the level2.evt file, extra rows are filled as -1
| Pixel properties | Quadrant properties | ||||||
|---|---|---|---|---|---|---|---|
| Quadrant | DetID | PixID | Counts | Sigma | Mean | Median | Sigma |
| A | 8 | 192 | 12619 | 72.39 | 822 | 806 | 163.2 |
| A | 13 | 254 | 10816 | 61.34 | 822 | 806 | 163.2 |
| A | 3 | 137 | 7362 | 40.18 | 822 | 806 | 163.2 |
| B | 10 | 245 | 95447 | 615.69 | 824 | 804 | 153.7 |
| B | 15 | 222 | 28979 | 183.29 | 824 | 804 | 153.7 |
| B | 12 | 111 | 18695 | 116.39 | 824 | 804 | 153.7 |
| C | 14 | 238 | 129448 | 699.12 | 795 | 801 | 184.0 |
| C | 4 | 175 | 21336 | 111.6 | 795 | 801 | 184.0 |
| C | 2 | 16 | 12504 | 63.6 | 795 | 801 | 184.0 |
| D | 7 | 80 | 11707407 | 129742.89 | 376 | 366 | 90.2 |
| D | 1 | 52 | 457346 | 5064.47 | 376 | 366 | 90.2 |
| D | 6 | 112 | 106763 | 1179.14 | 376 | 366 | 90.2 |
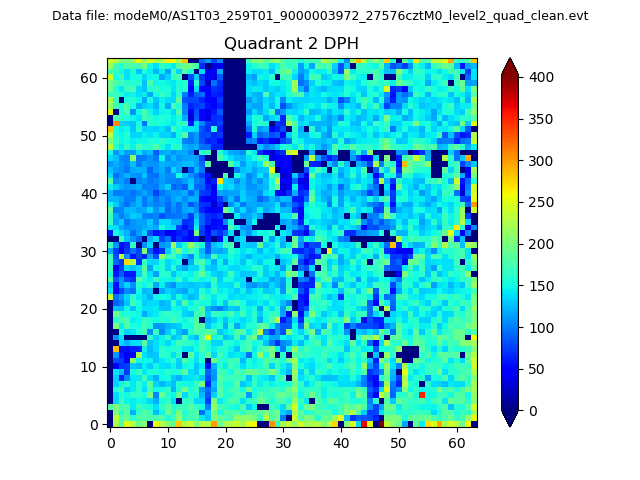
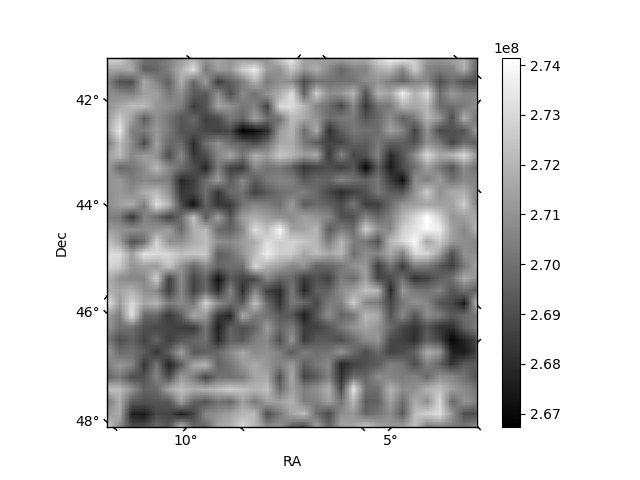
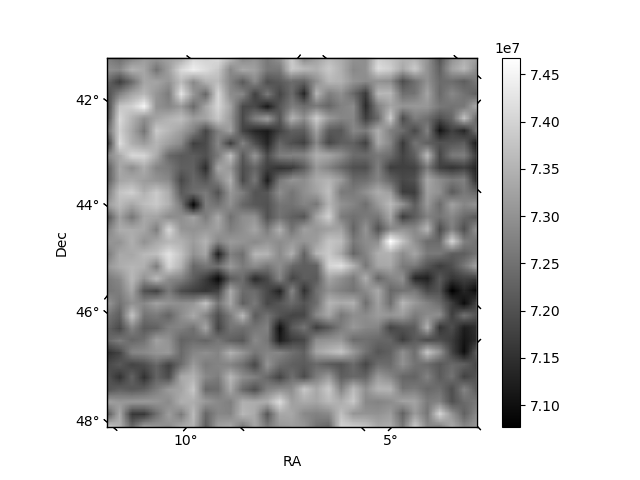
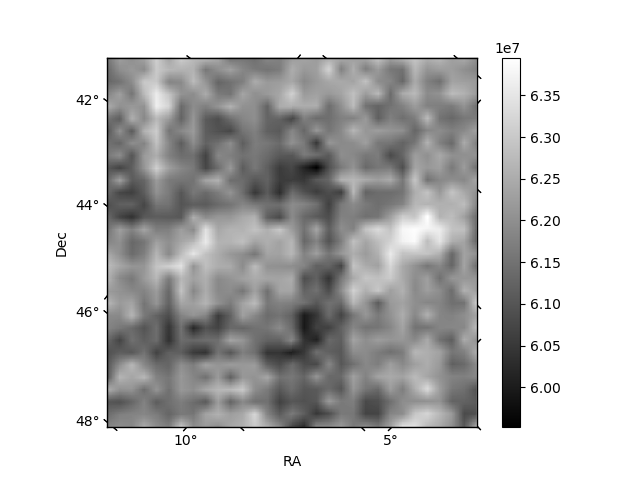
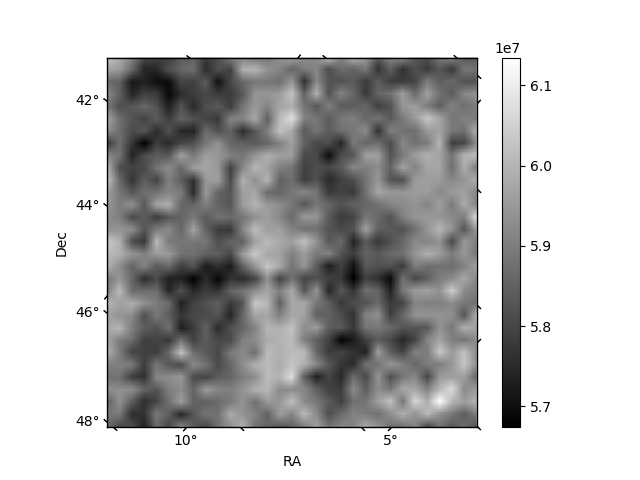
Histogram calculated using DETX and DETY for each event in the final _common_clean file
| Quadrant A | 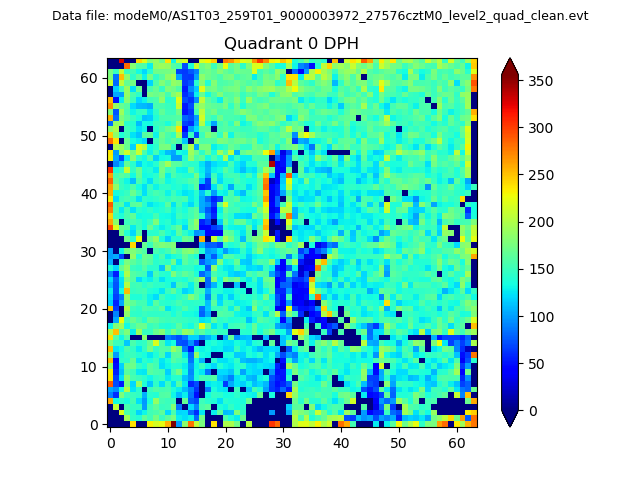 |
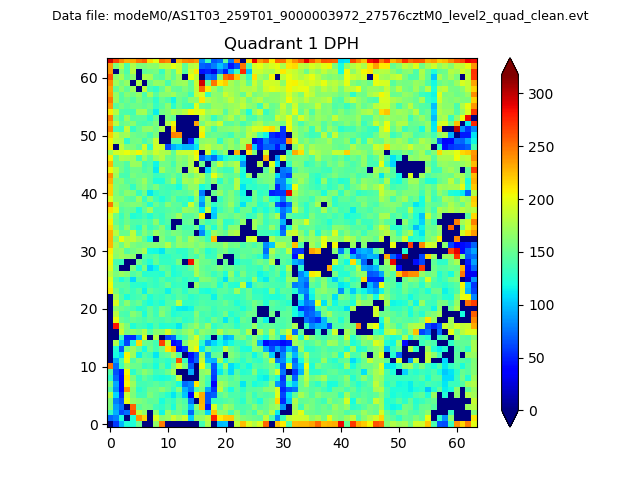 |
Quadrant B |
|---|---|---|---|
| Quadrant D | 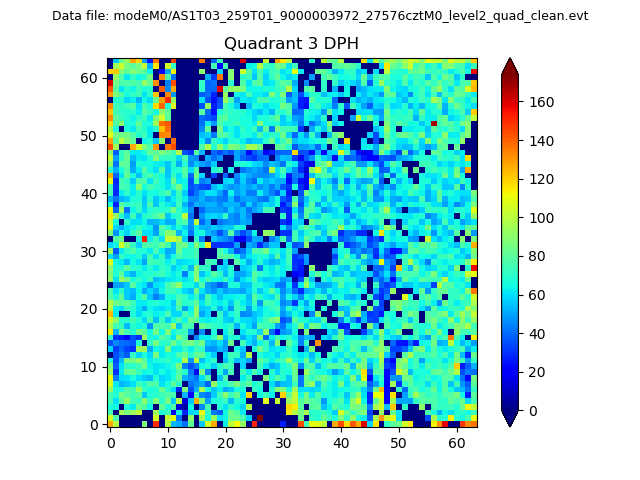 |
 |
Quadrant C |
| Plot type | Count rate plots | Images |
|---|---|---|
| Comparison with Poisson distribution Blue bars denote a histogram of data divided into 1 sec bins. Red curve is a Poisson curve with rate = median count rate of data. |
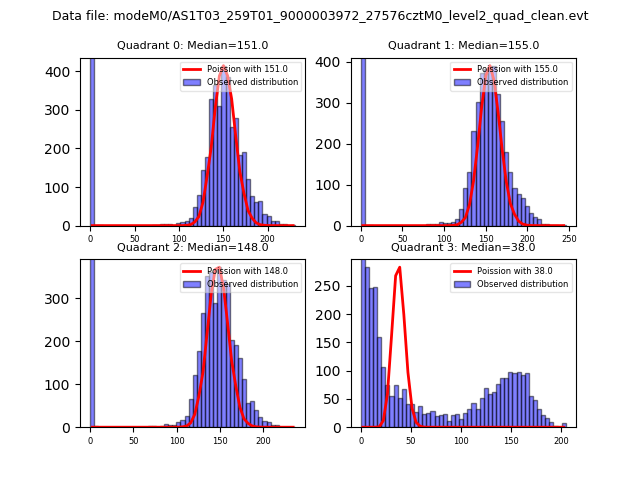 |
 |
| Quadrant-wise count rates Data is divided into 100 sec bins |
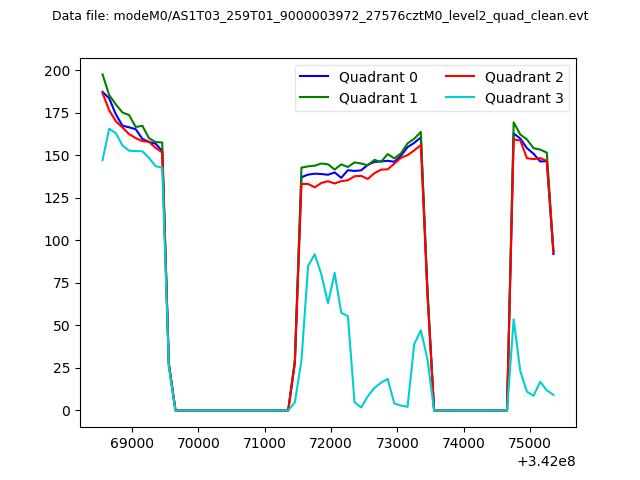 |
|
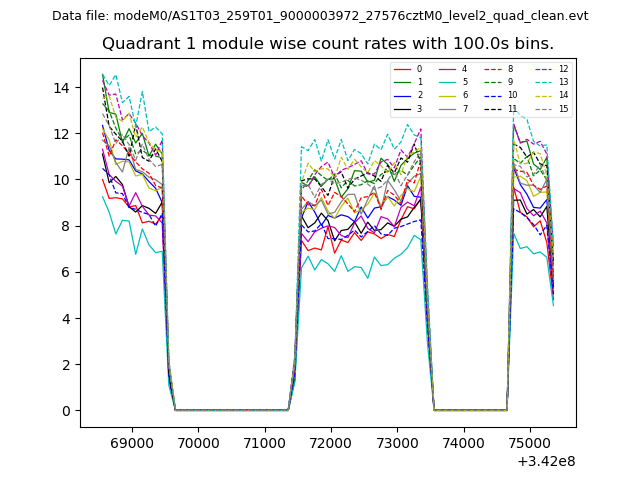
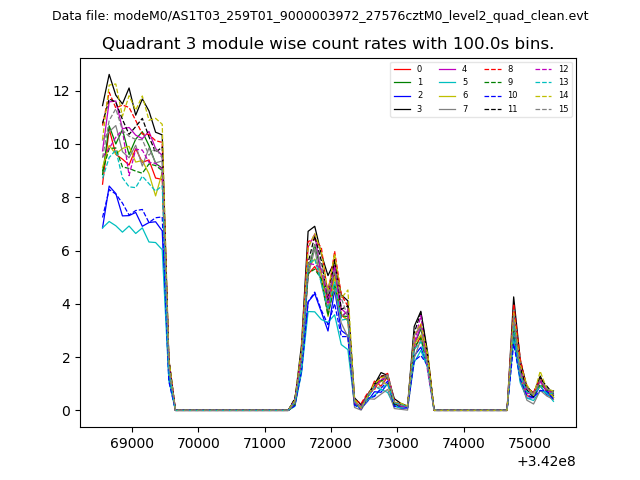
| Module-wise count rates for Quadrant A Data is divided into 100 sec bins |
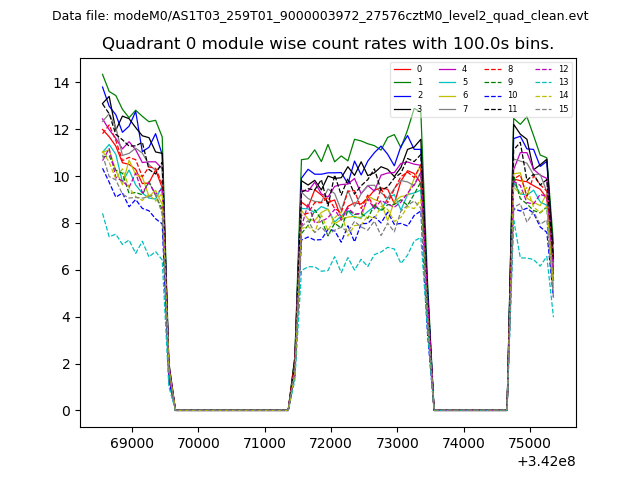 |
 |
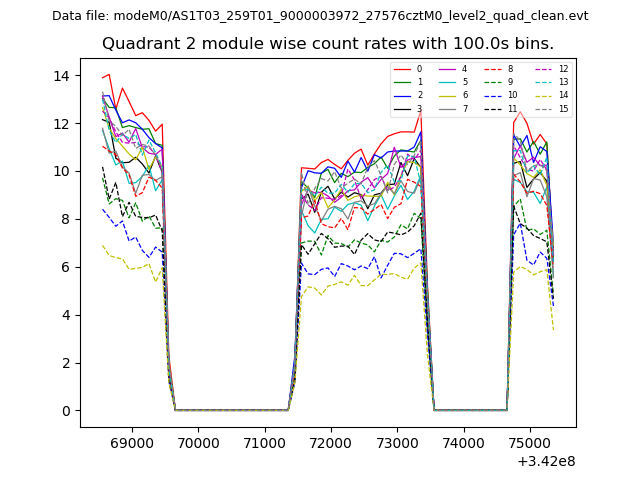
| Module-wise count rates for Quadrant B Data is divided into 100 sec bins |
 |
 |
| Module-wise count rates for Quadrant C Data is divided into 100 sec bins |
 |
 |
| Module-wise count rates for Quadrant D Data is divided into 100 sec bins |
 |
 |
| Parameter | Plot |
|---|---|
| CZT HV Monitor | 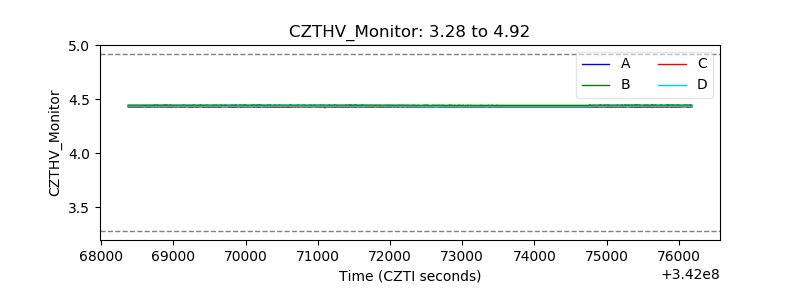 |
| D_VDD | 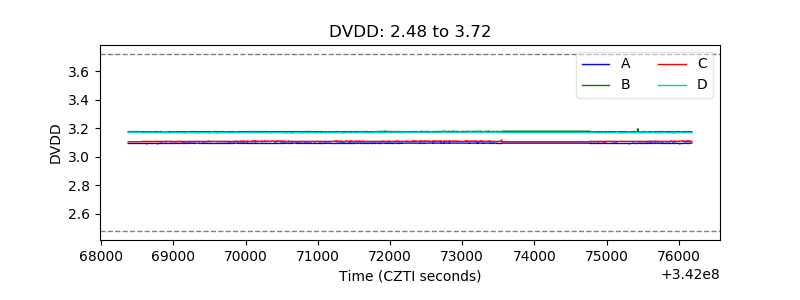 |
| Temperature 1 | 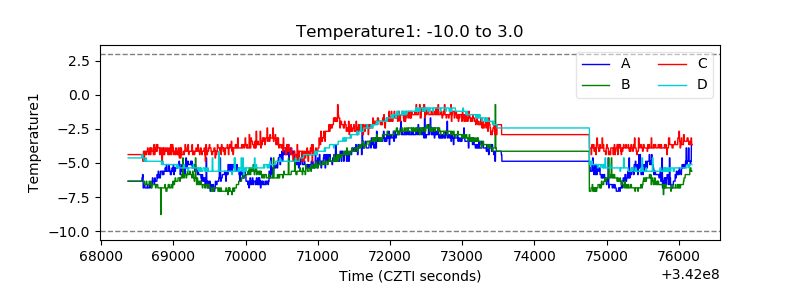 |
| Veto HV Monitor | 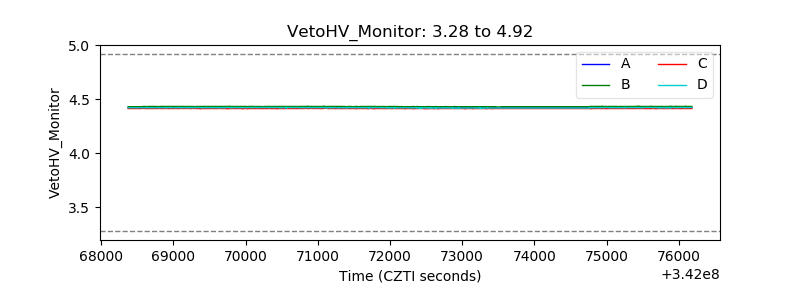 |
| Veto LLD | 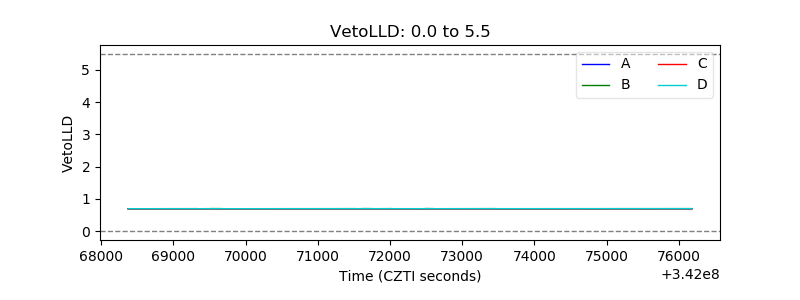 |
| Alpha Counter | 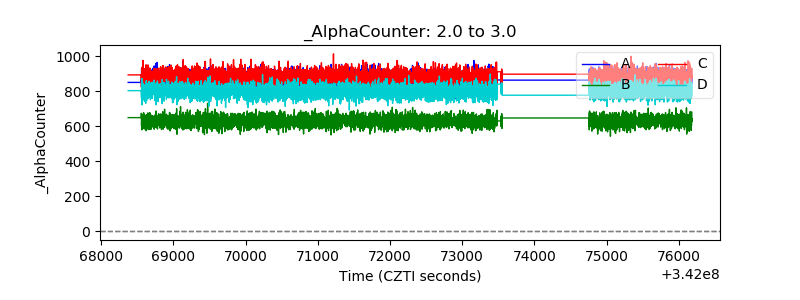 |
| _CPM_Rate | 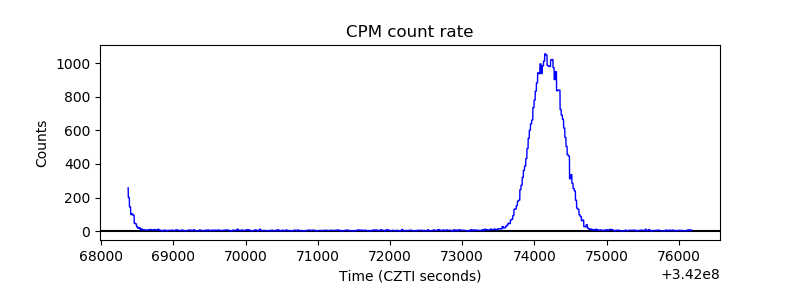 |
| CZT Counter | 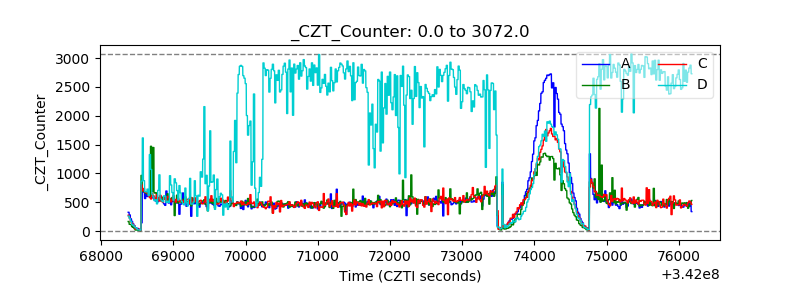 |
| +2.5 Volts monitor |  |
| +5 Volts monitor | 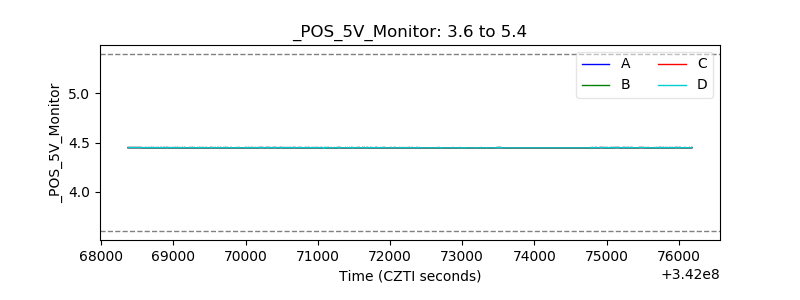 |
| _ROLL_ROT | 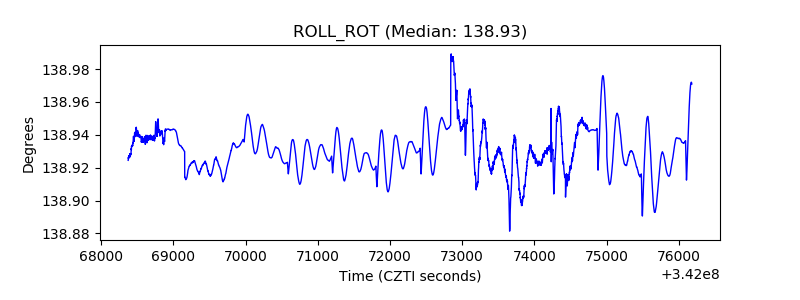 |
| _Roll_DEC | 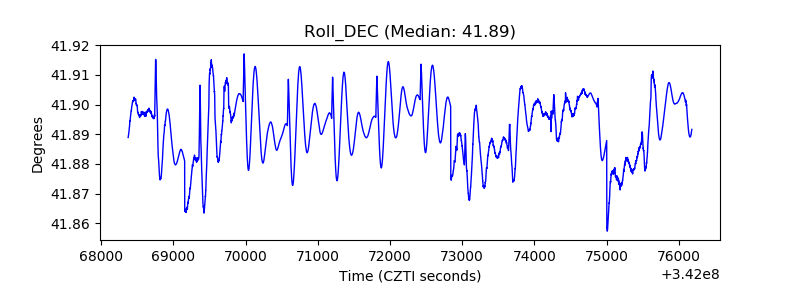 |
| _Roll_RA | 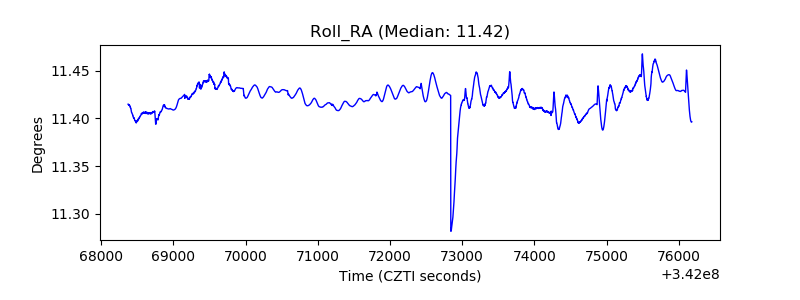 |
| Veto Counter | 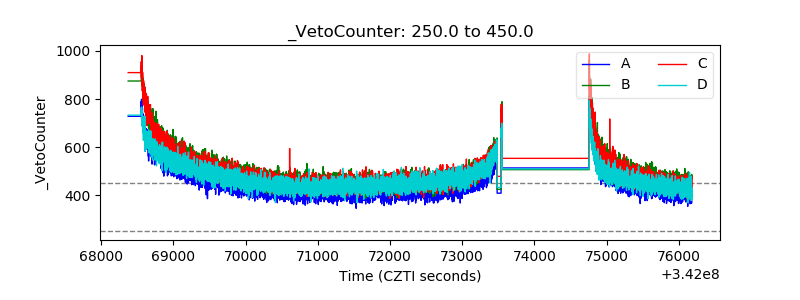 |